-
-
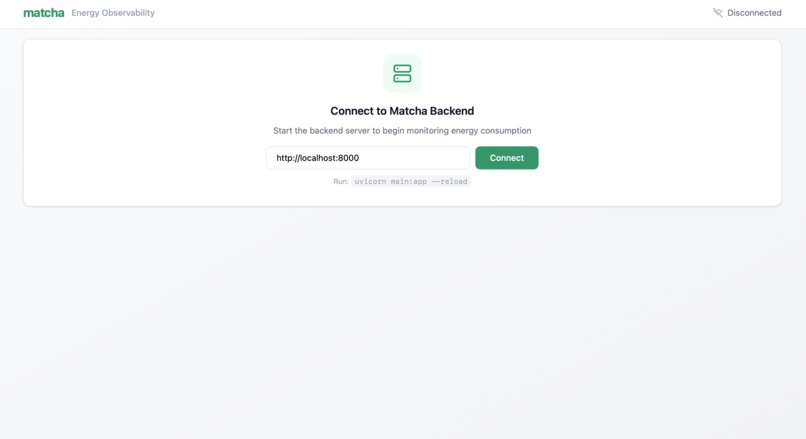
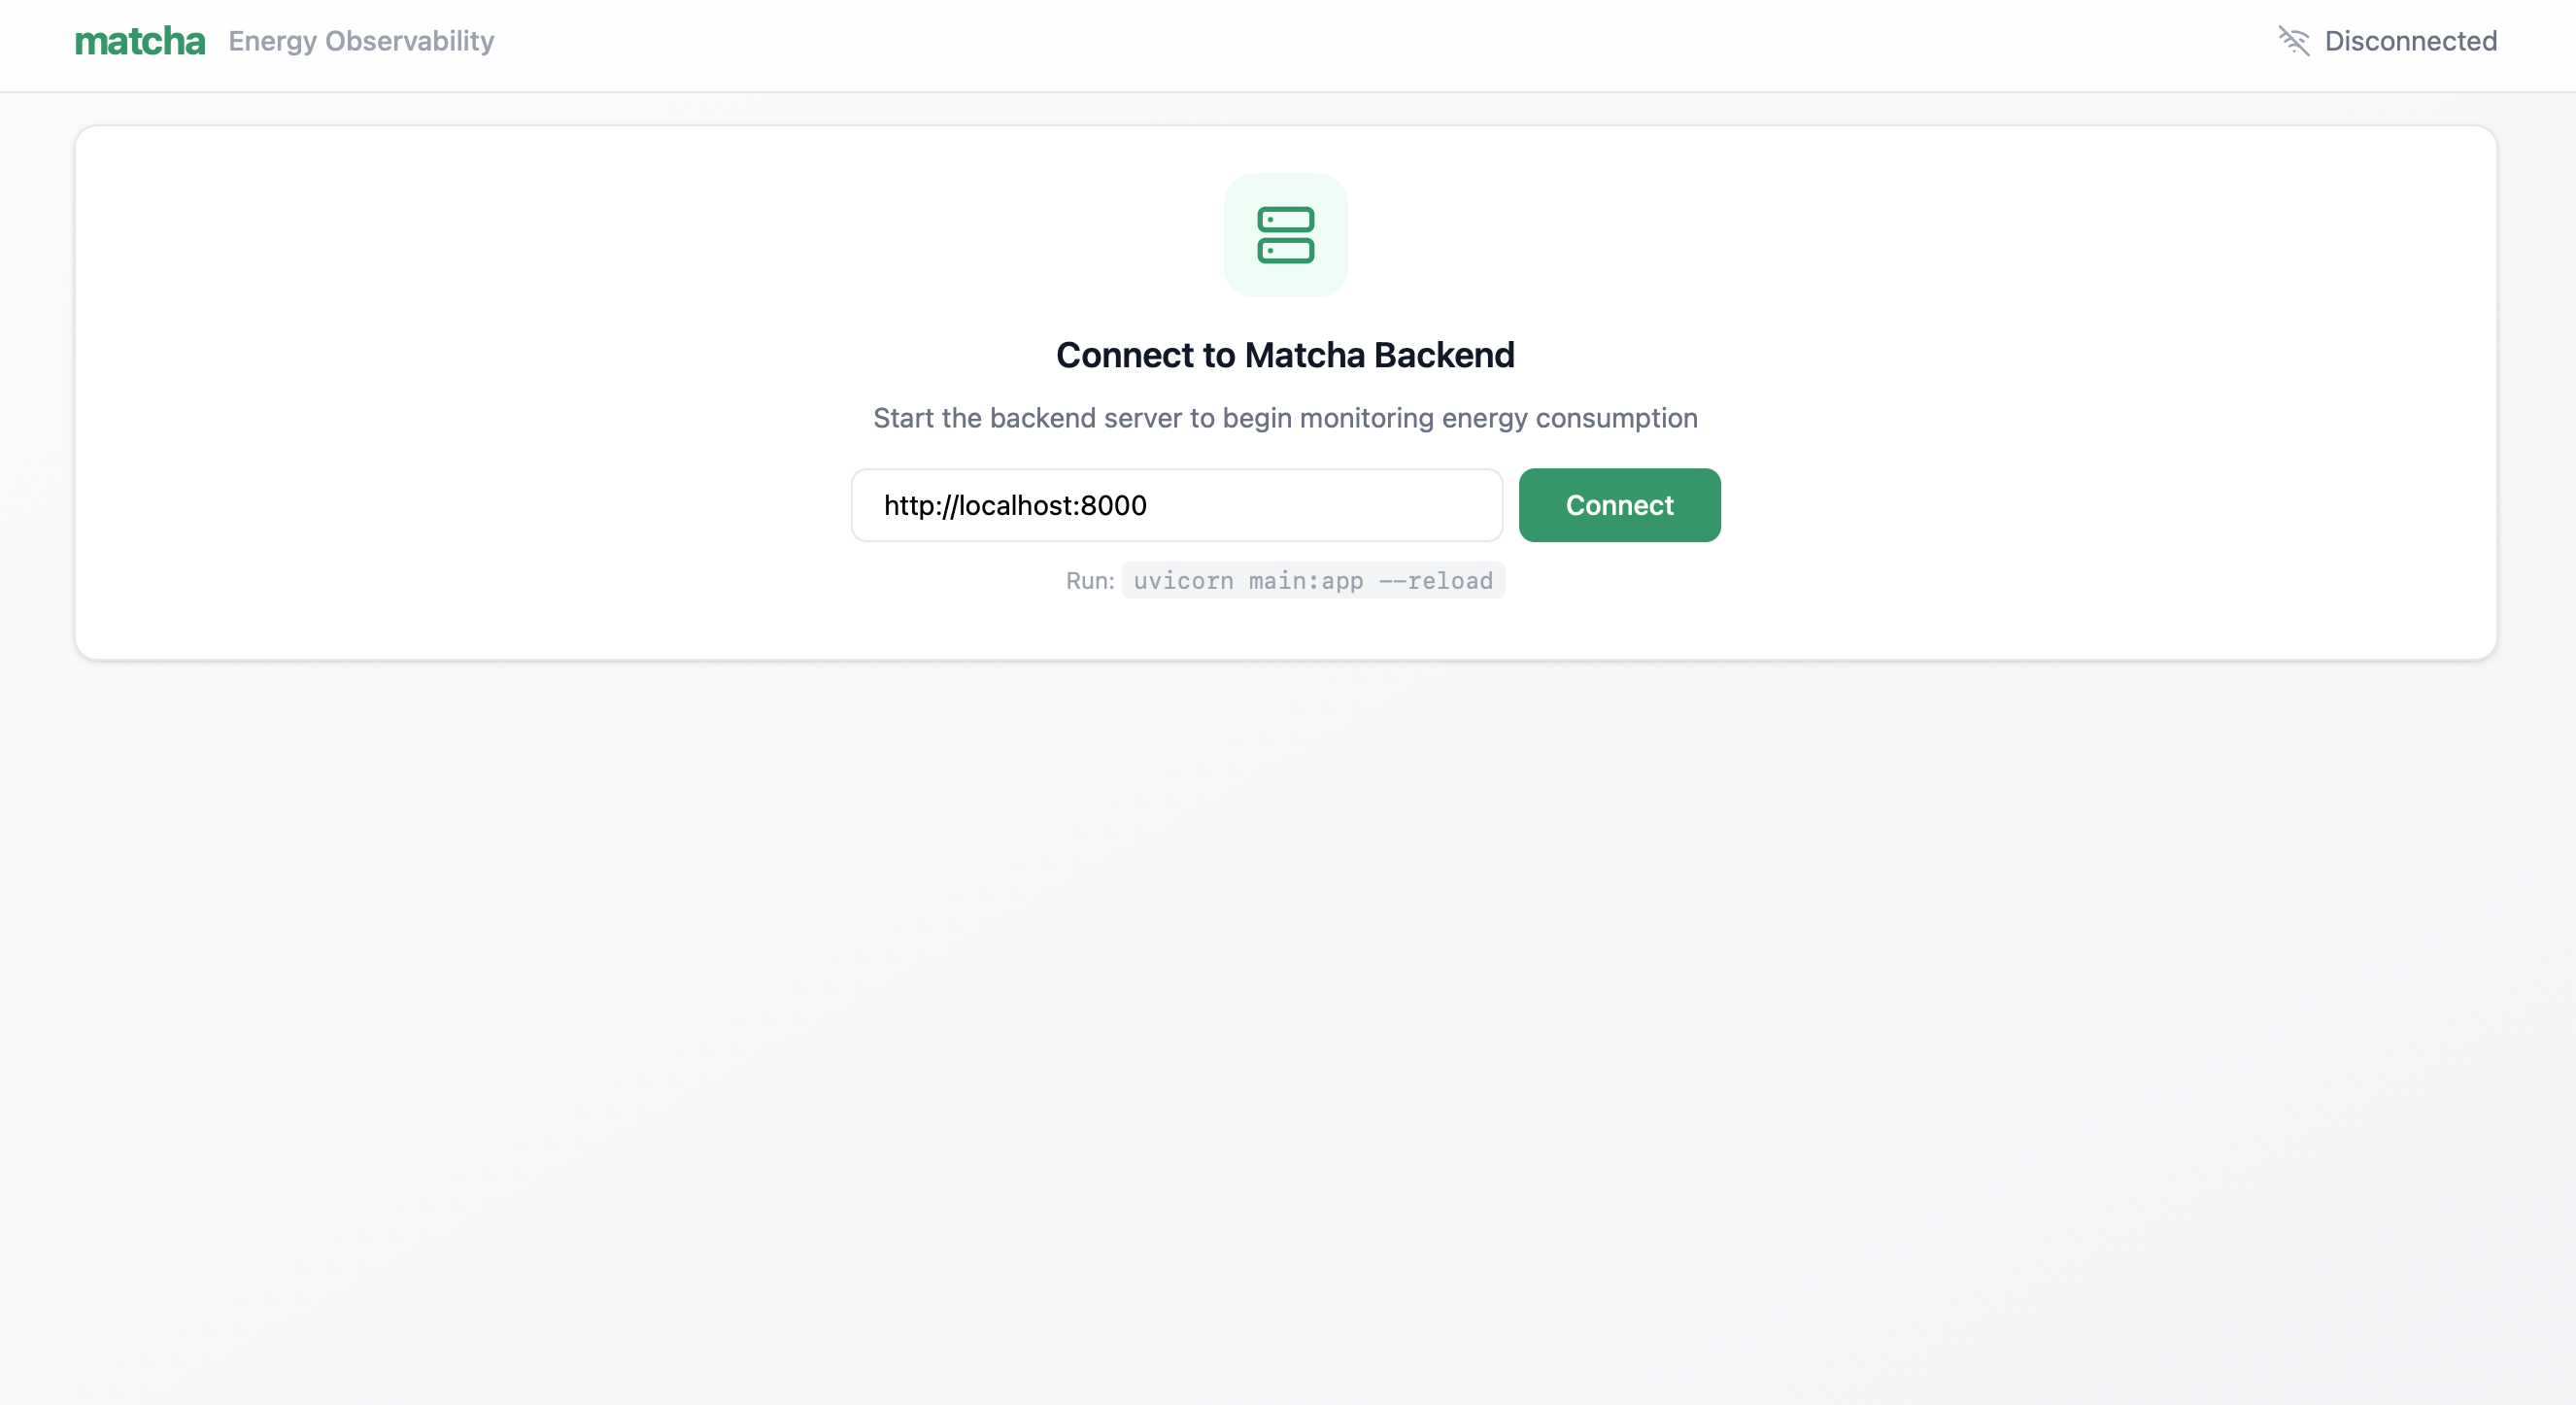
1: Connect your AI workload
-
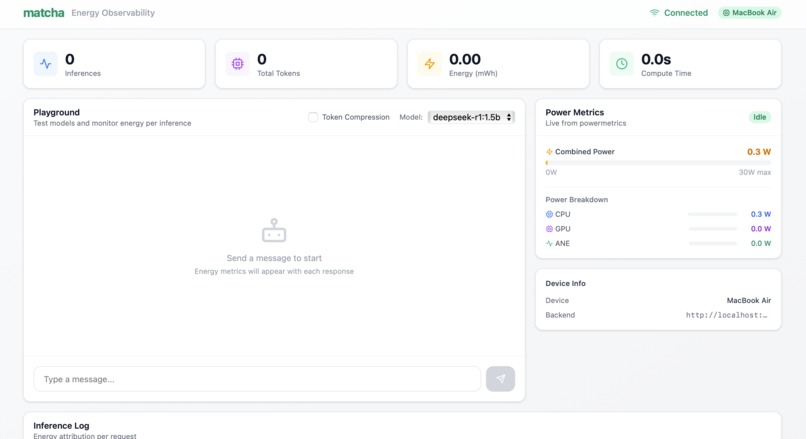
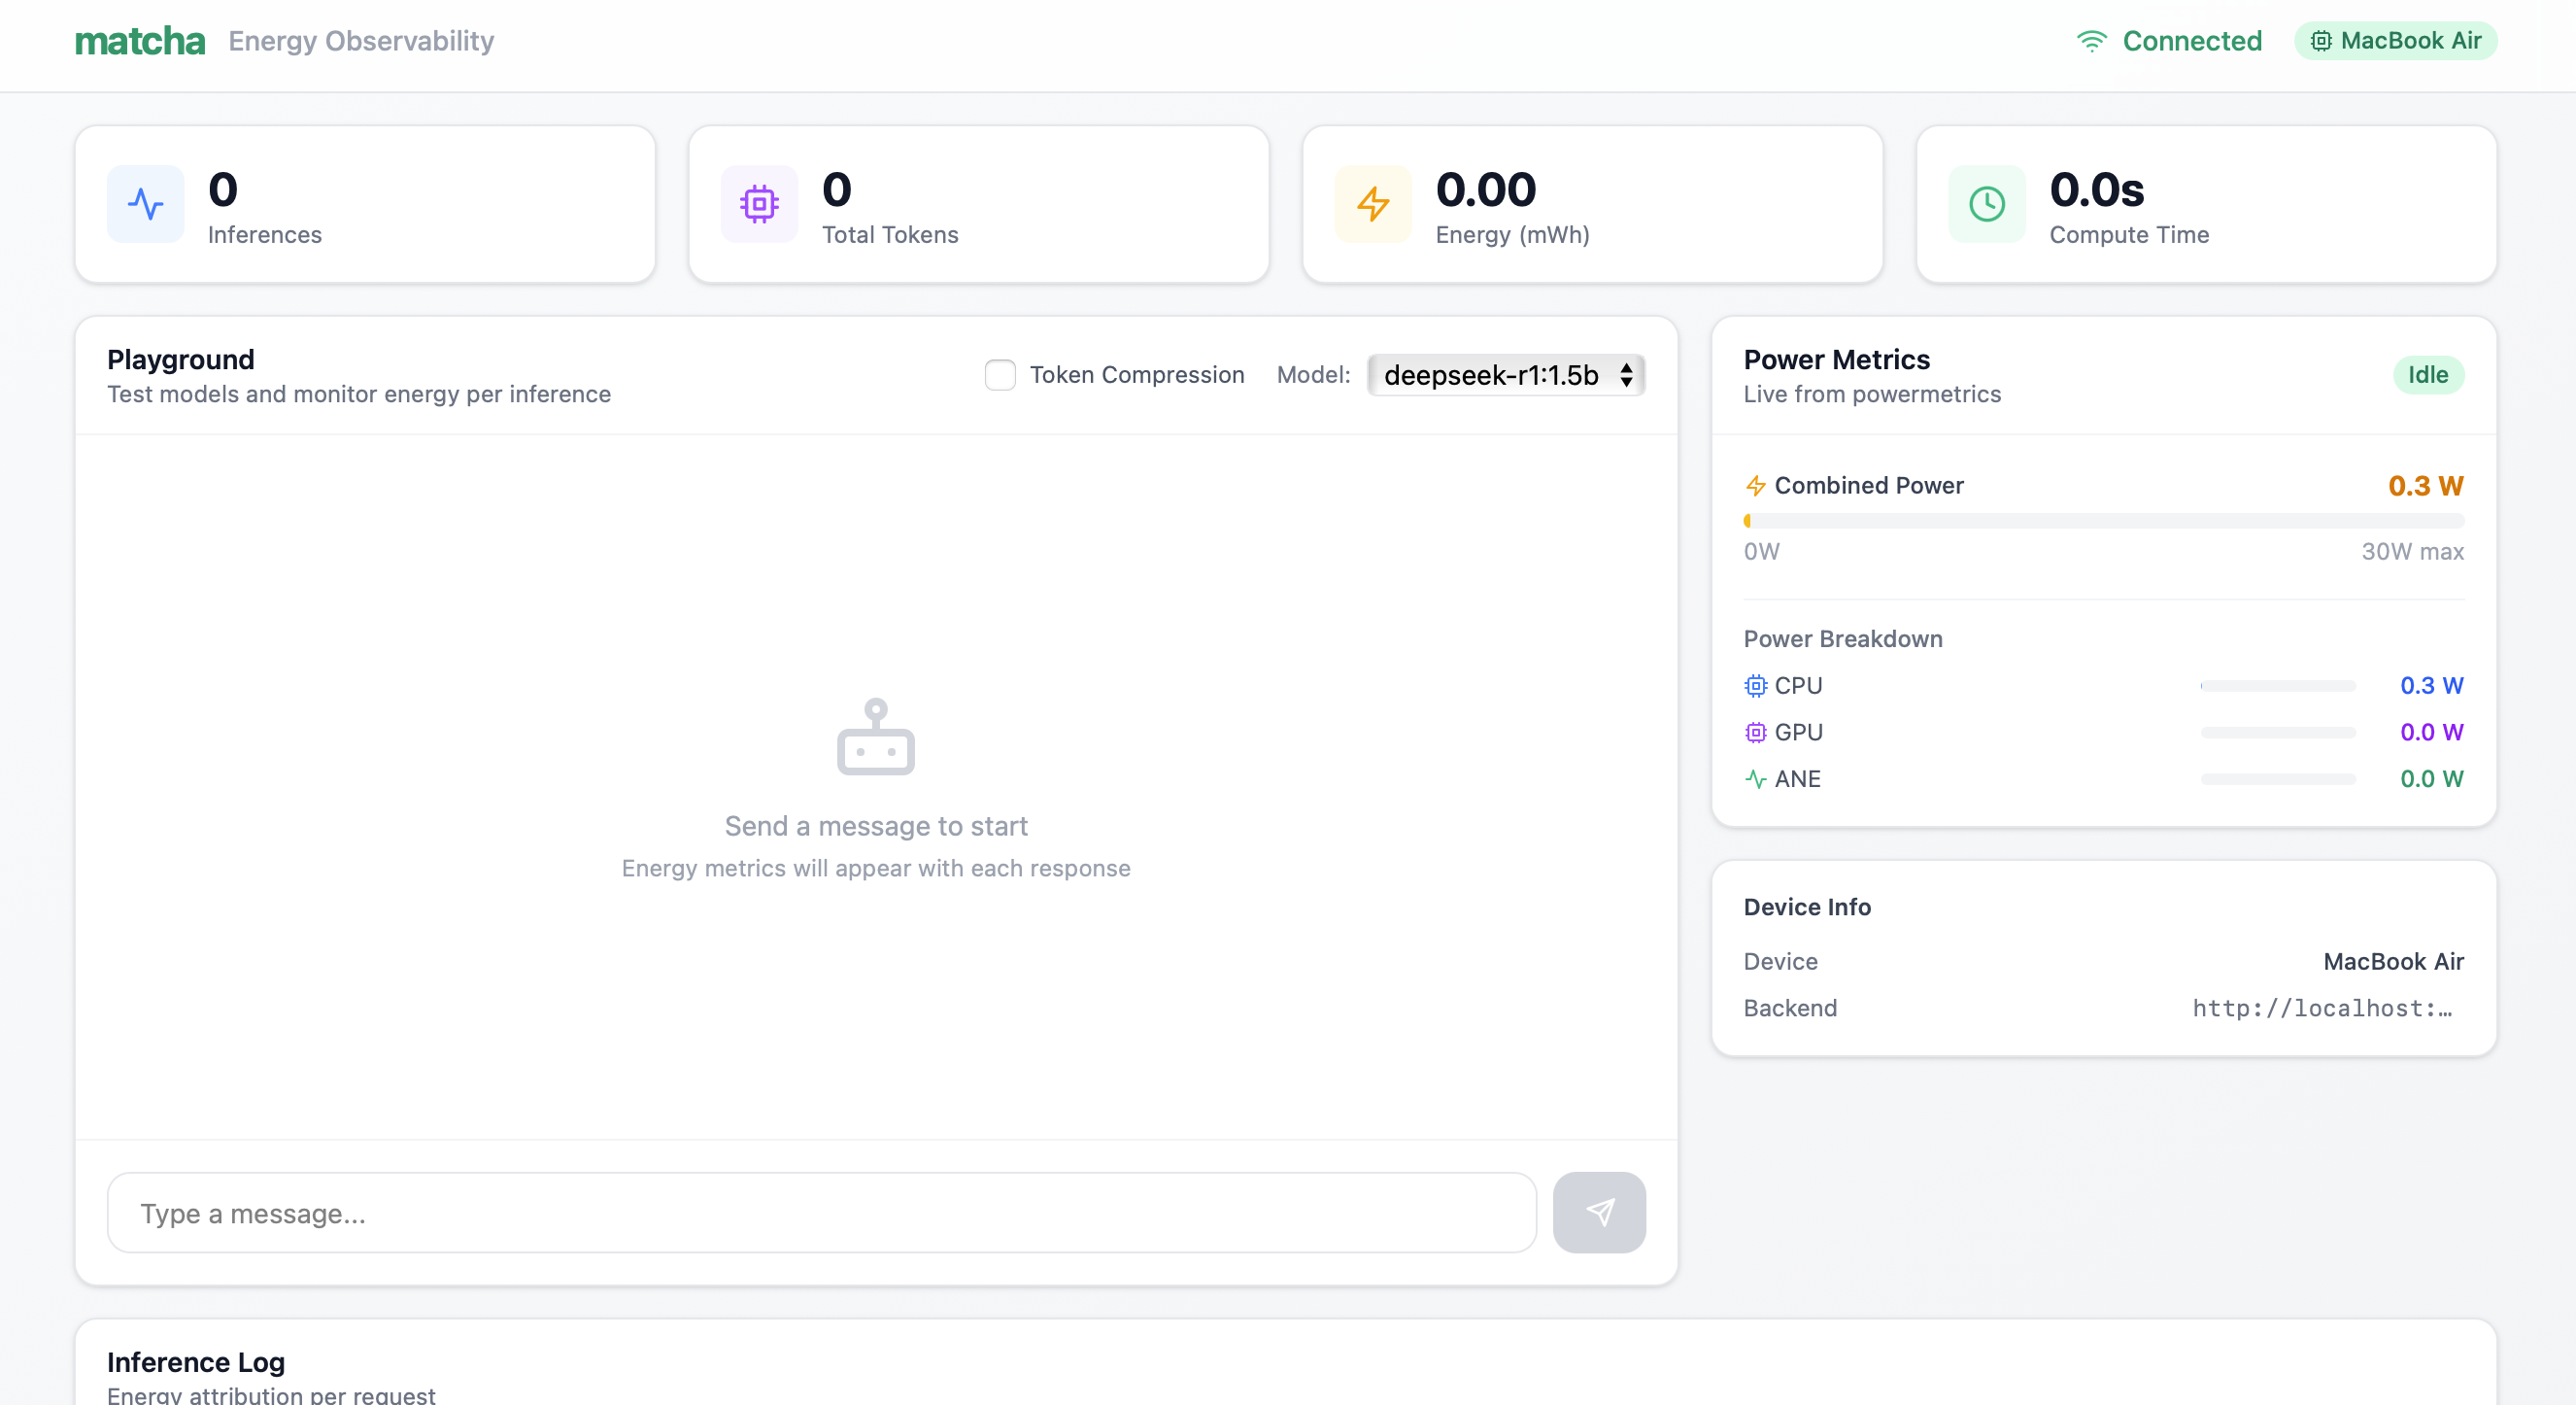
2: Dashboard during idle
-
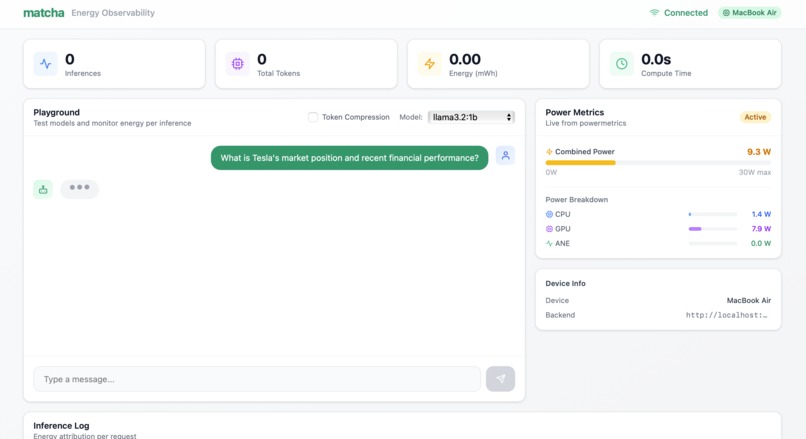
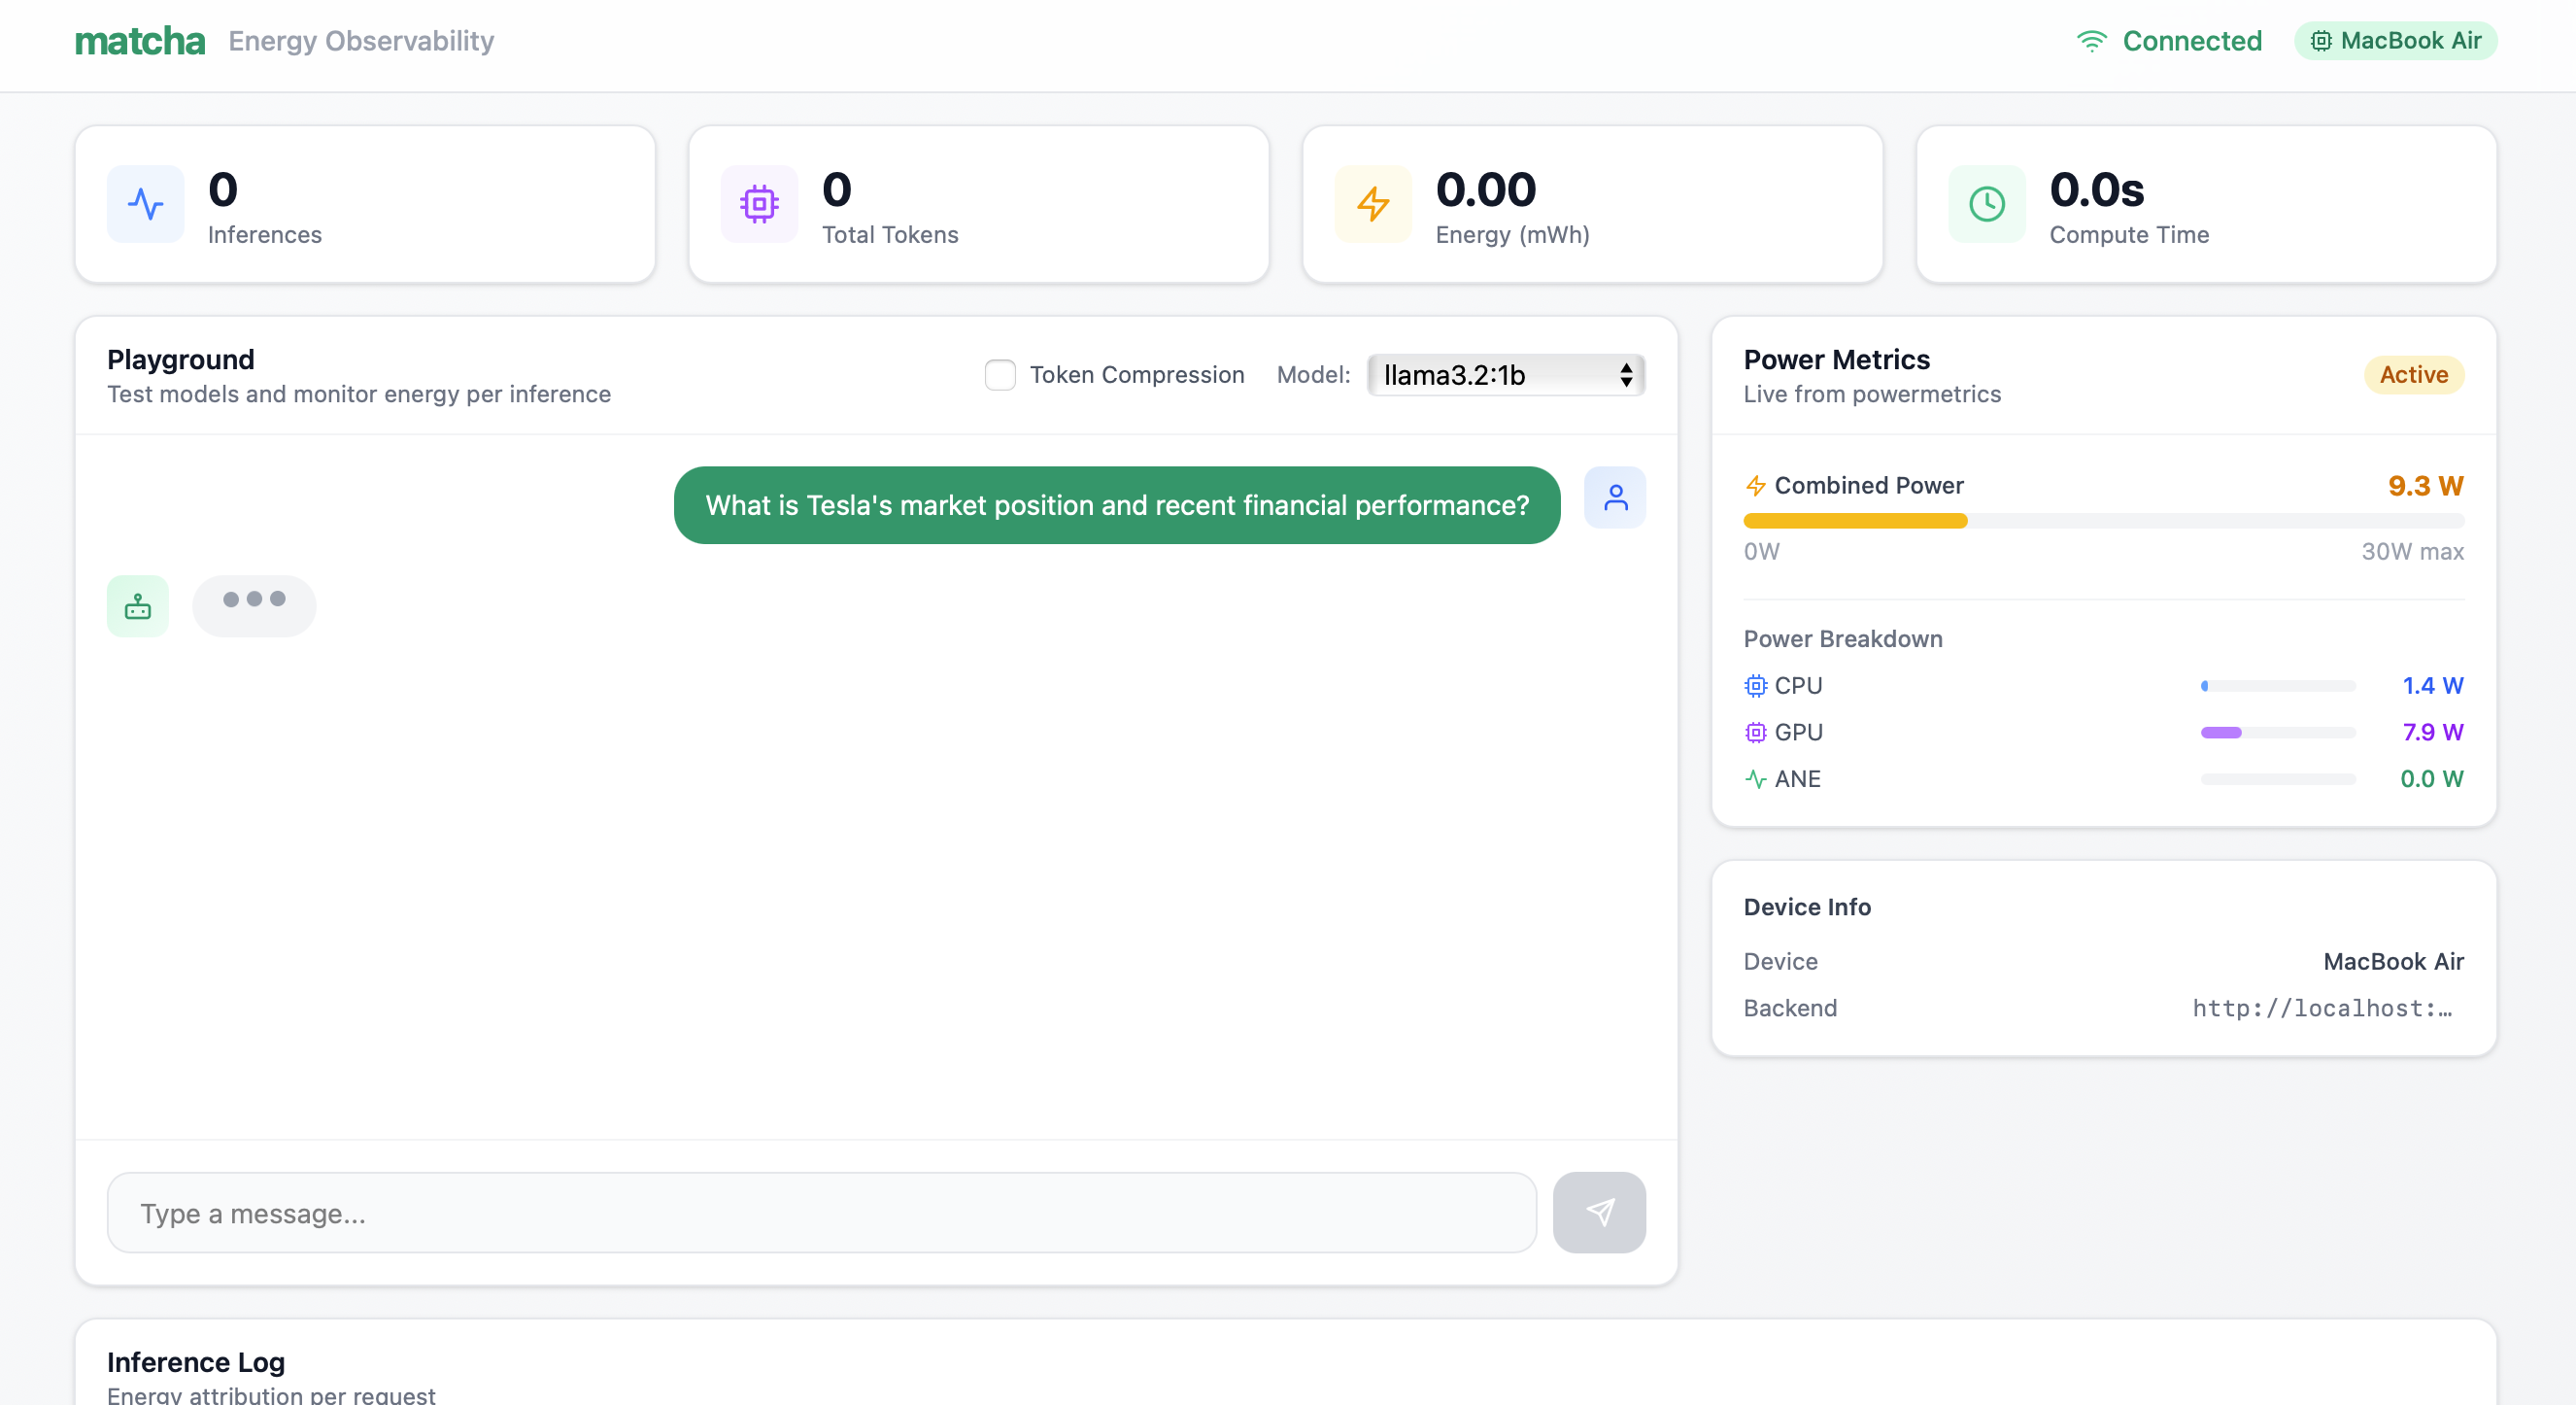
3. Powermetrics spike during inference
-
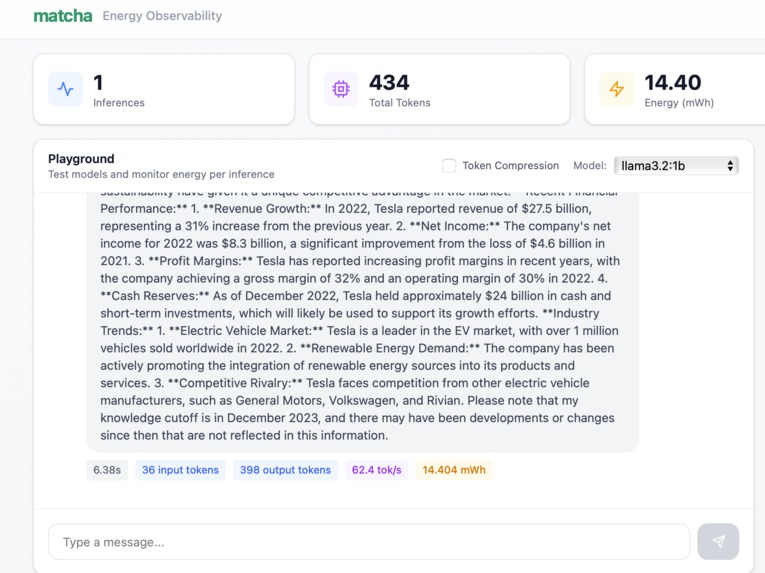
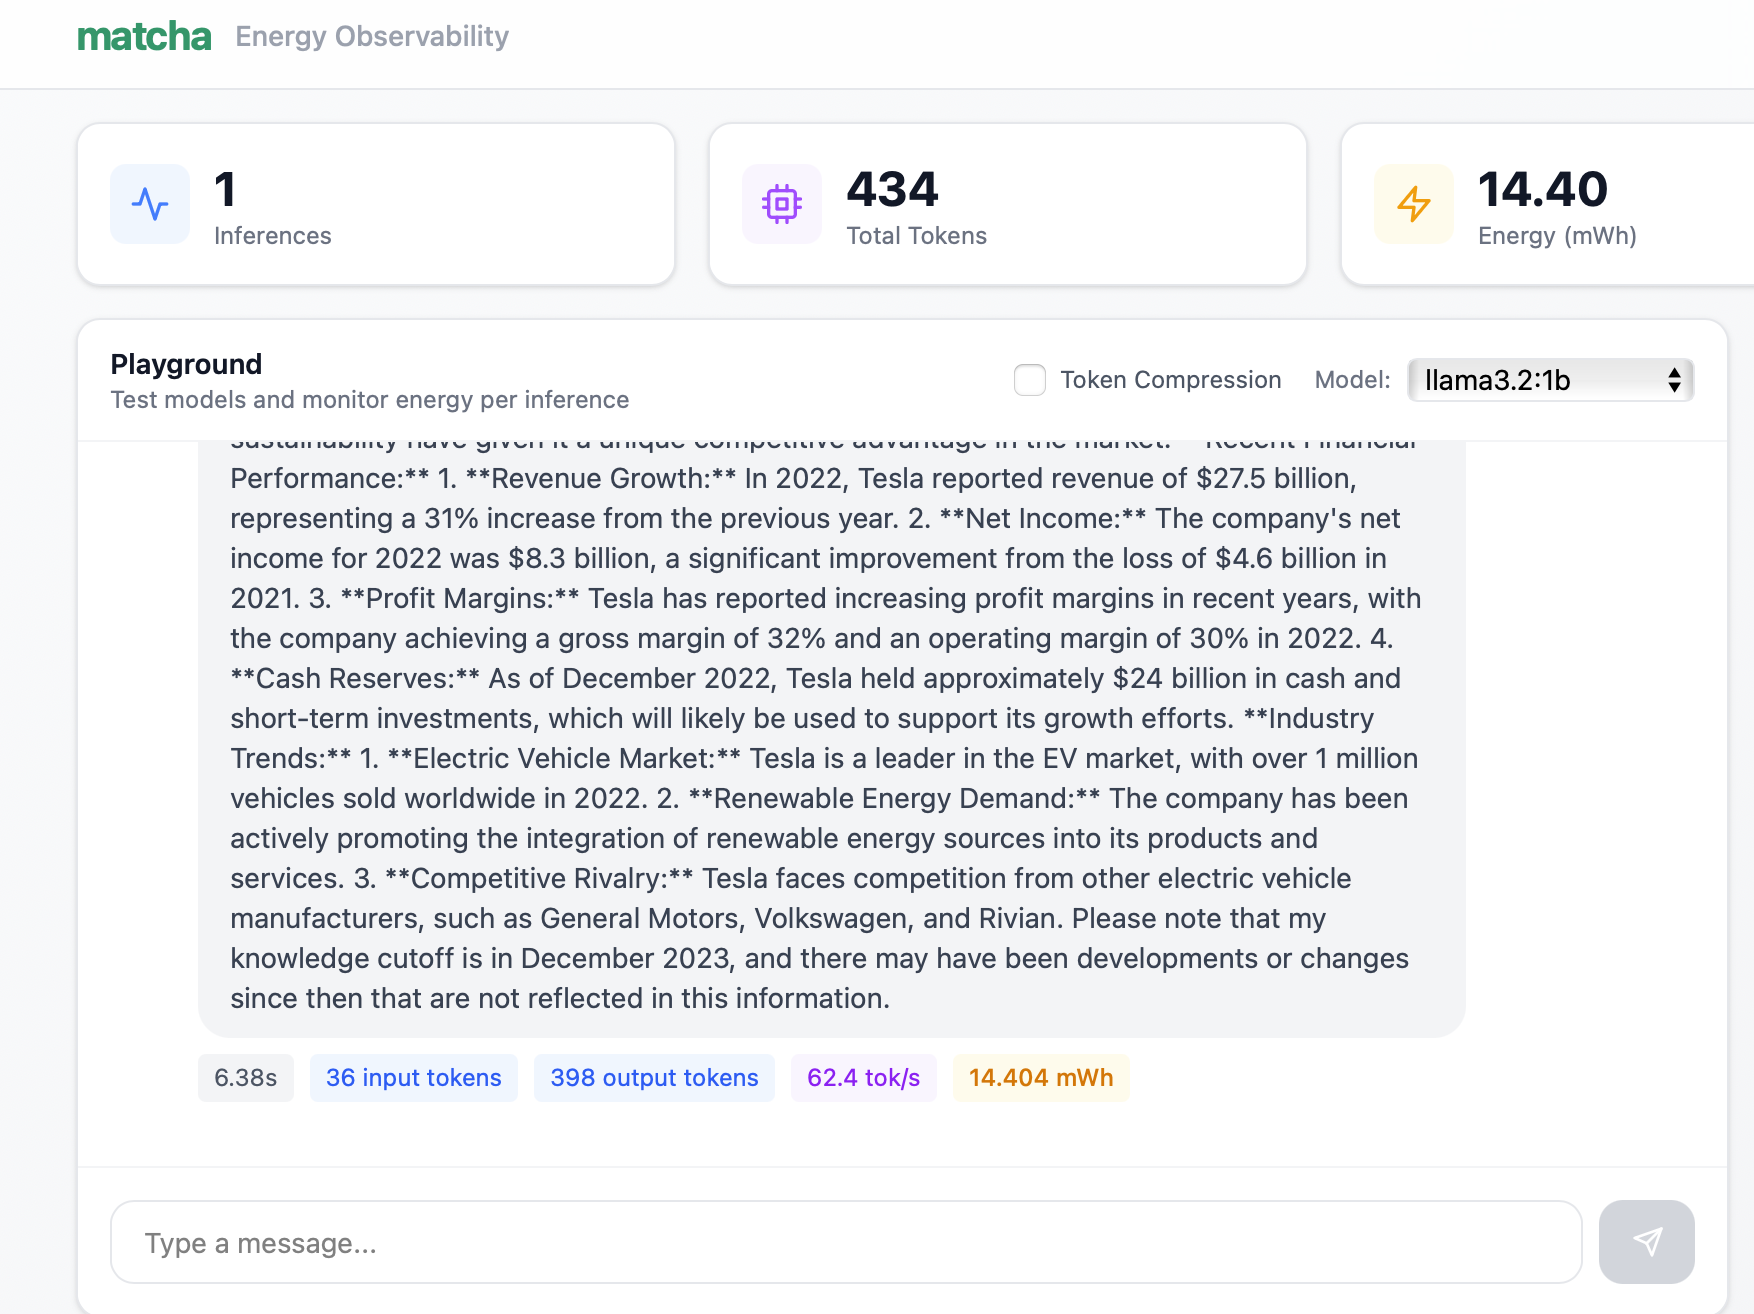
4. Output from llama3.2:1b, along with it's calculated metrics
-

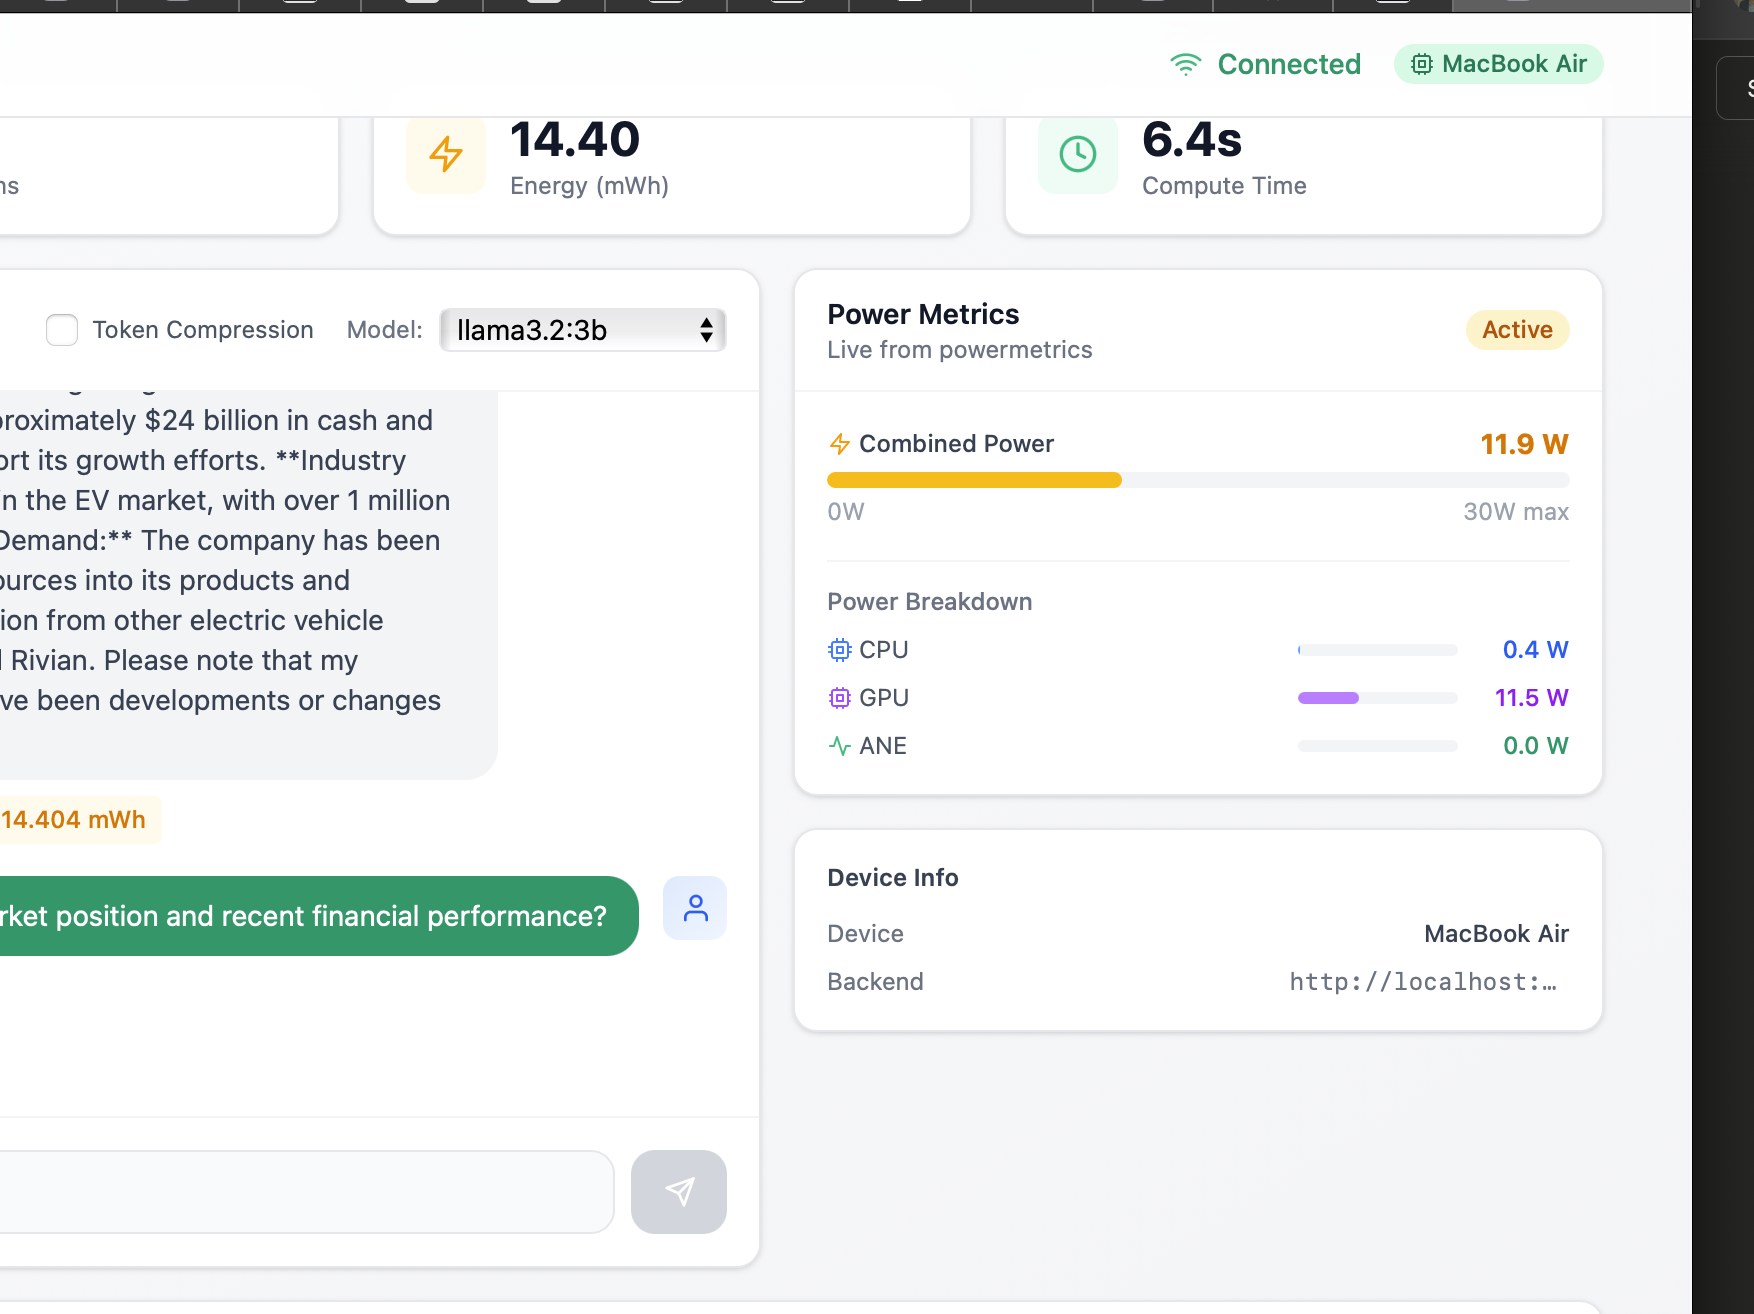
5. Closer view of GPU power metrics
-
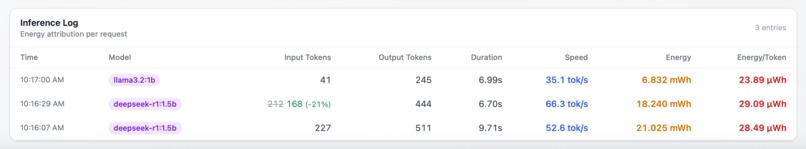
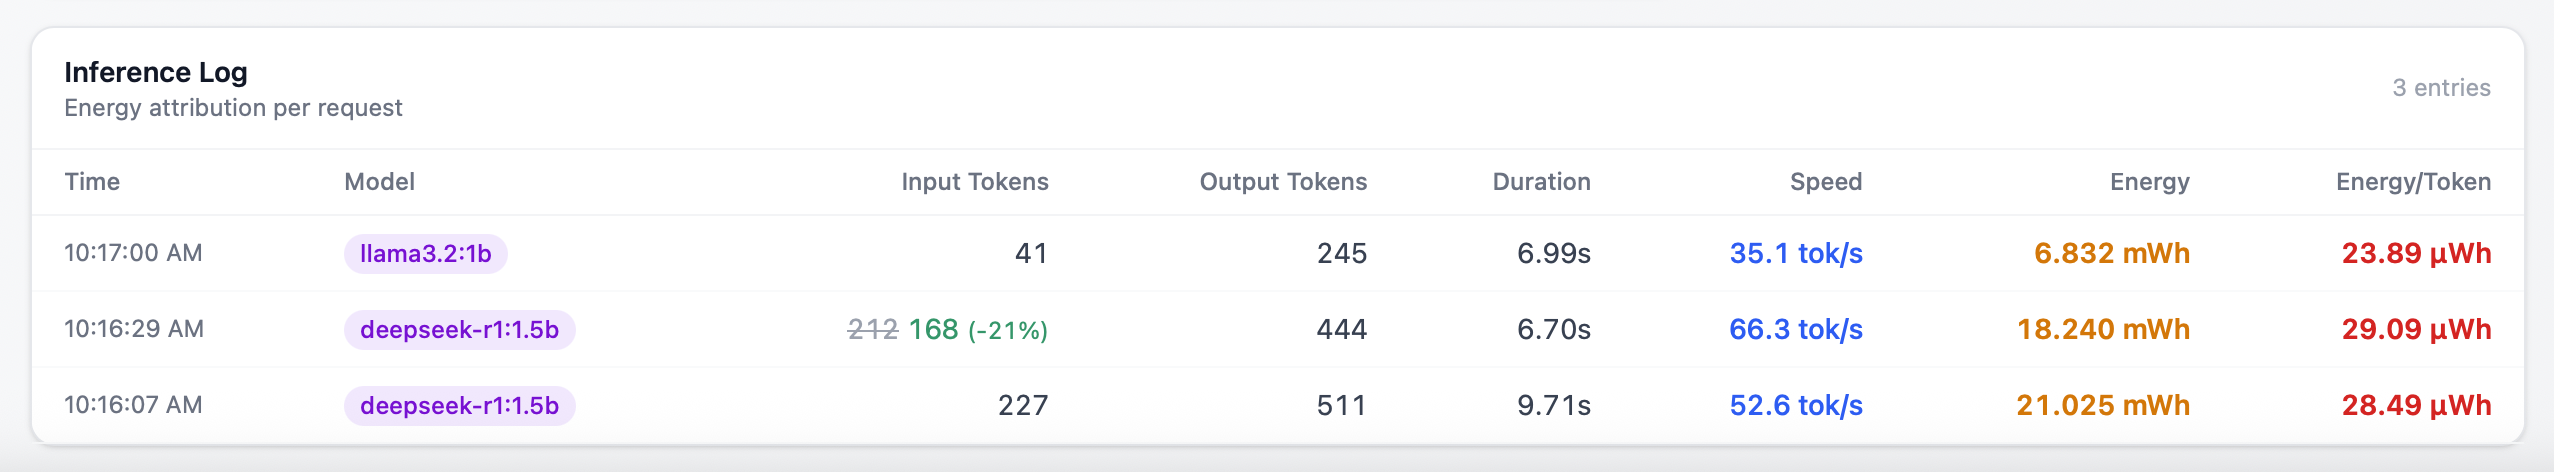
6. Inference logs to keep track of and compare models
-
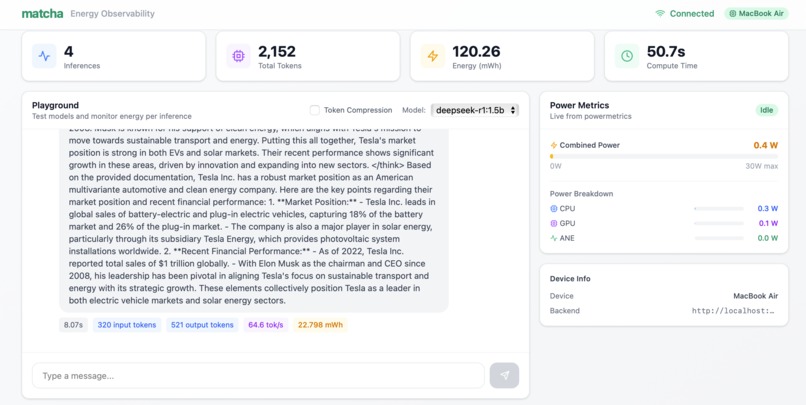
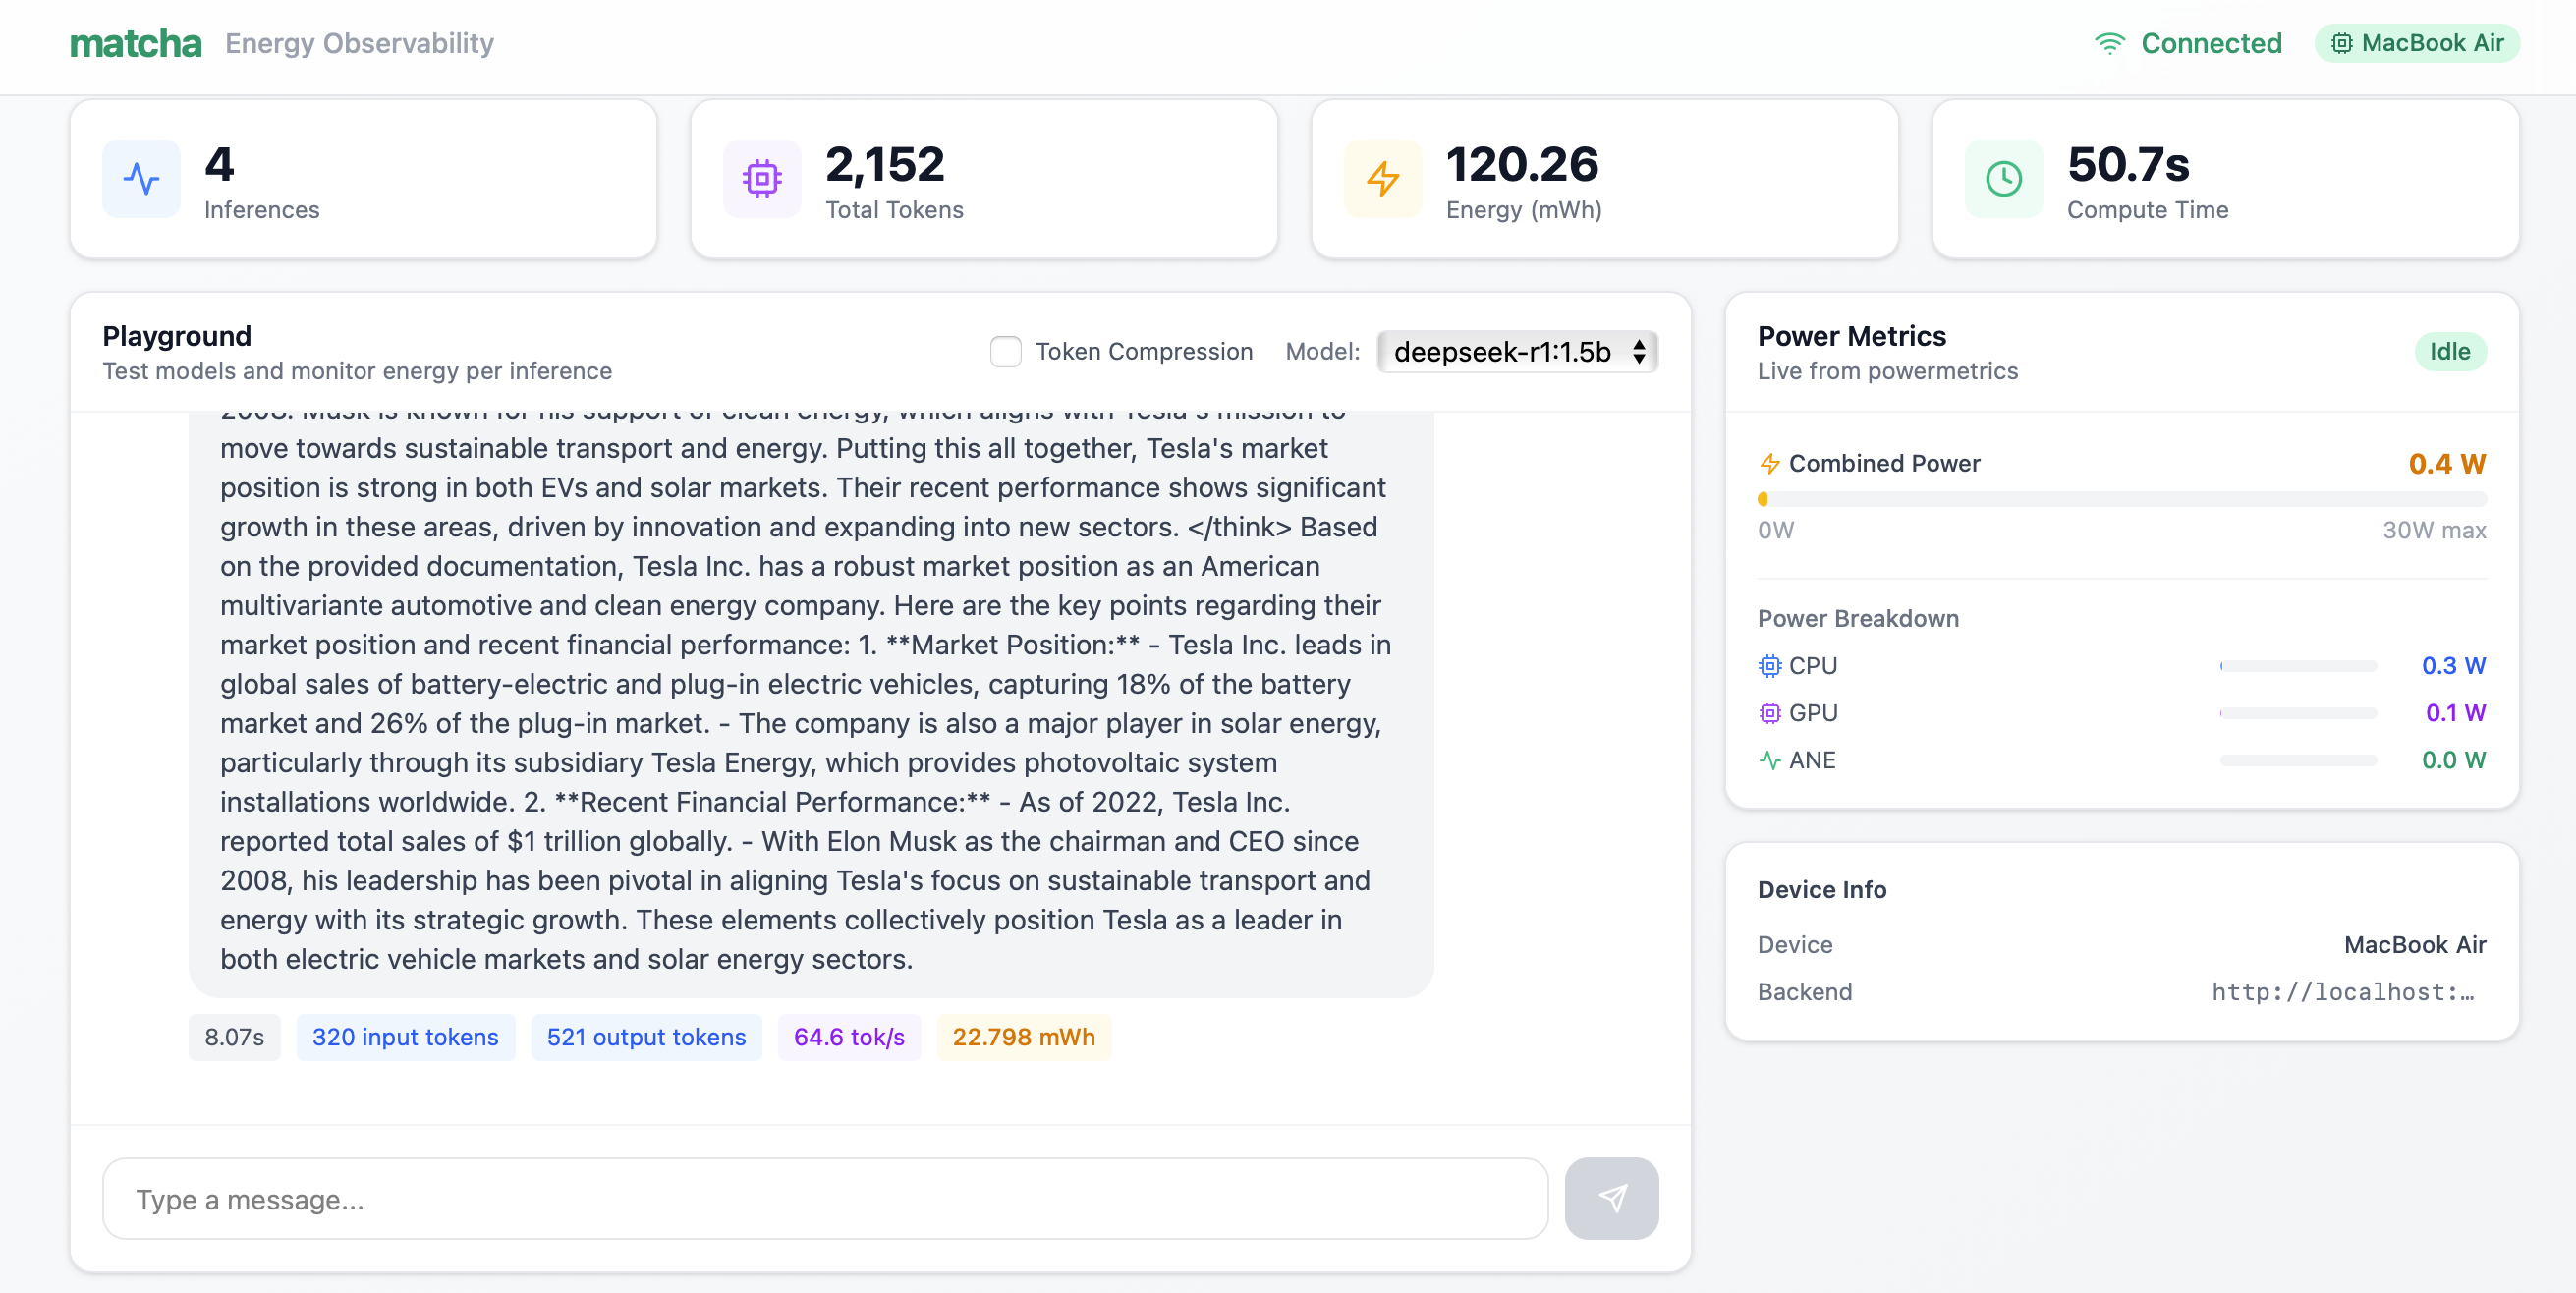
7. Output of deepseek-r1:1.5b on long context prompt
-
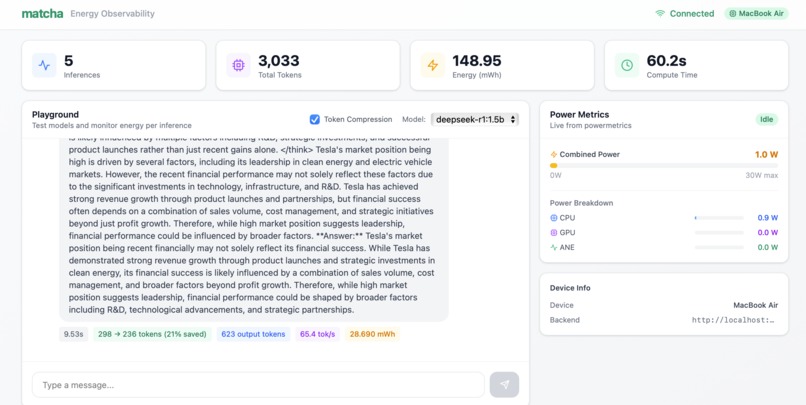
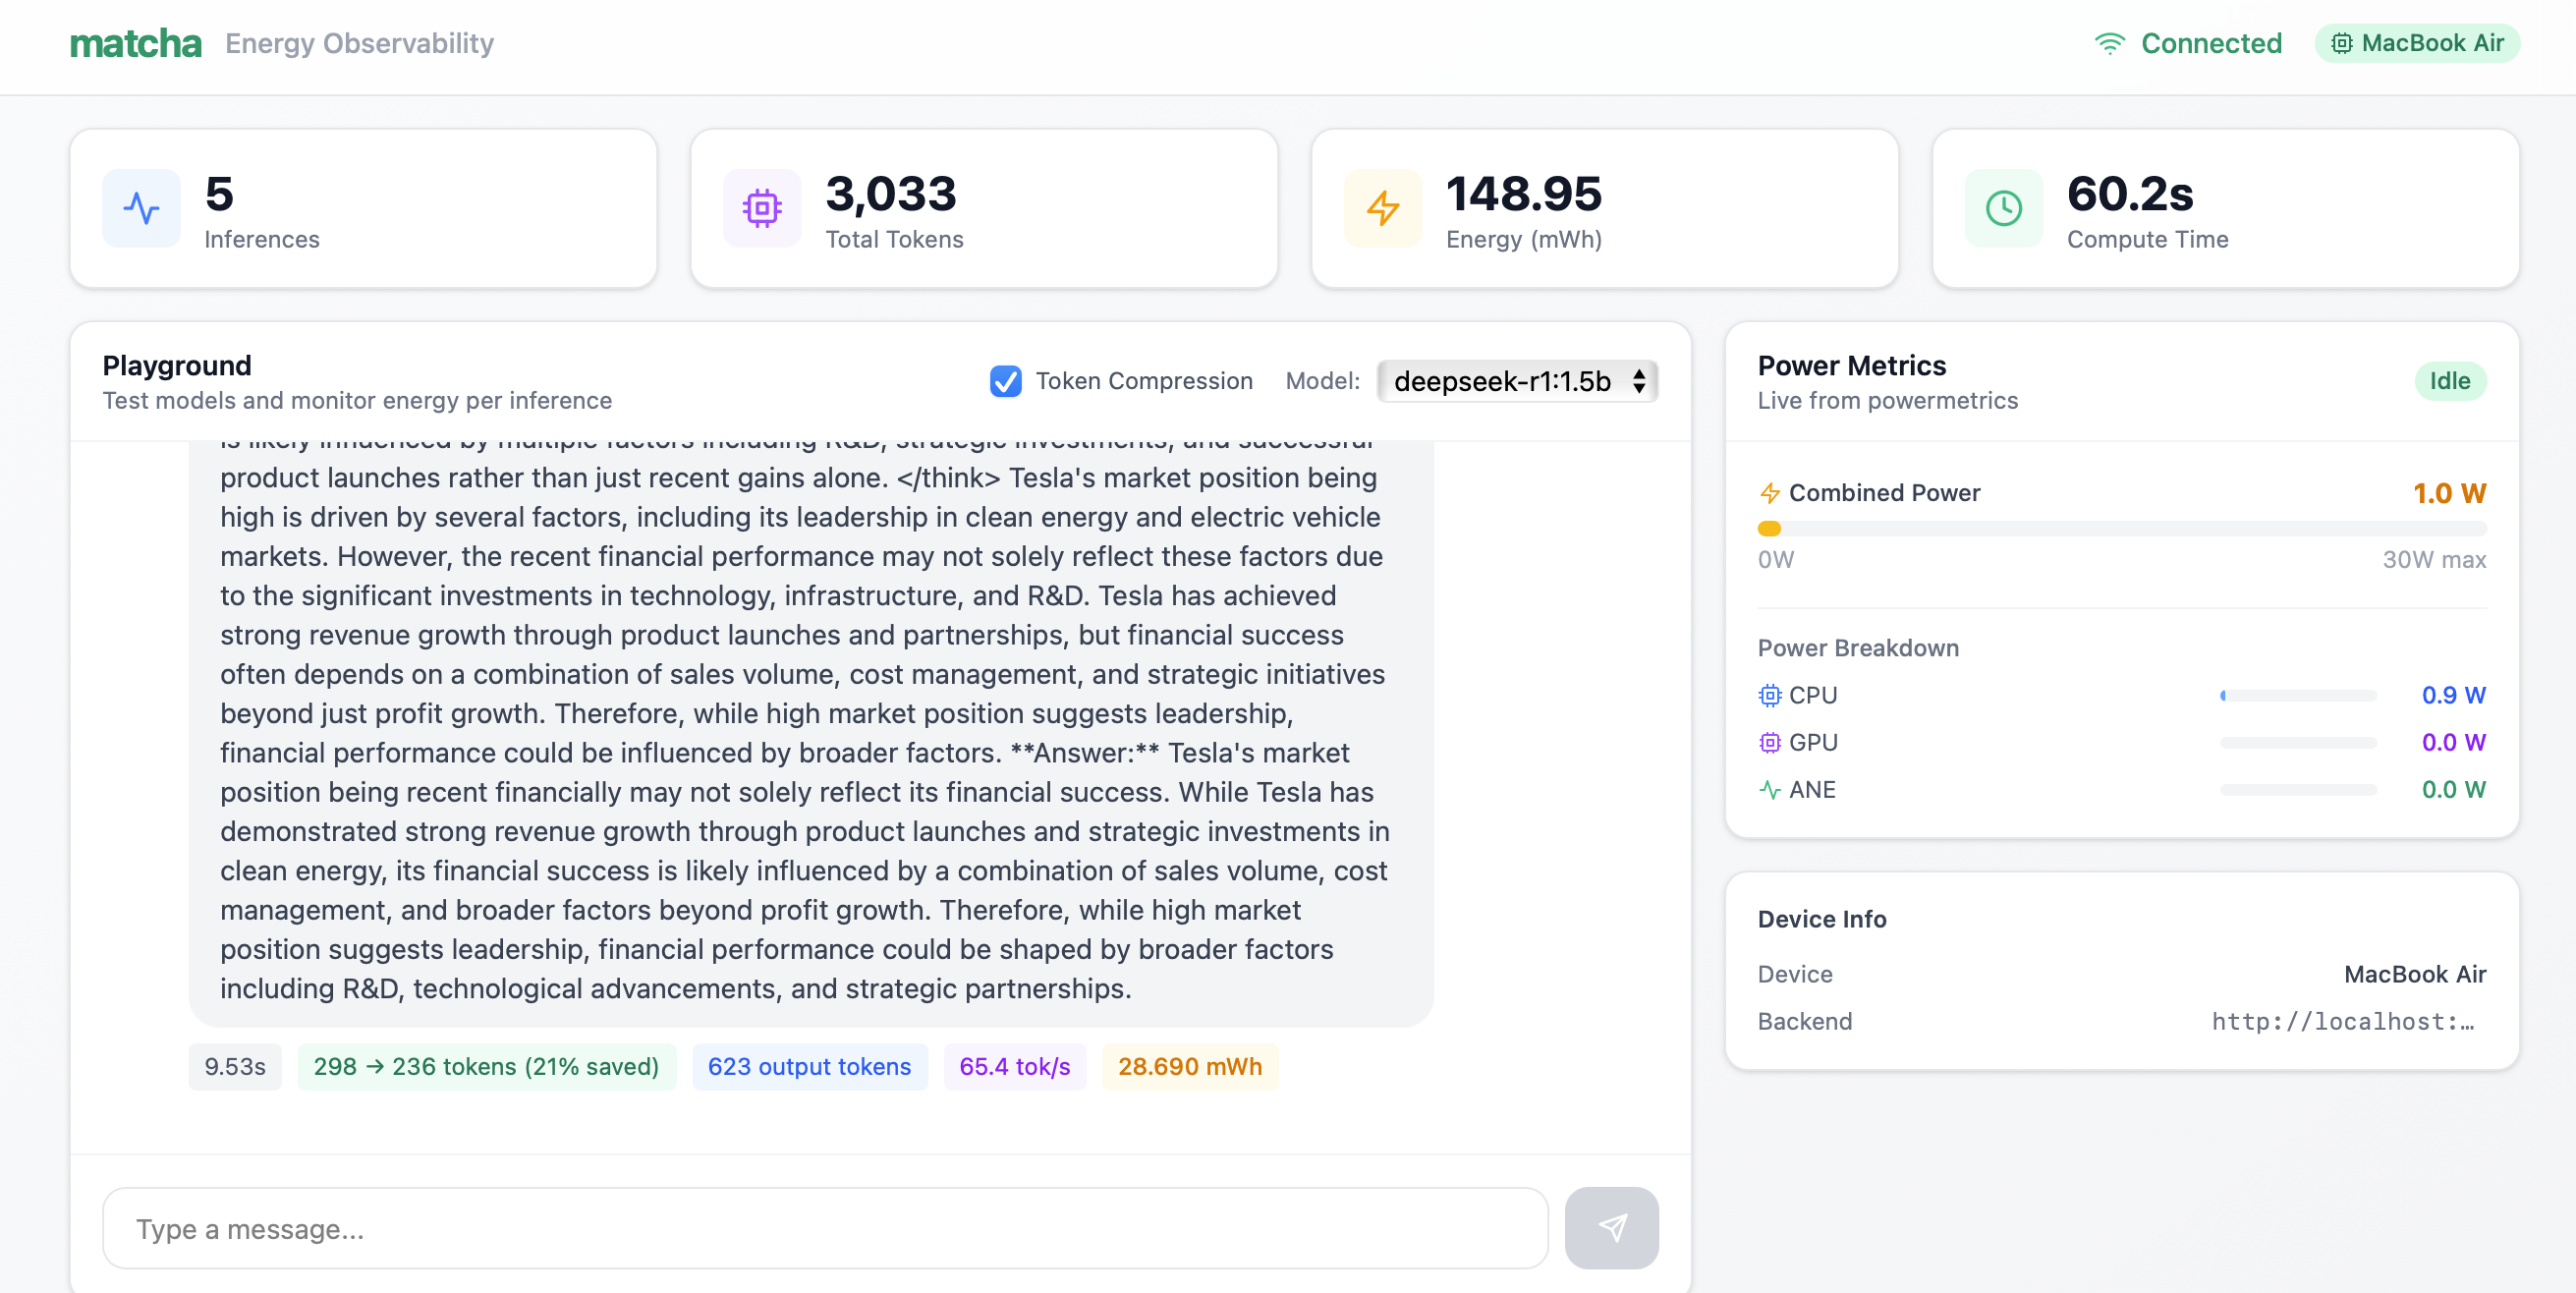
8. Output of deepseek-r1:1.5b on long context prompt with token compression
Inspiration
Imagine it's 2028. AGI is here. Every model can write code, analyze data, and reason at human level. How do you choose between them?
Not accuracy–they're all smart enough. Not features–they all do everything. The only differentiator is cost. And that cost is energy.
Today, companies are shifting to run LLMs on their own GPUs – banks, hospitals, and tech companies for privacy, compliance, and cost control. They're spending millions on infrastructure and observability tools, but they are missing out on one of the key metrics – energy cost per task.
They know their GPU utilization. They don't know which model, which prompt, or which request is actually burning through their power budget. We are changing that with Matcha.
What it does
Matcha provides per-request energy attribution for AI workloads running on local GPUs. For every inference:
- Energy consumed (in mWh)
- Tokens processed (input & output)
- Duration & throughput (tokens/s)
- Power breakdown (CPU, GPU, ANE)
But Matcha isn't just monitoring—it's optimization guidance:
Model comparison: Same prompt on llama3.2:1b vs 3b? The 3B model uses 3.5x more energy for the same answer. Now you know. Now you can switch.
Token compression: Integrated with Token Company to compress prompts by 35%, cutting energy consumption by 30%. One toggle. Immediate savings.
See the problem. Fix the problem. Measure the impact.
How we built it
Backend (Python/FastAPI):
- Real-time power monitoring via Apple's
powermetrics - Ollama integration for local LLM inference
- Token Company SDK for prompt compression
- Energy attribution engine that correlates power readings with inference requests
Frontend (React/Vite/Tailwind):
- Live power metrics dashboard updating every second
- Interactive playground for model testing
- Inference log with per-request energy attribution
- One-click model switching and compression toggle
The Core Calculation:
Energy (Wh) = Average Power (W) × Duration (h)
We capture power readings throughout each inference window, then attribute that energy to the specific request. Not estimates–real measurements from the hardware.
Challenges we ran into
Hardware constraints for demo: Our target platform is NVIDIA GPUs (H100, A100) using DCGM for power monitoring. But for the hackathon demo, we didn't have access to dedicated GPU hardware–so we adapted to run on MacBook M4 using Apple's powermetrics. The architecture remains the same; only the power source changes.
Power measurement timing: powermetrics on Mac updates every ~1 second. We had to carefully track inference start/stop times and interpolate power readings to get accurate per-request attribution.
Fair model comparison: The 1B model runs at 26 tok/s while 3B runs at 8.6 tok/s. Faster models use less energy partly because they finish sooner. We learned that speed and efficiency are deeply connected.
Accomplishments that we're proud of
Real measurements, not estimates. We're reading actual power draw from hardware, not guessing from utilization percentages.
Actionable insights. We don't just show you a dashboard—we show you exactly how to reduce energy: switch to a smaller model (3.5x savings), enable compression (30% savings).
Proved the compression-energy link. Everyone talks about token compression saving API costs(including The Token Company on their website). We showed it saves actual energy on local hardware.
Clear demo, clear value. In under 2 minutes: model comparison shows the problem, compression shows the solution, inference log shows the proof.
What we learned
Energy doesn't scale linearly with model size. 3B isn't 3x more expensive than 1B—it's 3.5x, because larger models are also slower.
Observability without action is just a dashboard. The value isn't in showing metrics. It's in showing what to do about them.
The efficiency race is coming. As models converge on accuracy, energy becomes the differentiator. The companies measuring it now will have a massive advantage.
What's next for Matcha
Immediate roadmap:
- NVIDIA GPU support via DCGM (H100, A100, RTX)
- Lightweight Matcha Agent with auto-detection for any GPU type
- Python SDK with simple decorators for zero-config instrumentation
Product vision:
- OpenTelemetry-compatible ingestion (drop-in for existing observability stacks)
- Multi-GPU cluster monitoring
- Team-based cost allocation
- Automated optimization recommendations
The goal: Become the standard for AI energy observability. Every company running local AI infrastructure uses Matcha to understand and optimize their true compute costs.

Log in or sign up for Devpost to join the conversation.