-
-
Landing Page
-
Back Test Strategies
-
Market Backtest
-
Underrated players
-
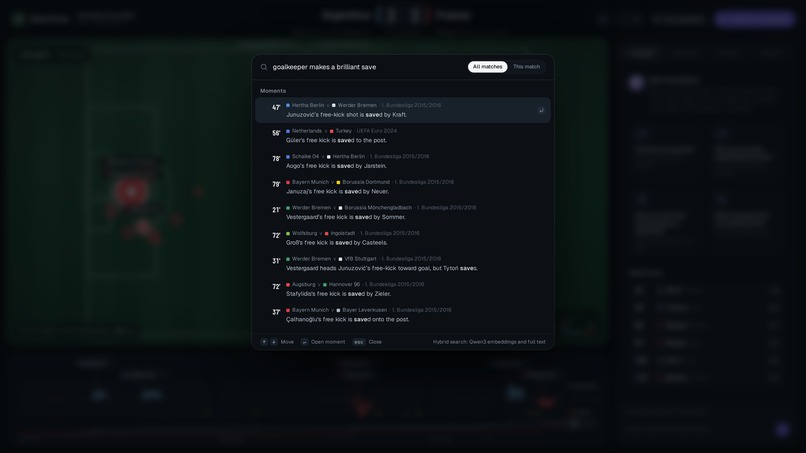
Moment Search
-
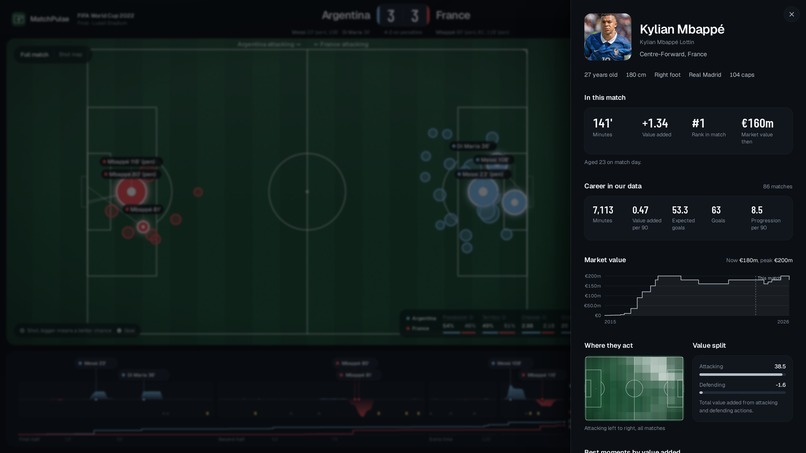
Player Profile
-
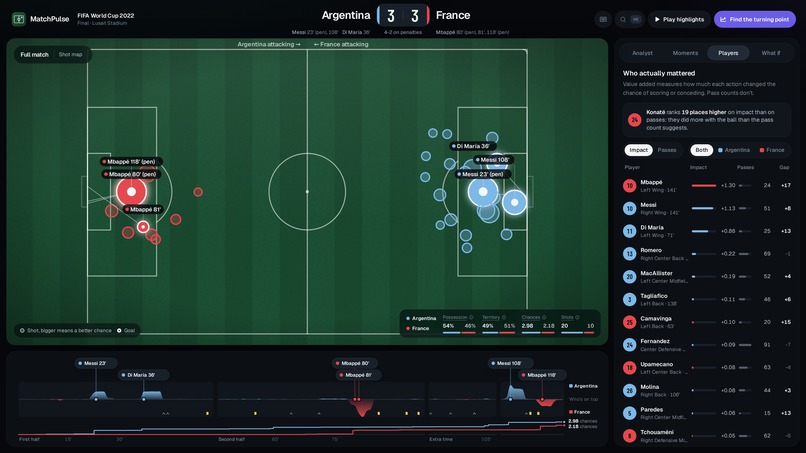
Who mattered
-
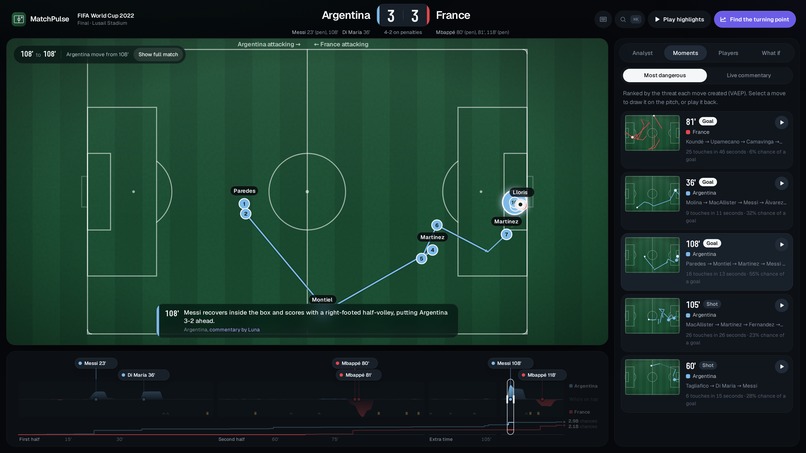
Dangerous moments
-
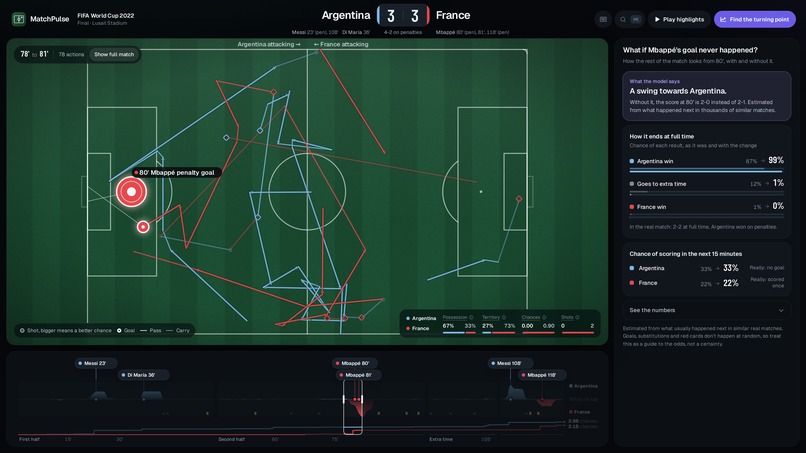
What if a goal happend
-
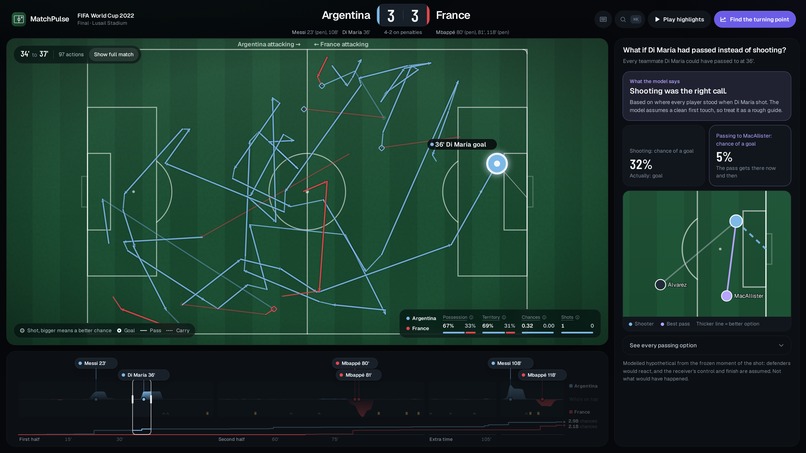
What if a pass happend
-
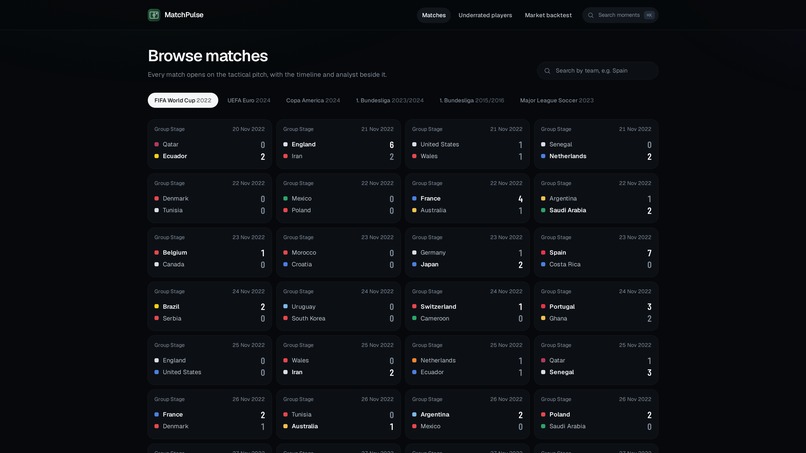
Match Browser
-
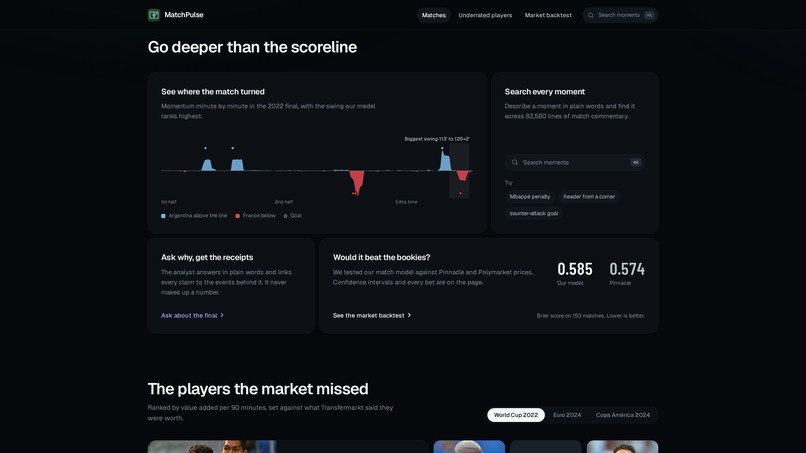
Features
-
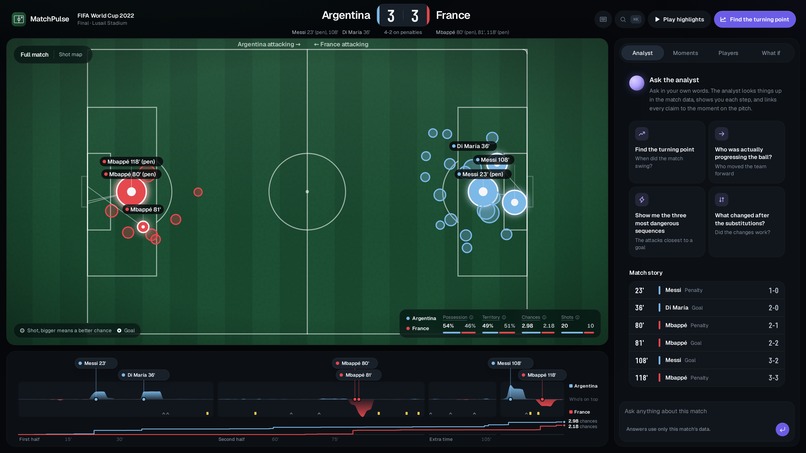
Match View
-
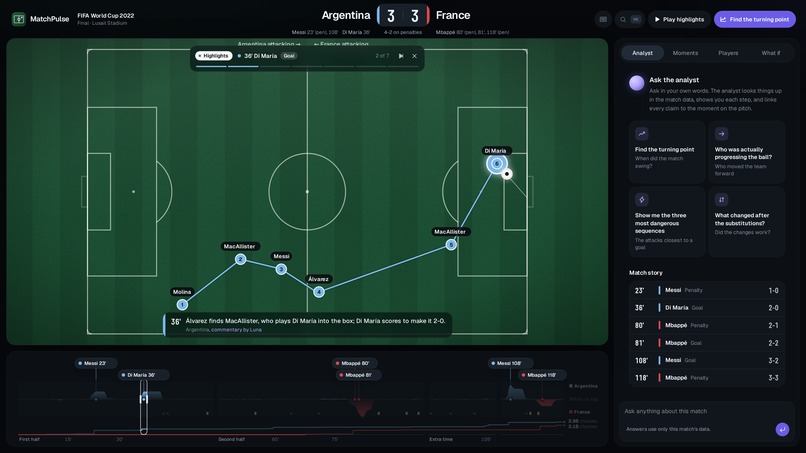
Highlights reel
-
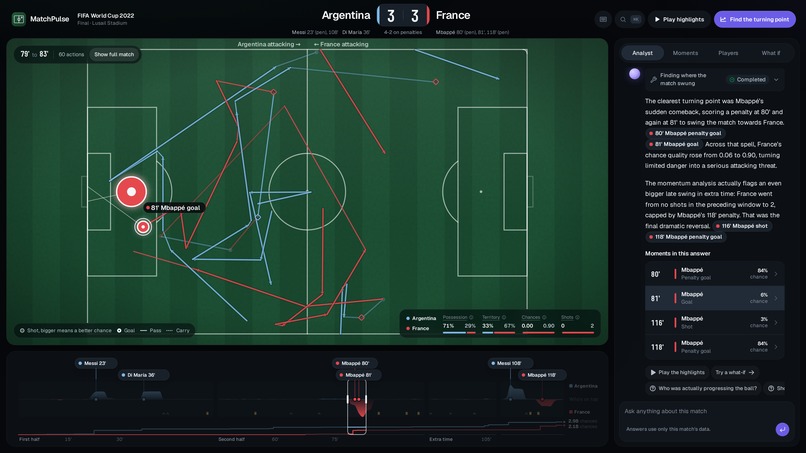
Turning Point
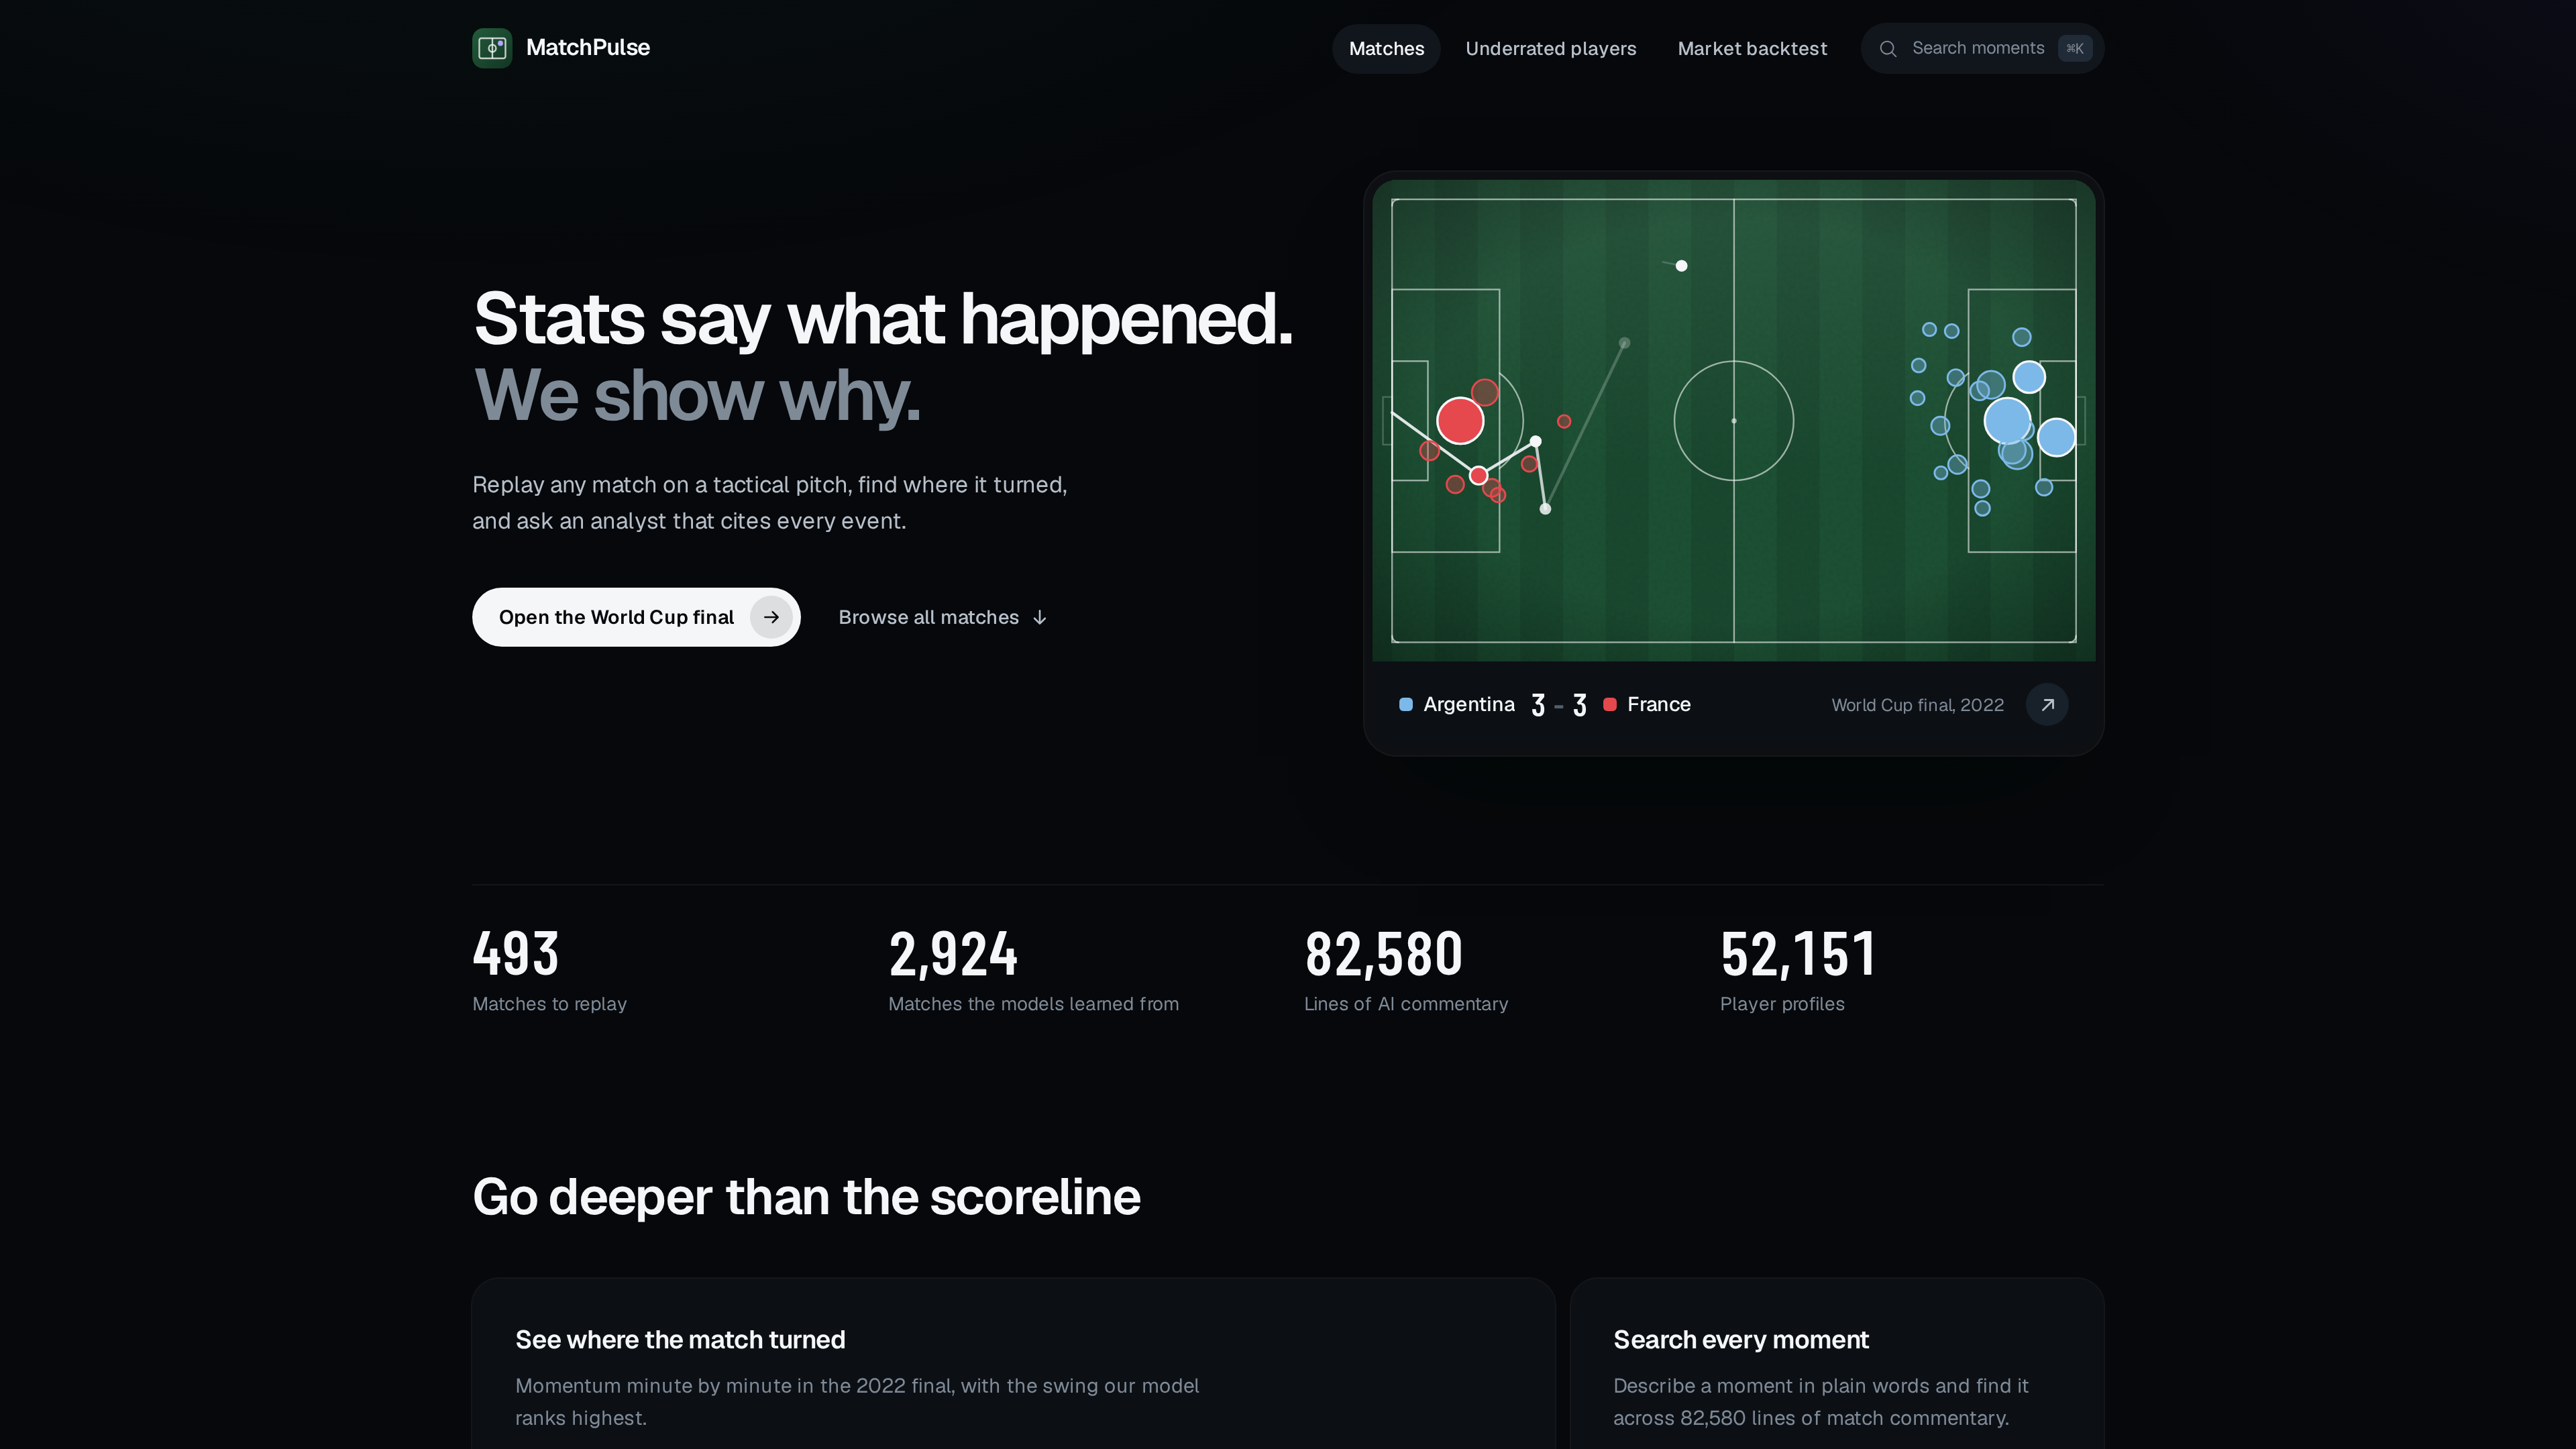
Inspiration
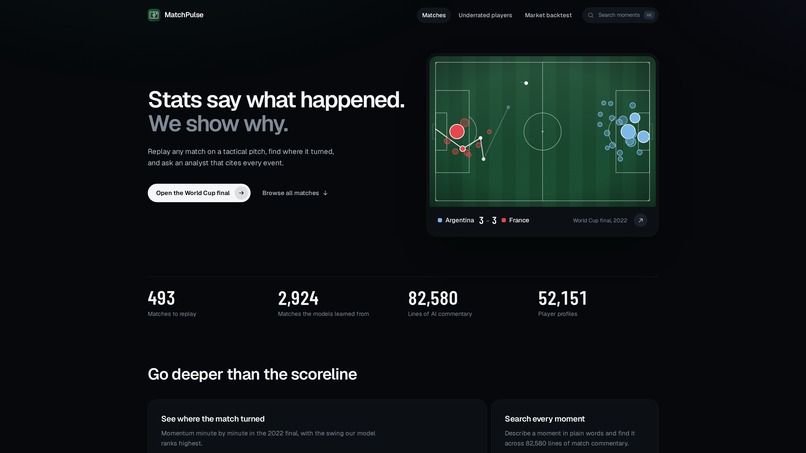
Most football stats apps tell you what happened: 62% possession, 1.8 xG. They rarely tell you why a match turned, and when they try, you have to take their word for it. We wanted something like a sharp analyst sitting next to you. You ask why a team took over the second half, and it answers in plain English, with every claim linked to the exact moment on the pitch that proves it. We also wanted it to be honest about what it can't know, because football is mostly noise and most "AI predictions" hide that.
What it does
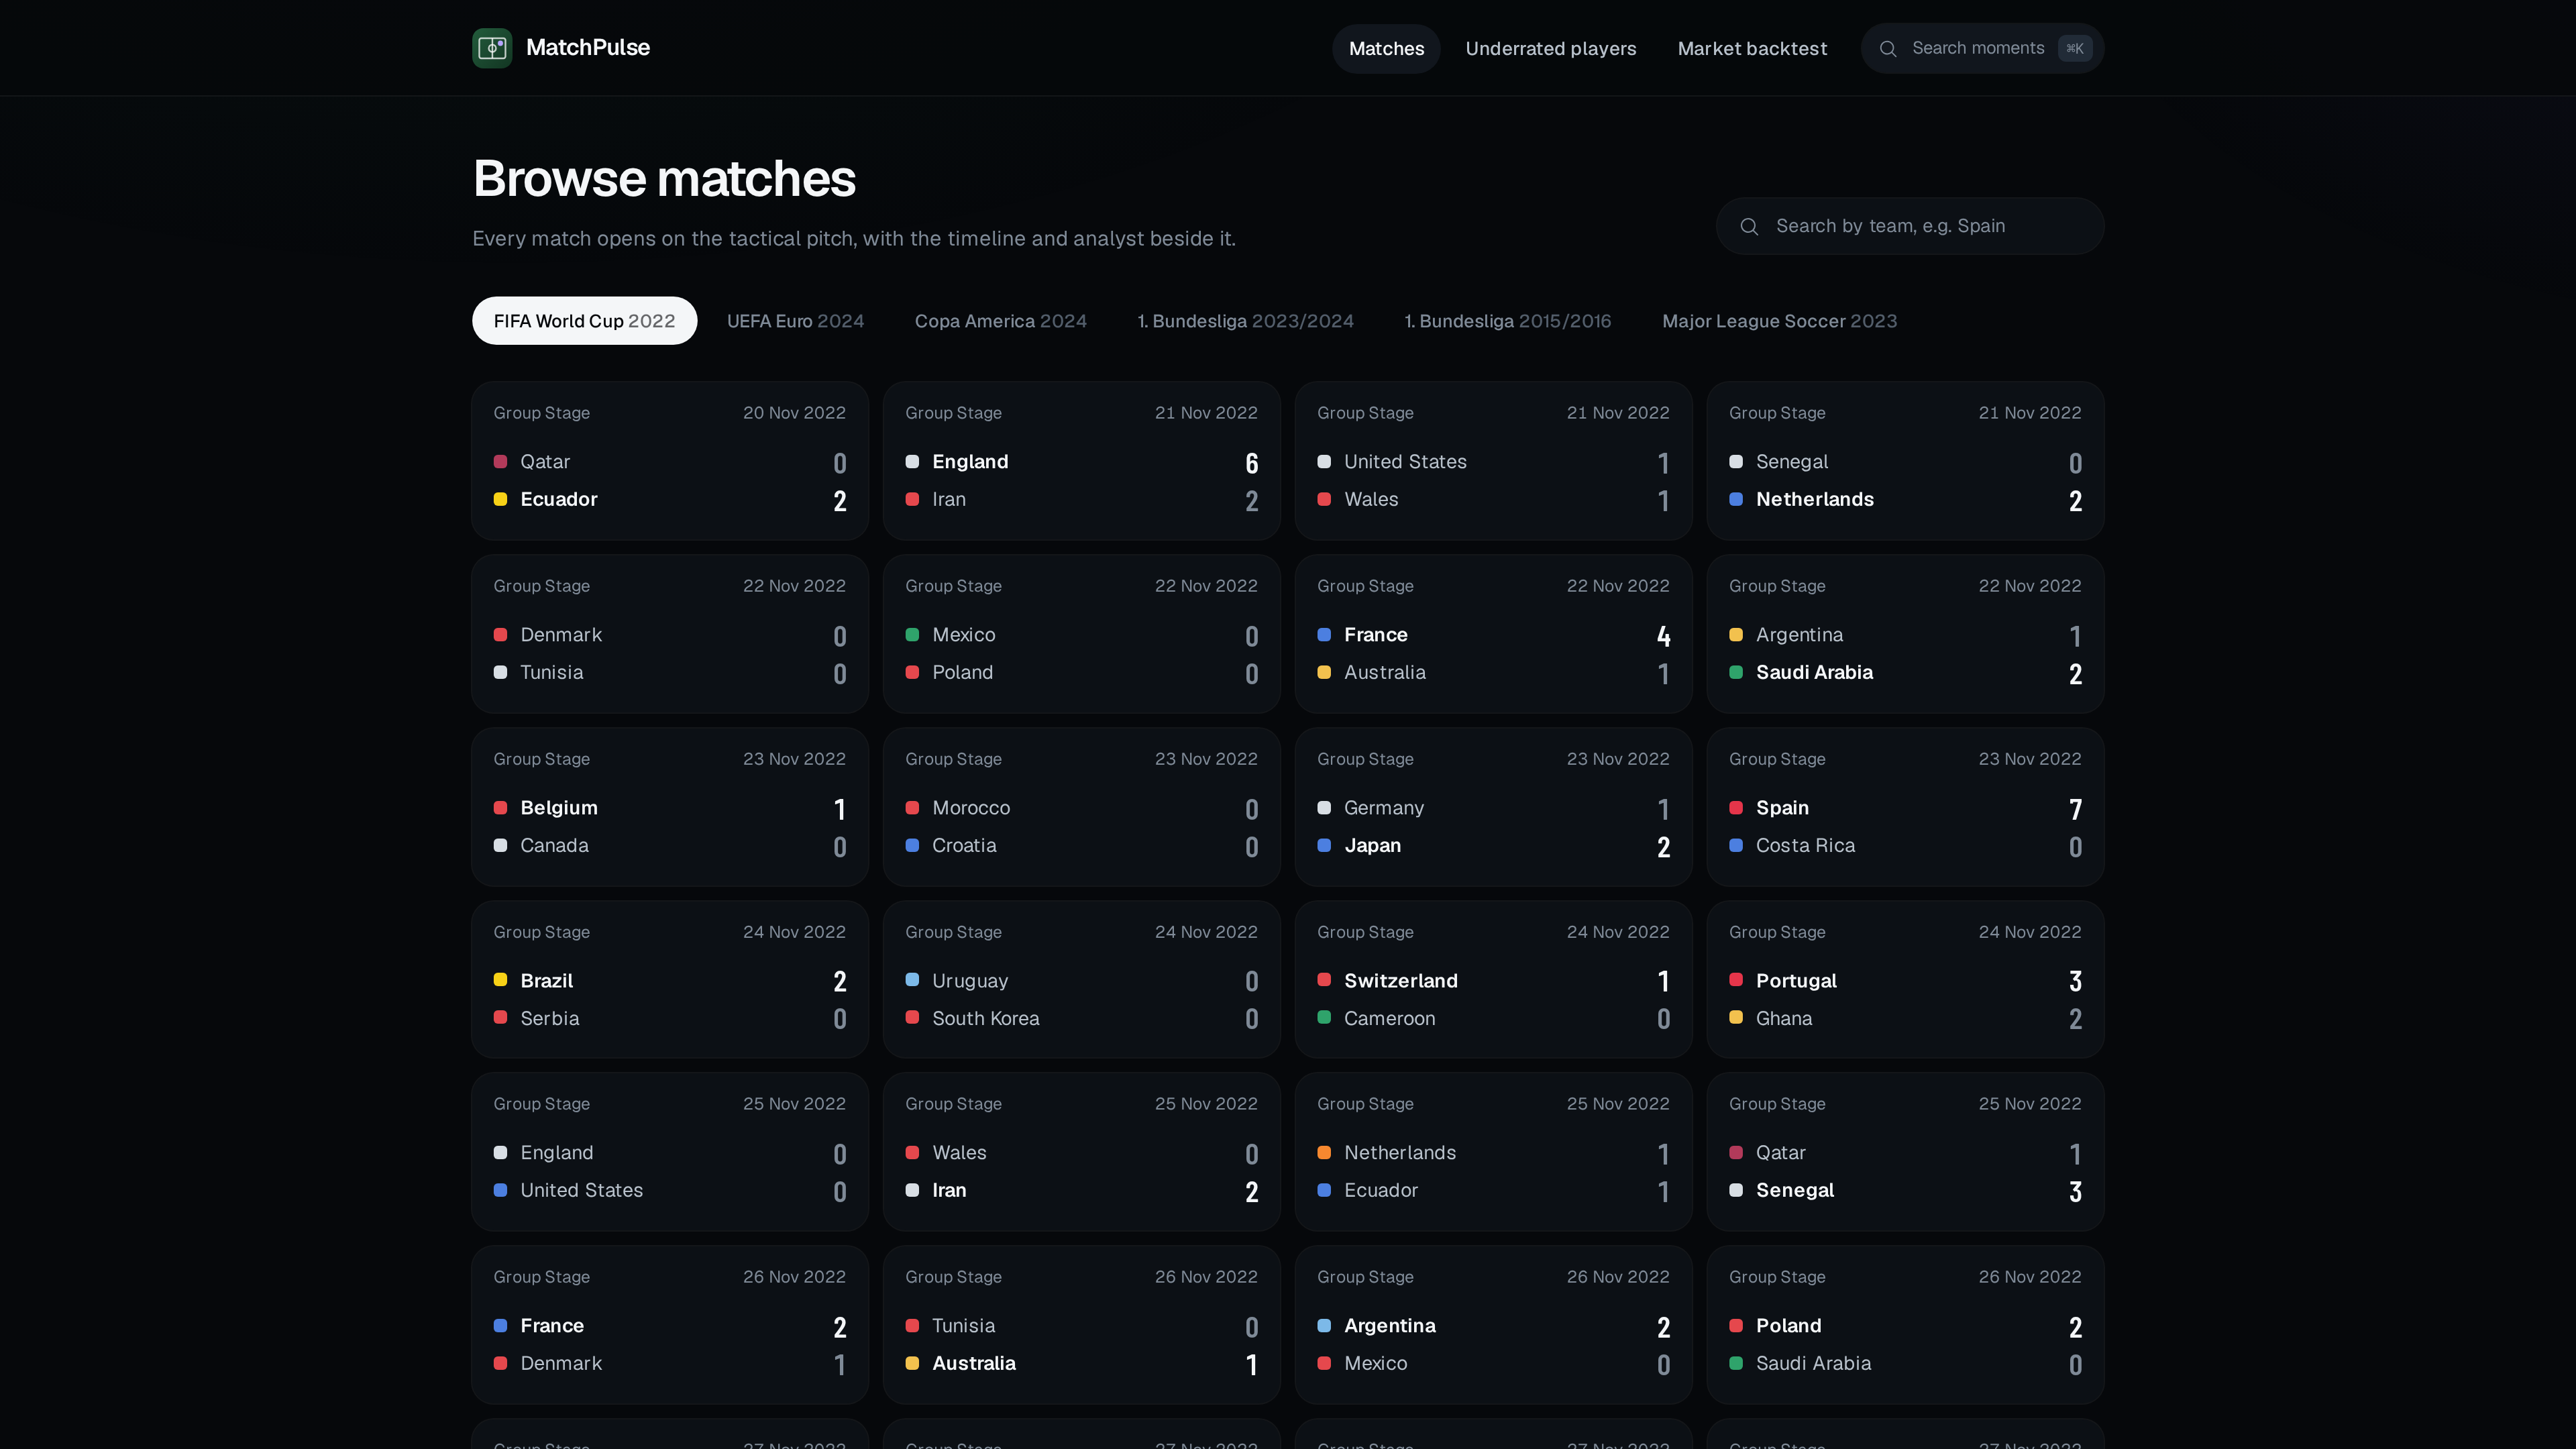
MatchPulse is an AI football analyst for 3000 matches: the 2022 World Cup, Euro 2024, Copa América 2024, all of Bundesliga 2015/16, Leverkusen's unbeaten 2023/24 and Inter Miami in MLS 2023.
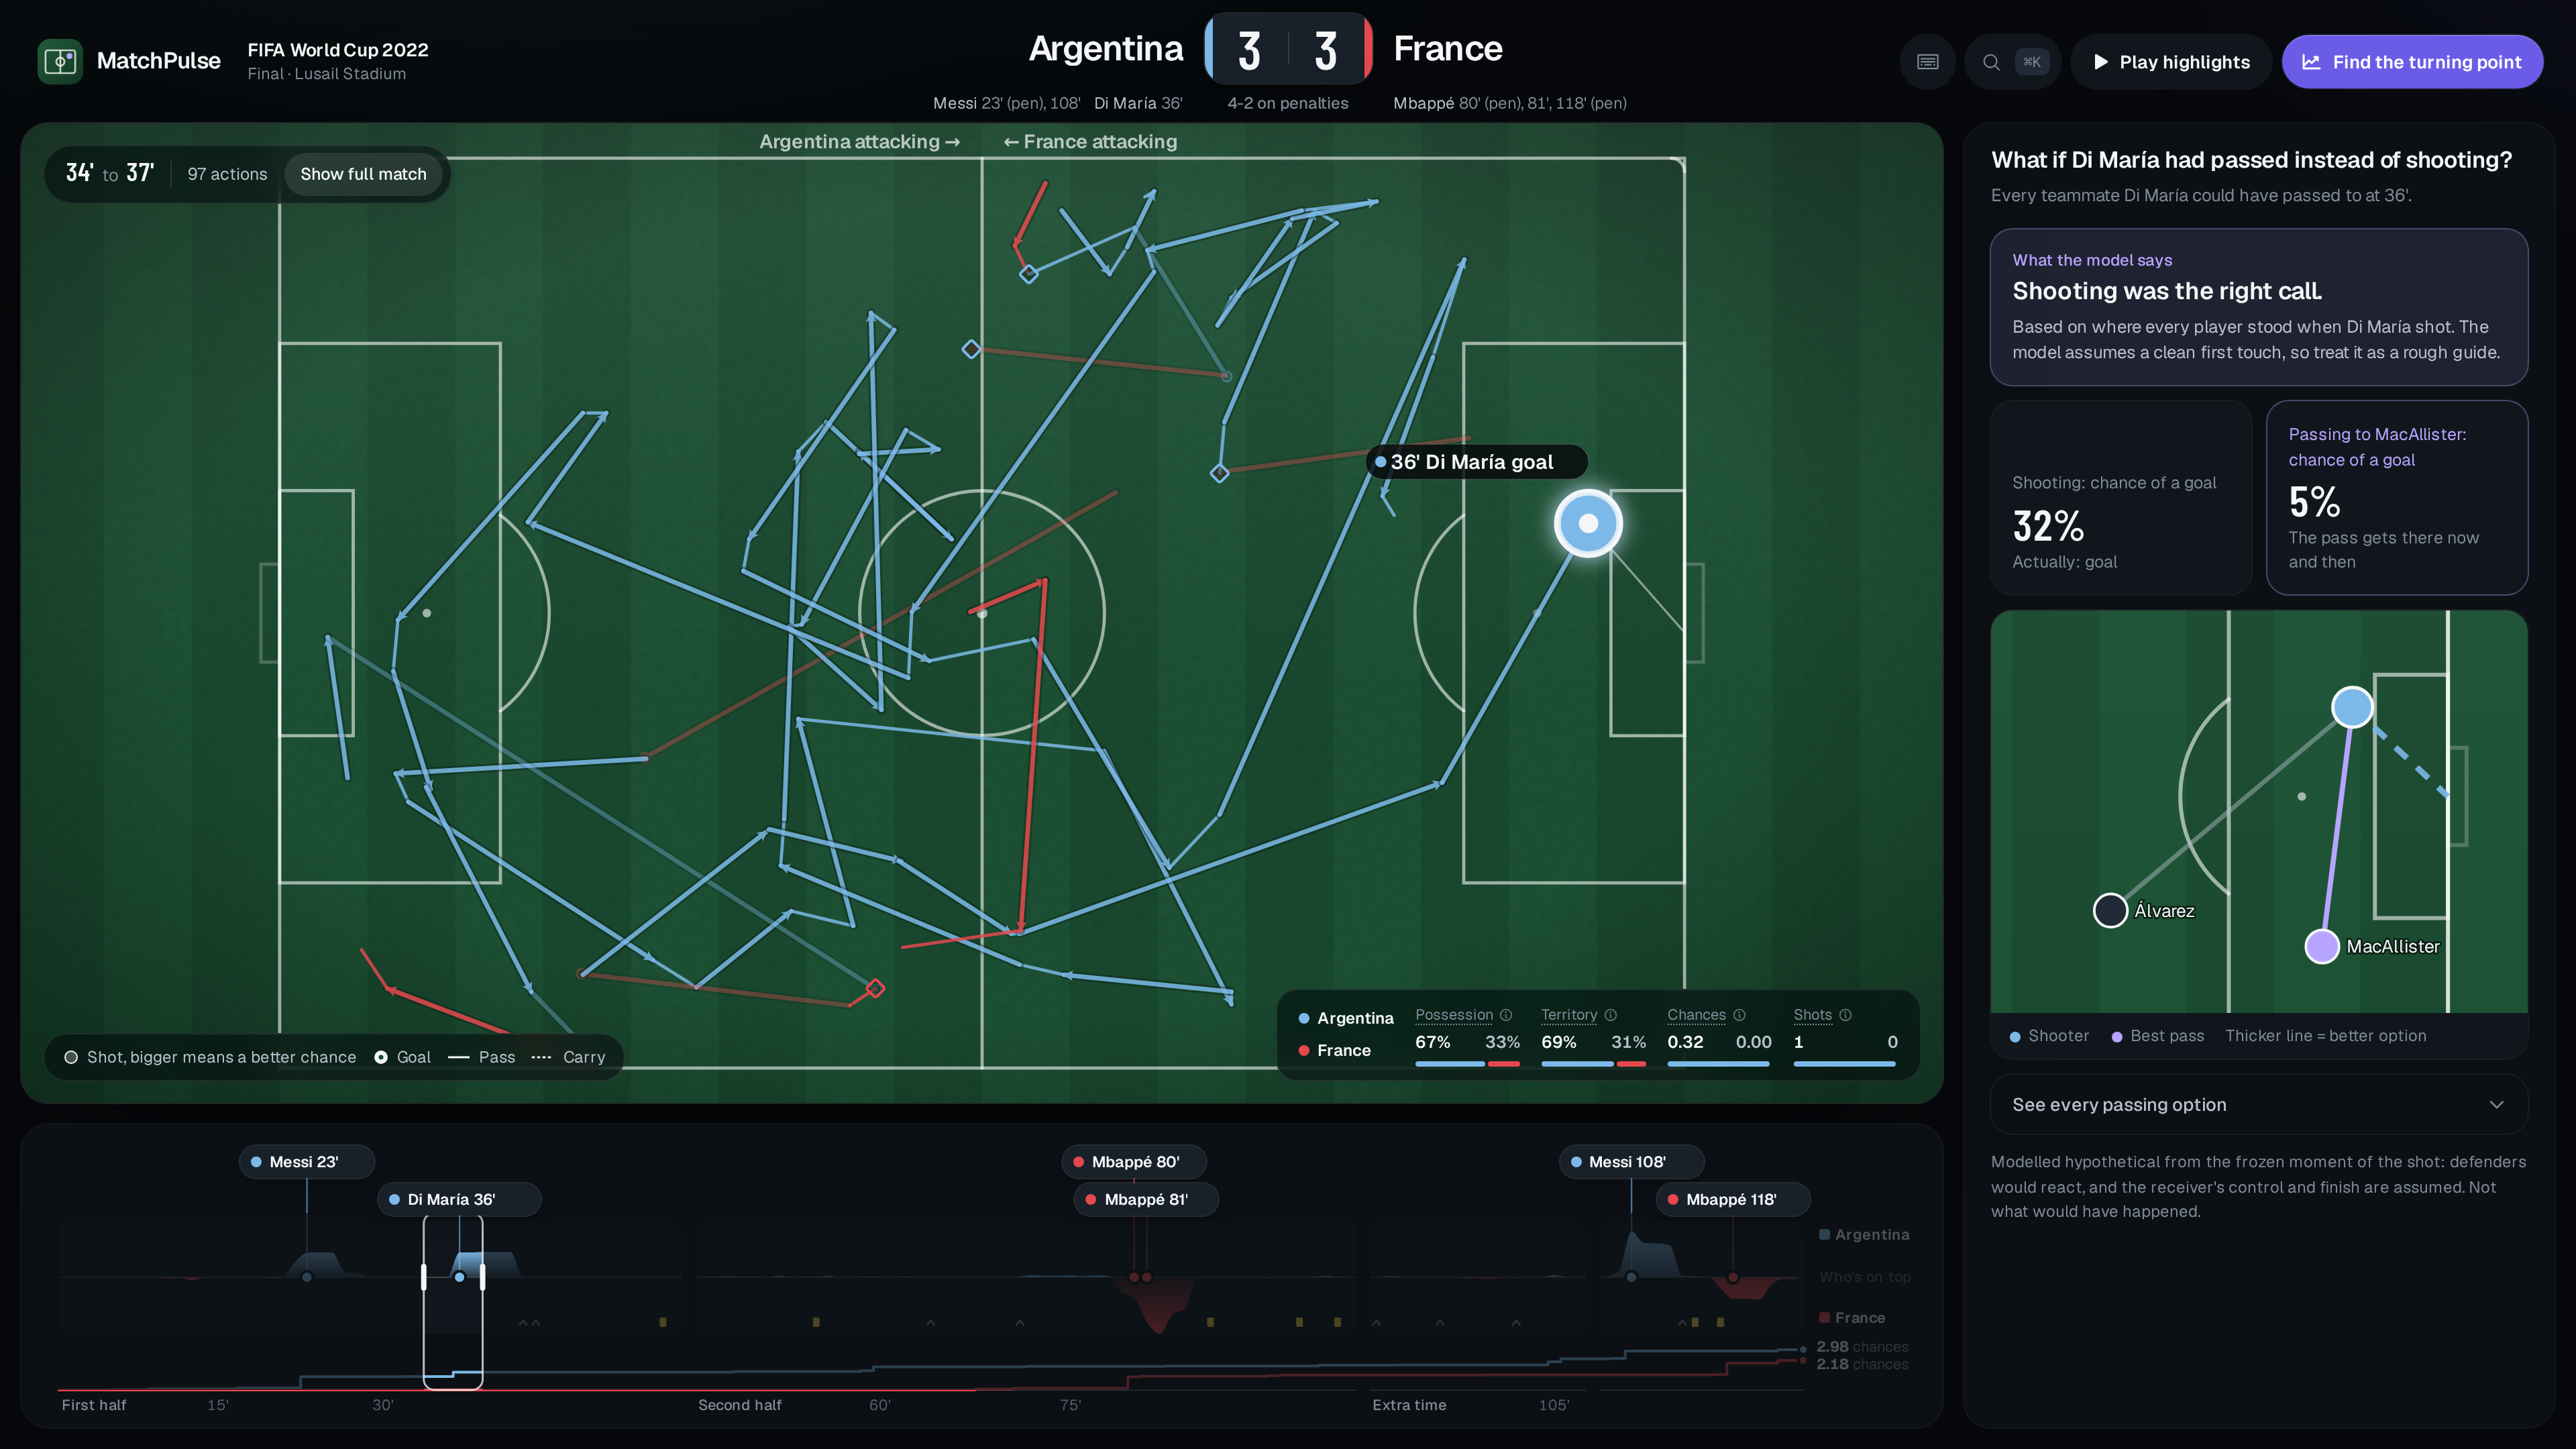
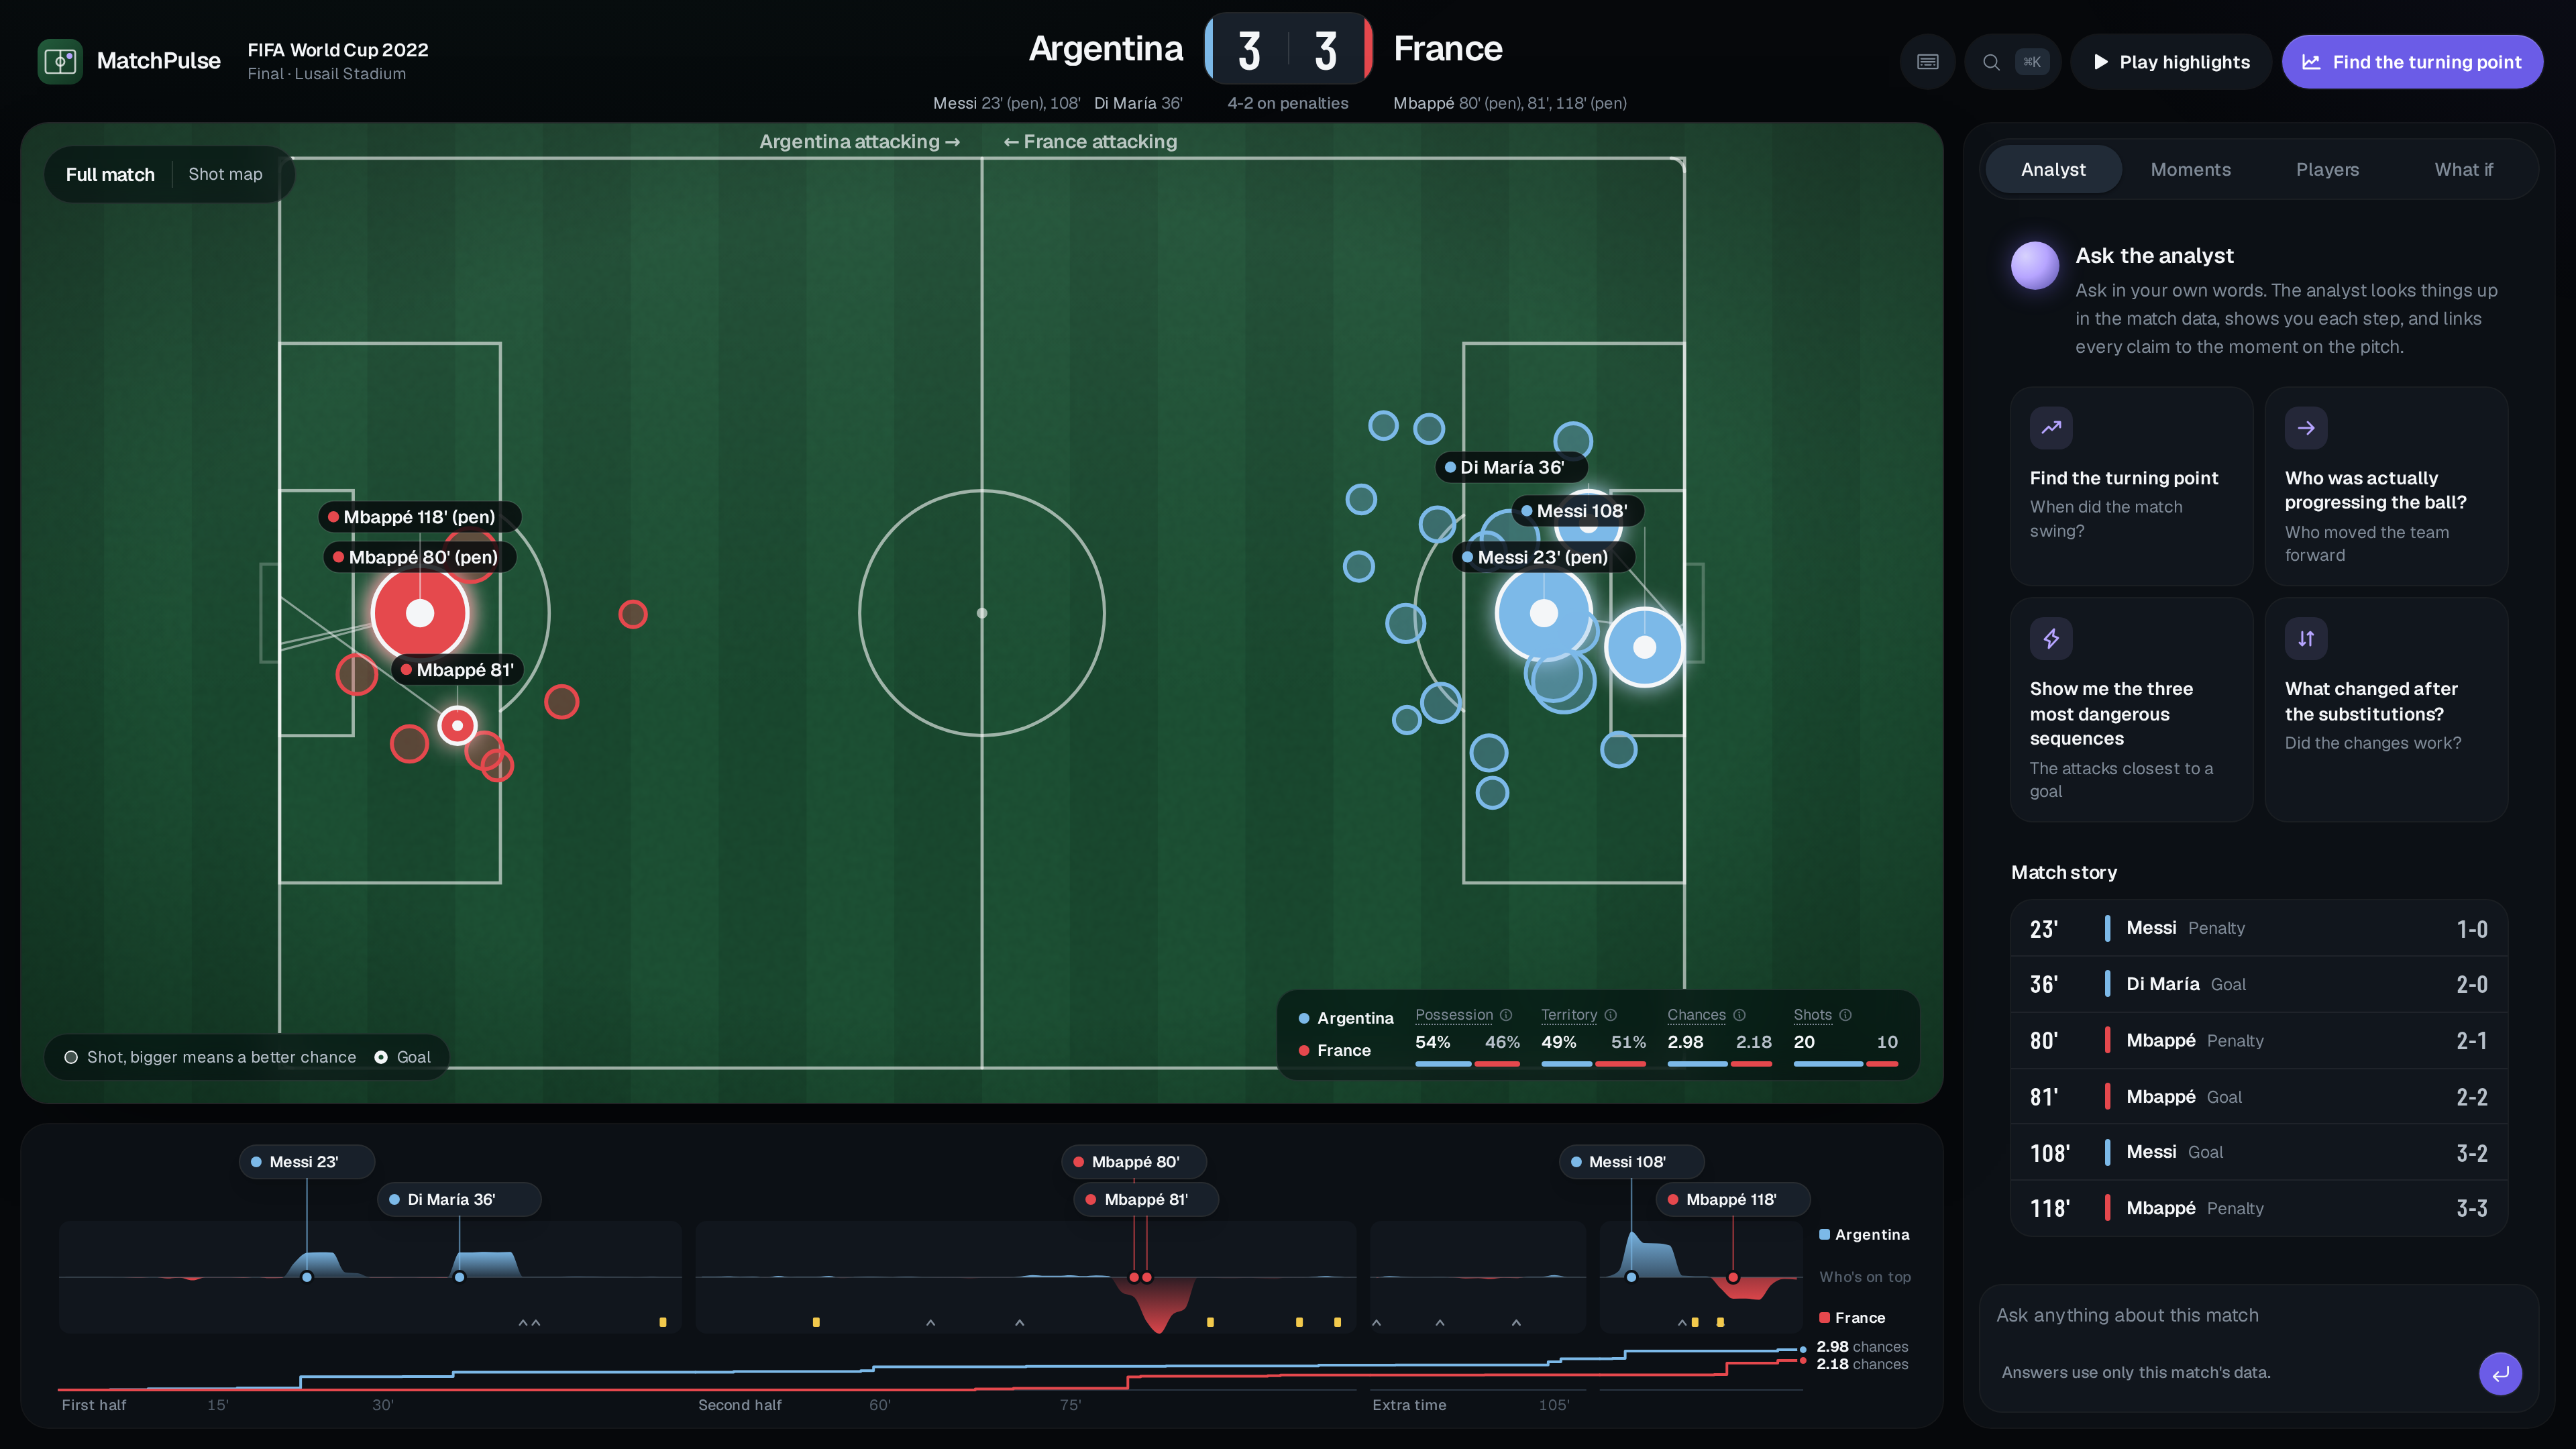
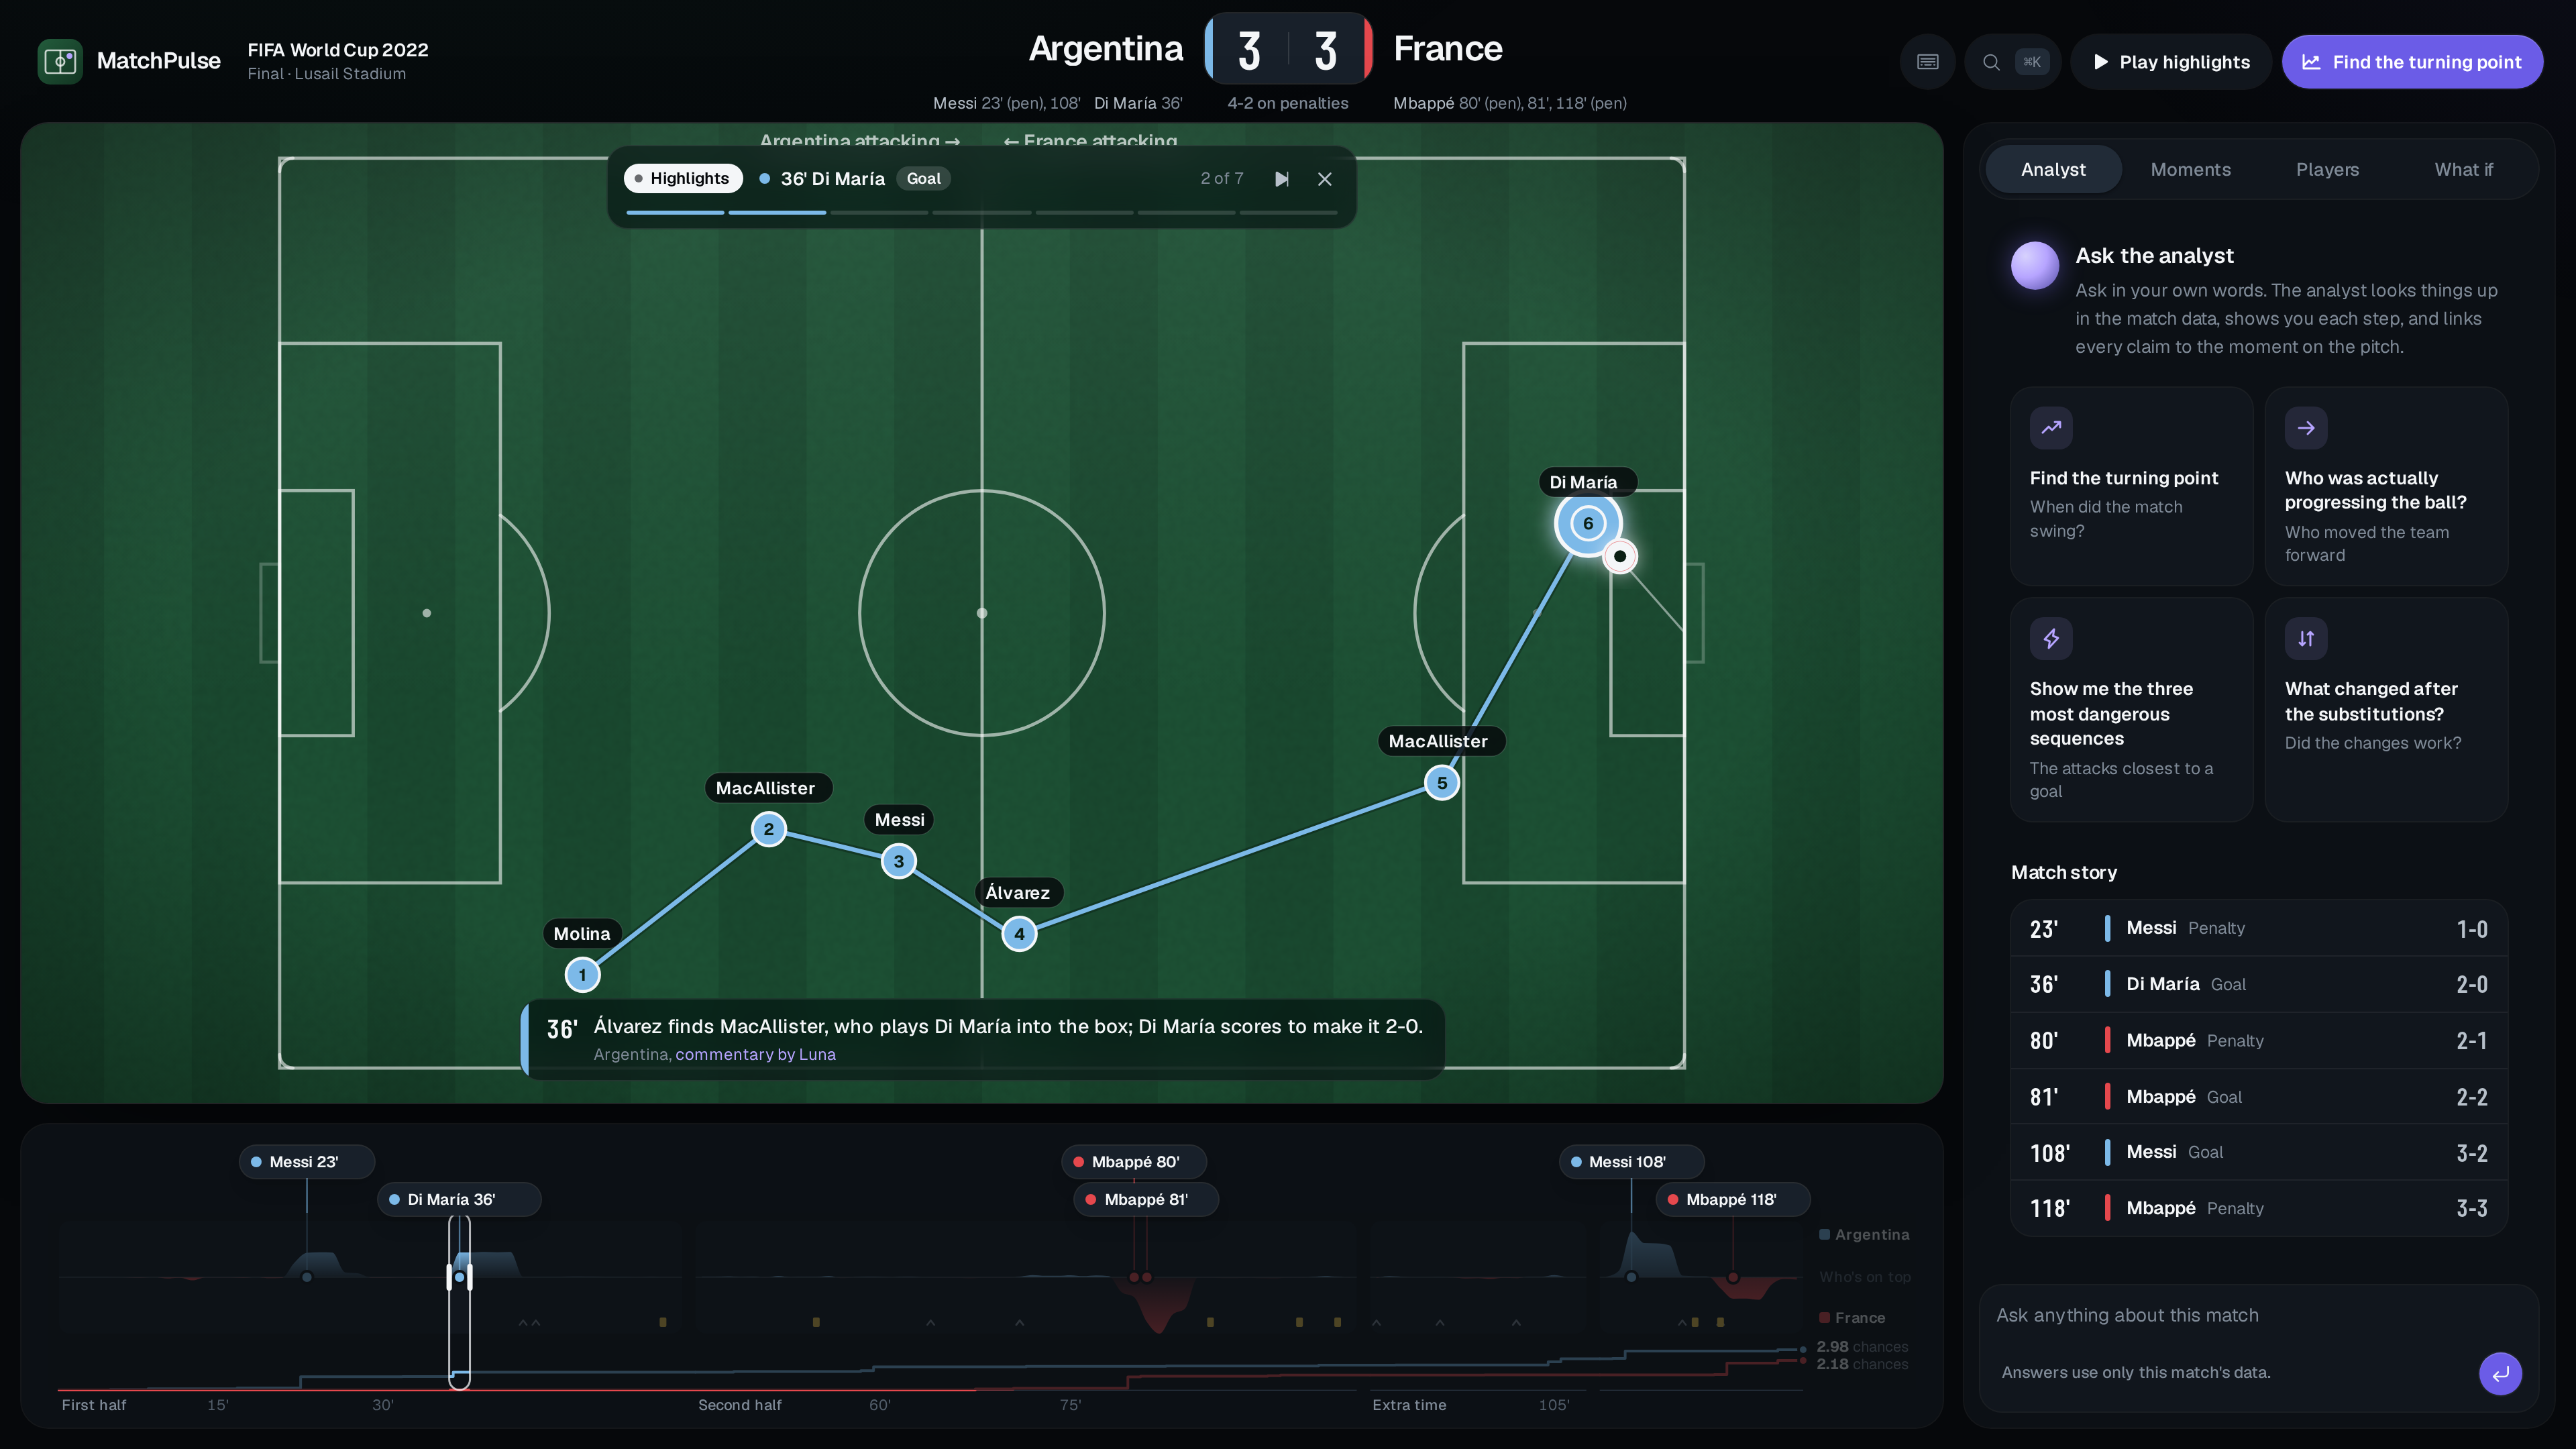
- Replay any match. Every pass, carry and shot plays on a broadcast-style pitch. Under it is a timeline of momentum, cumulative xG, goals, cards and subs. Drag a window on the timeline and the pitch and stats follow.
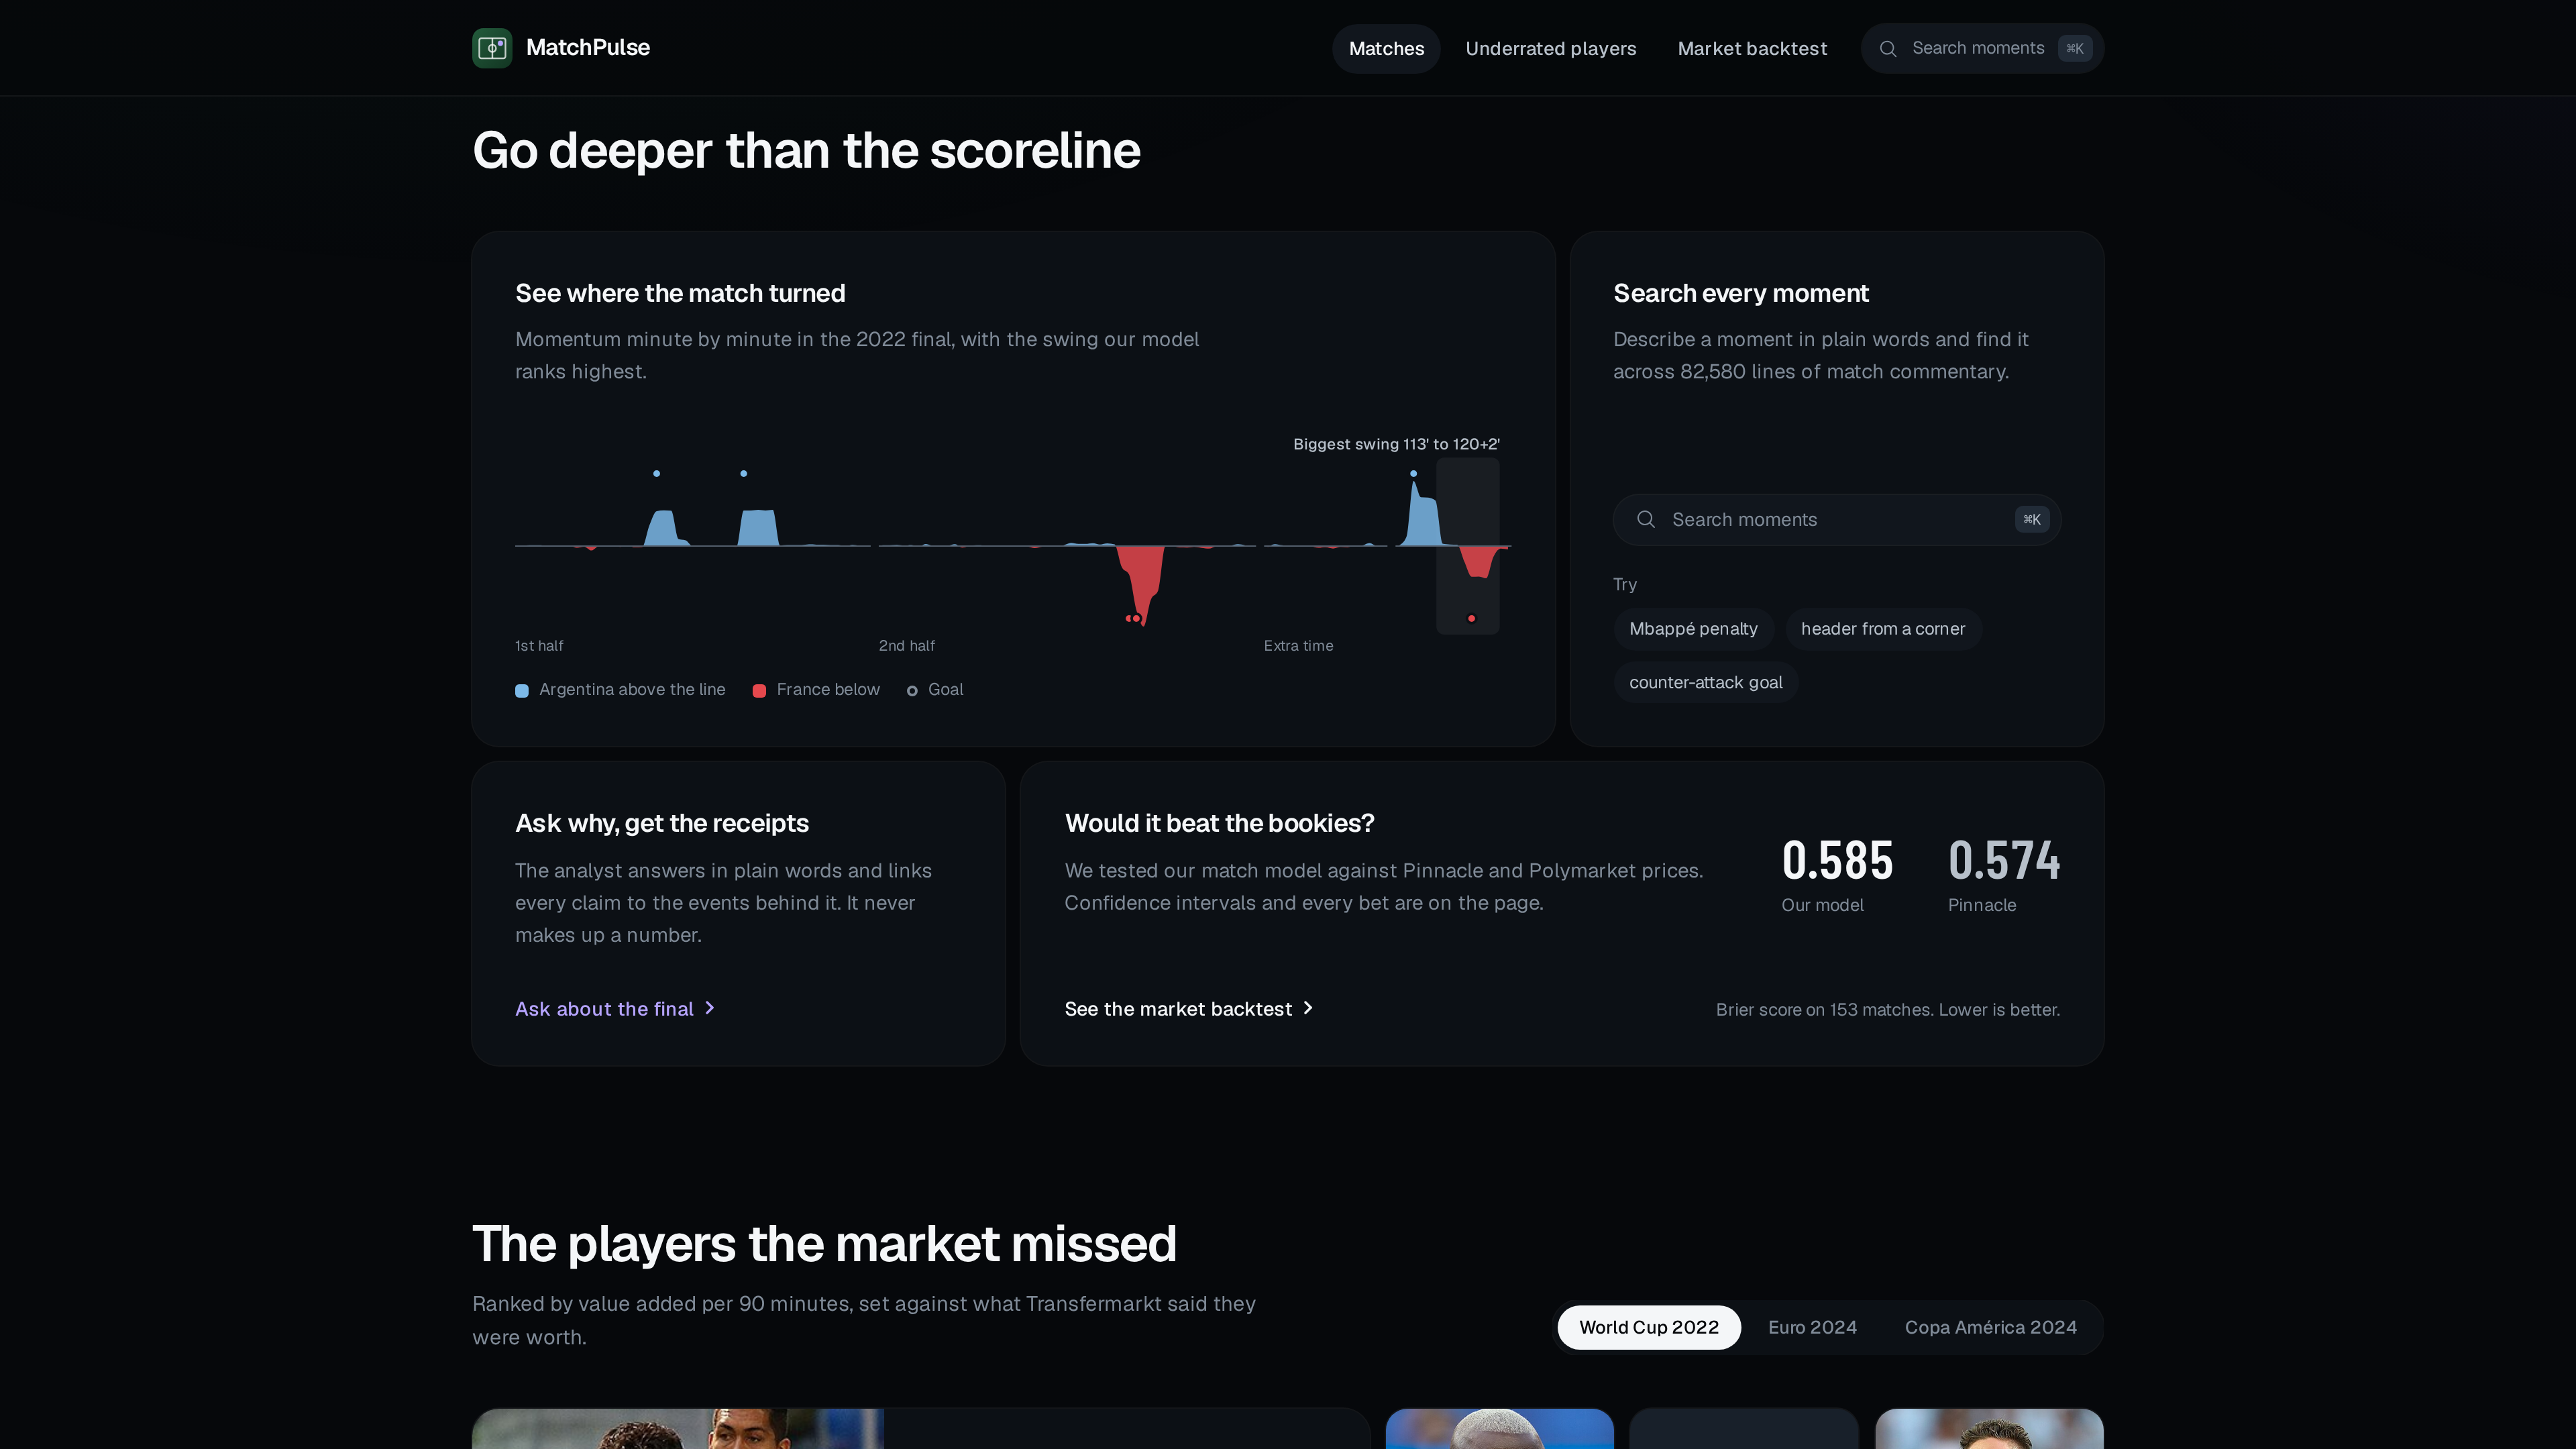
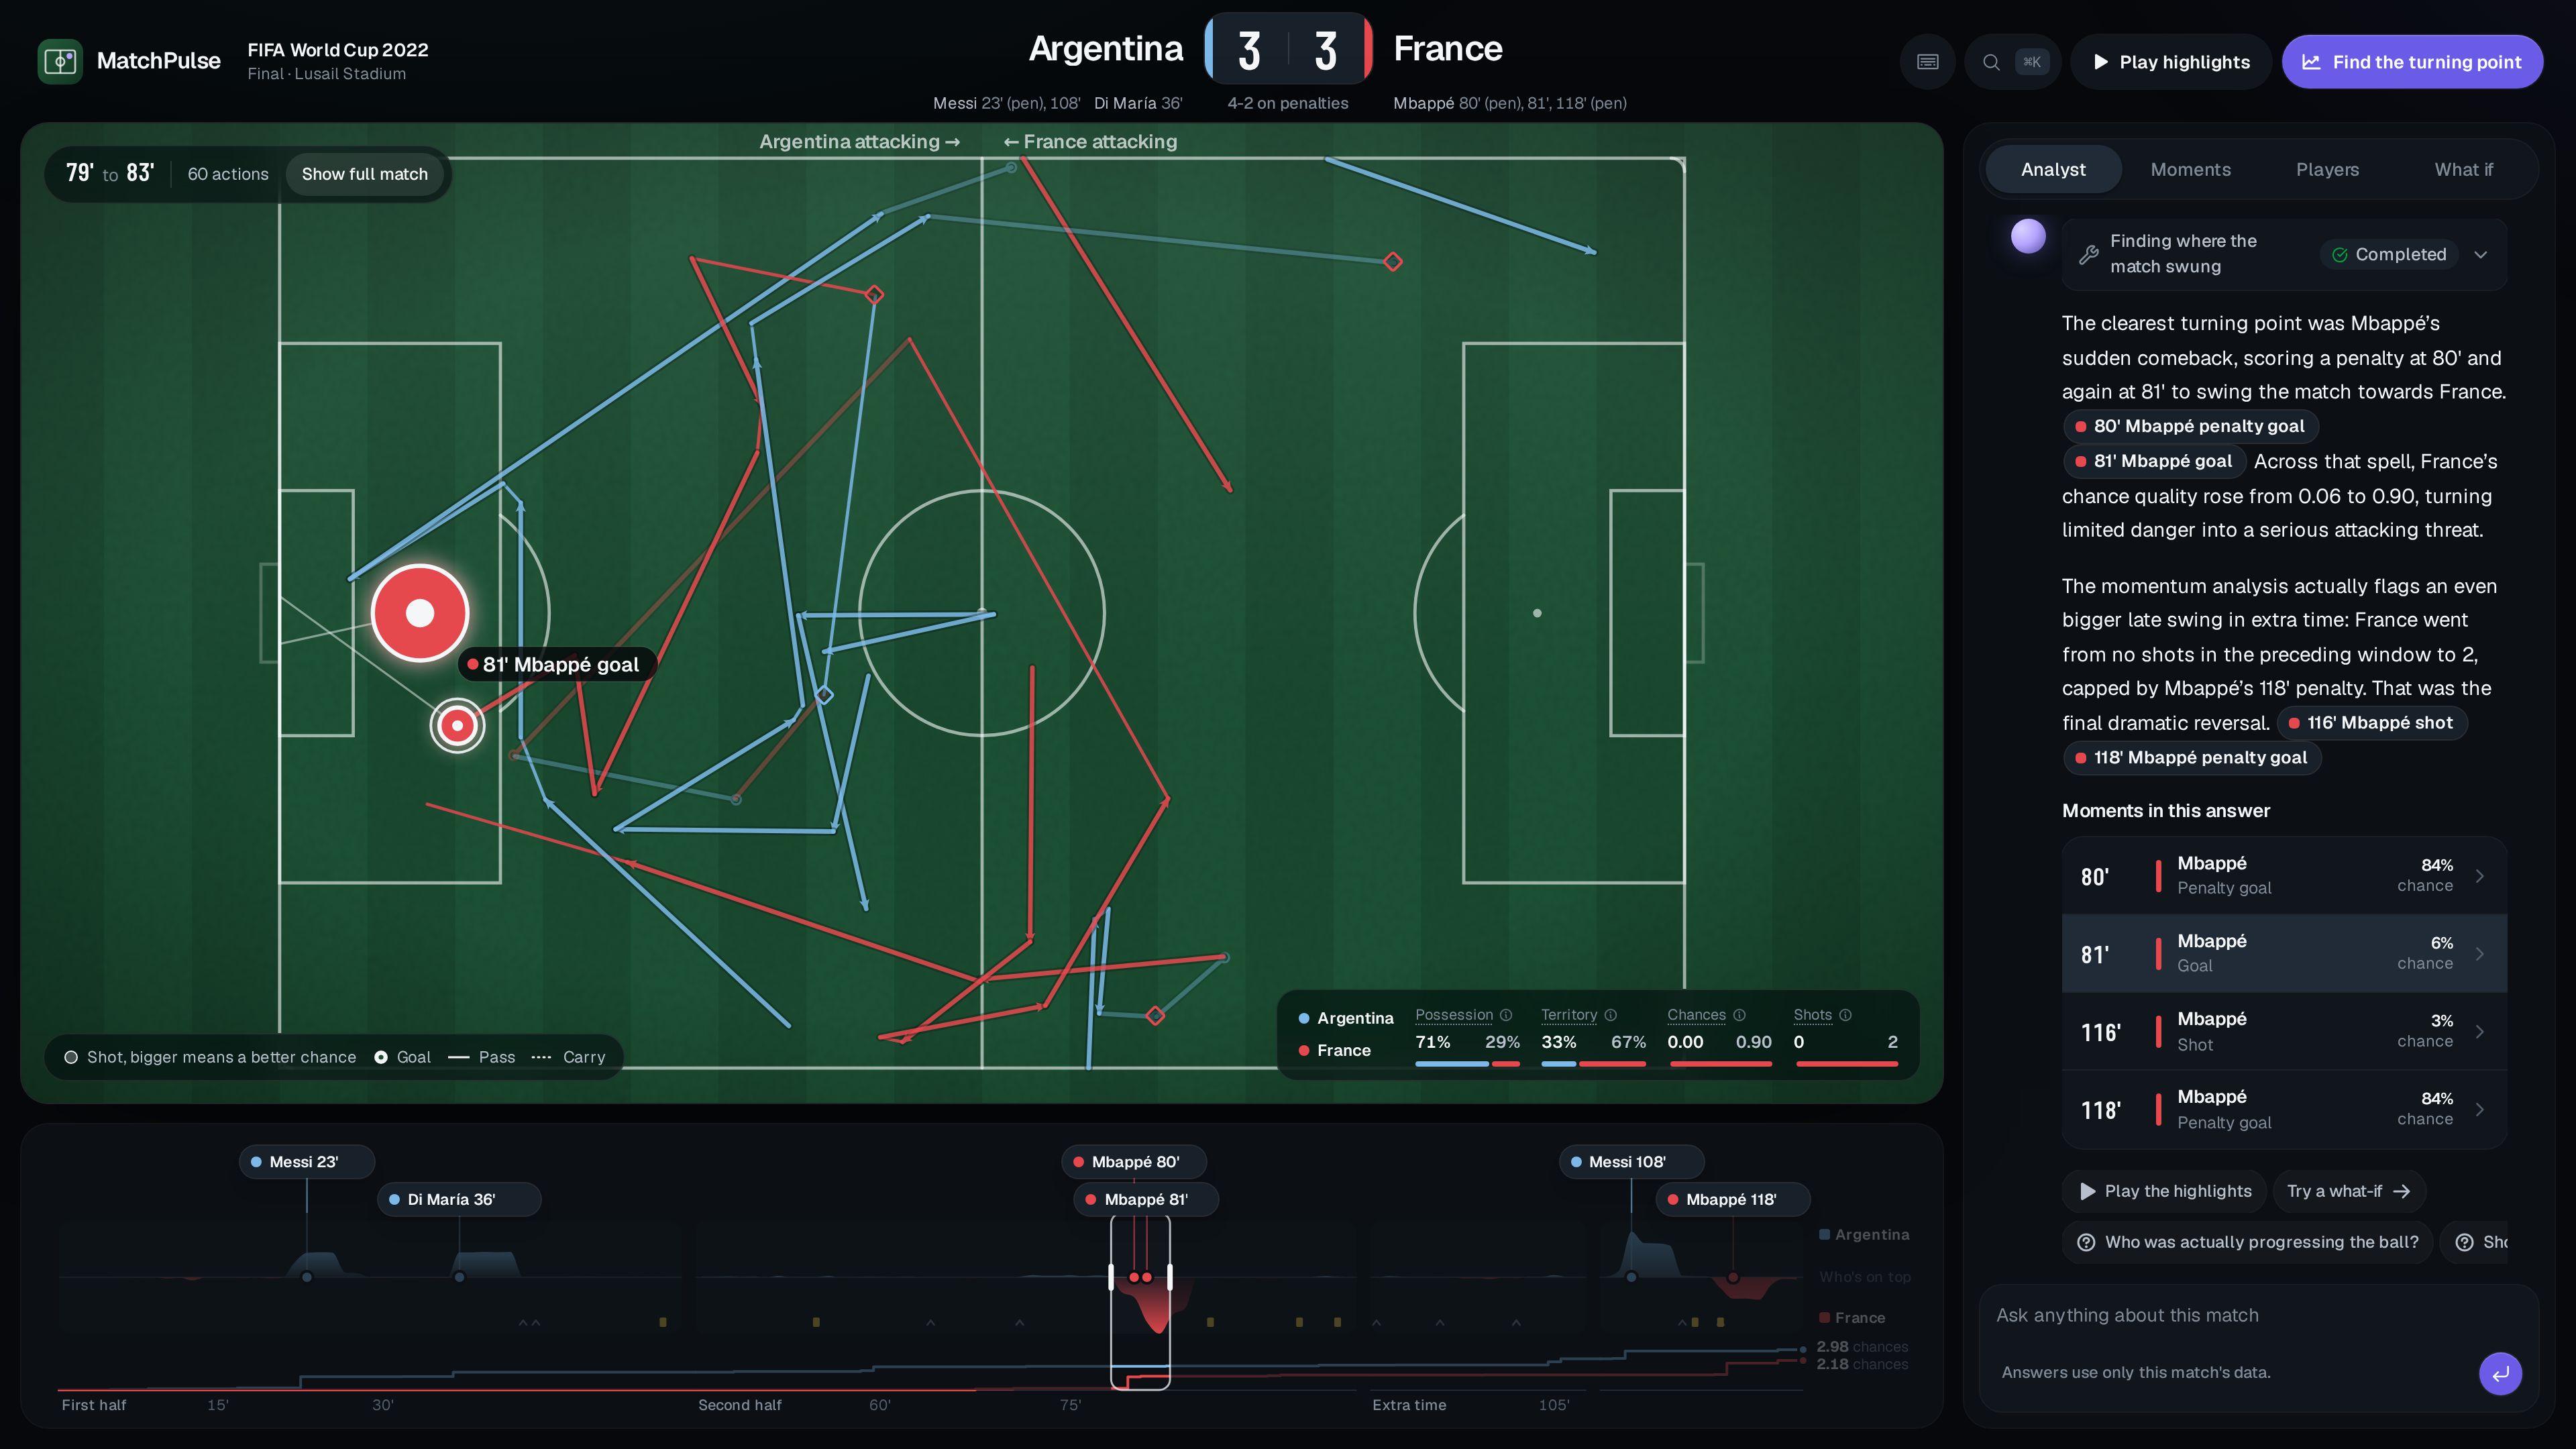
- Find the turning point. Change-point detection on the momentum series finds the three biggest swings in control.
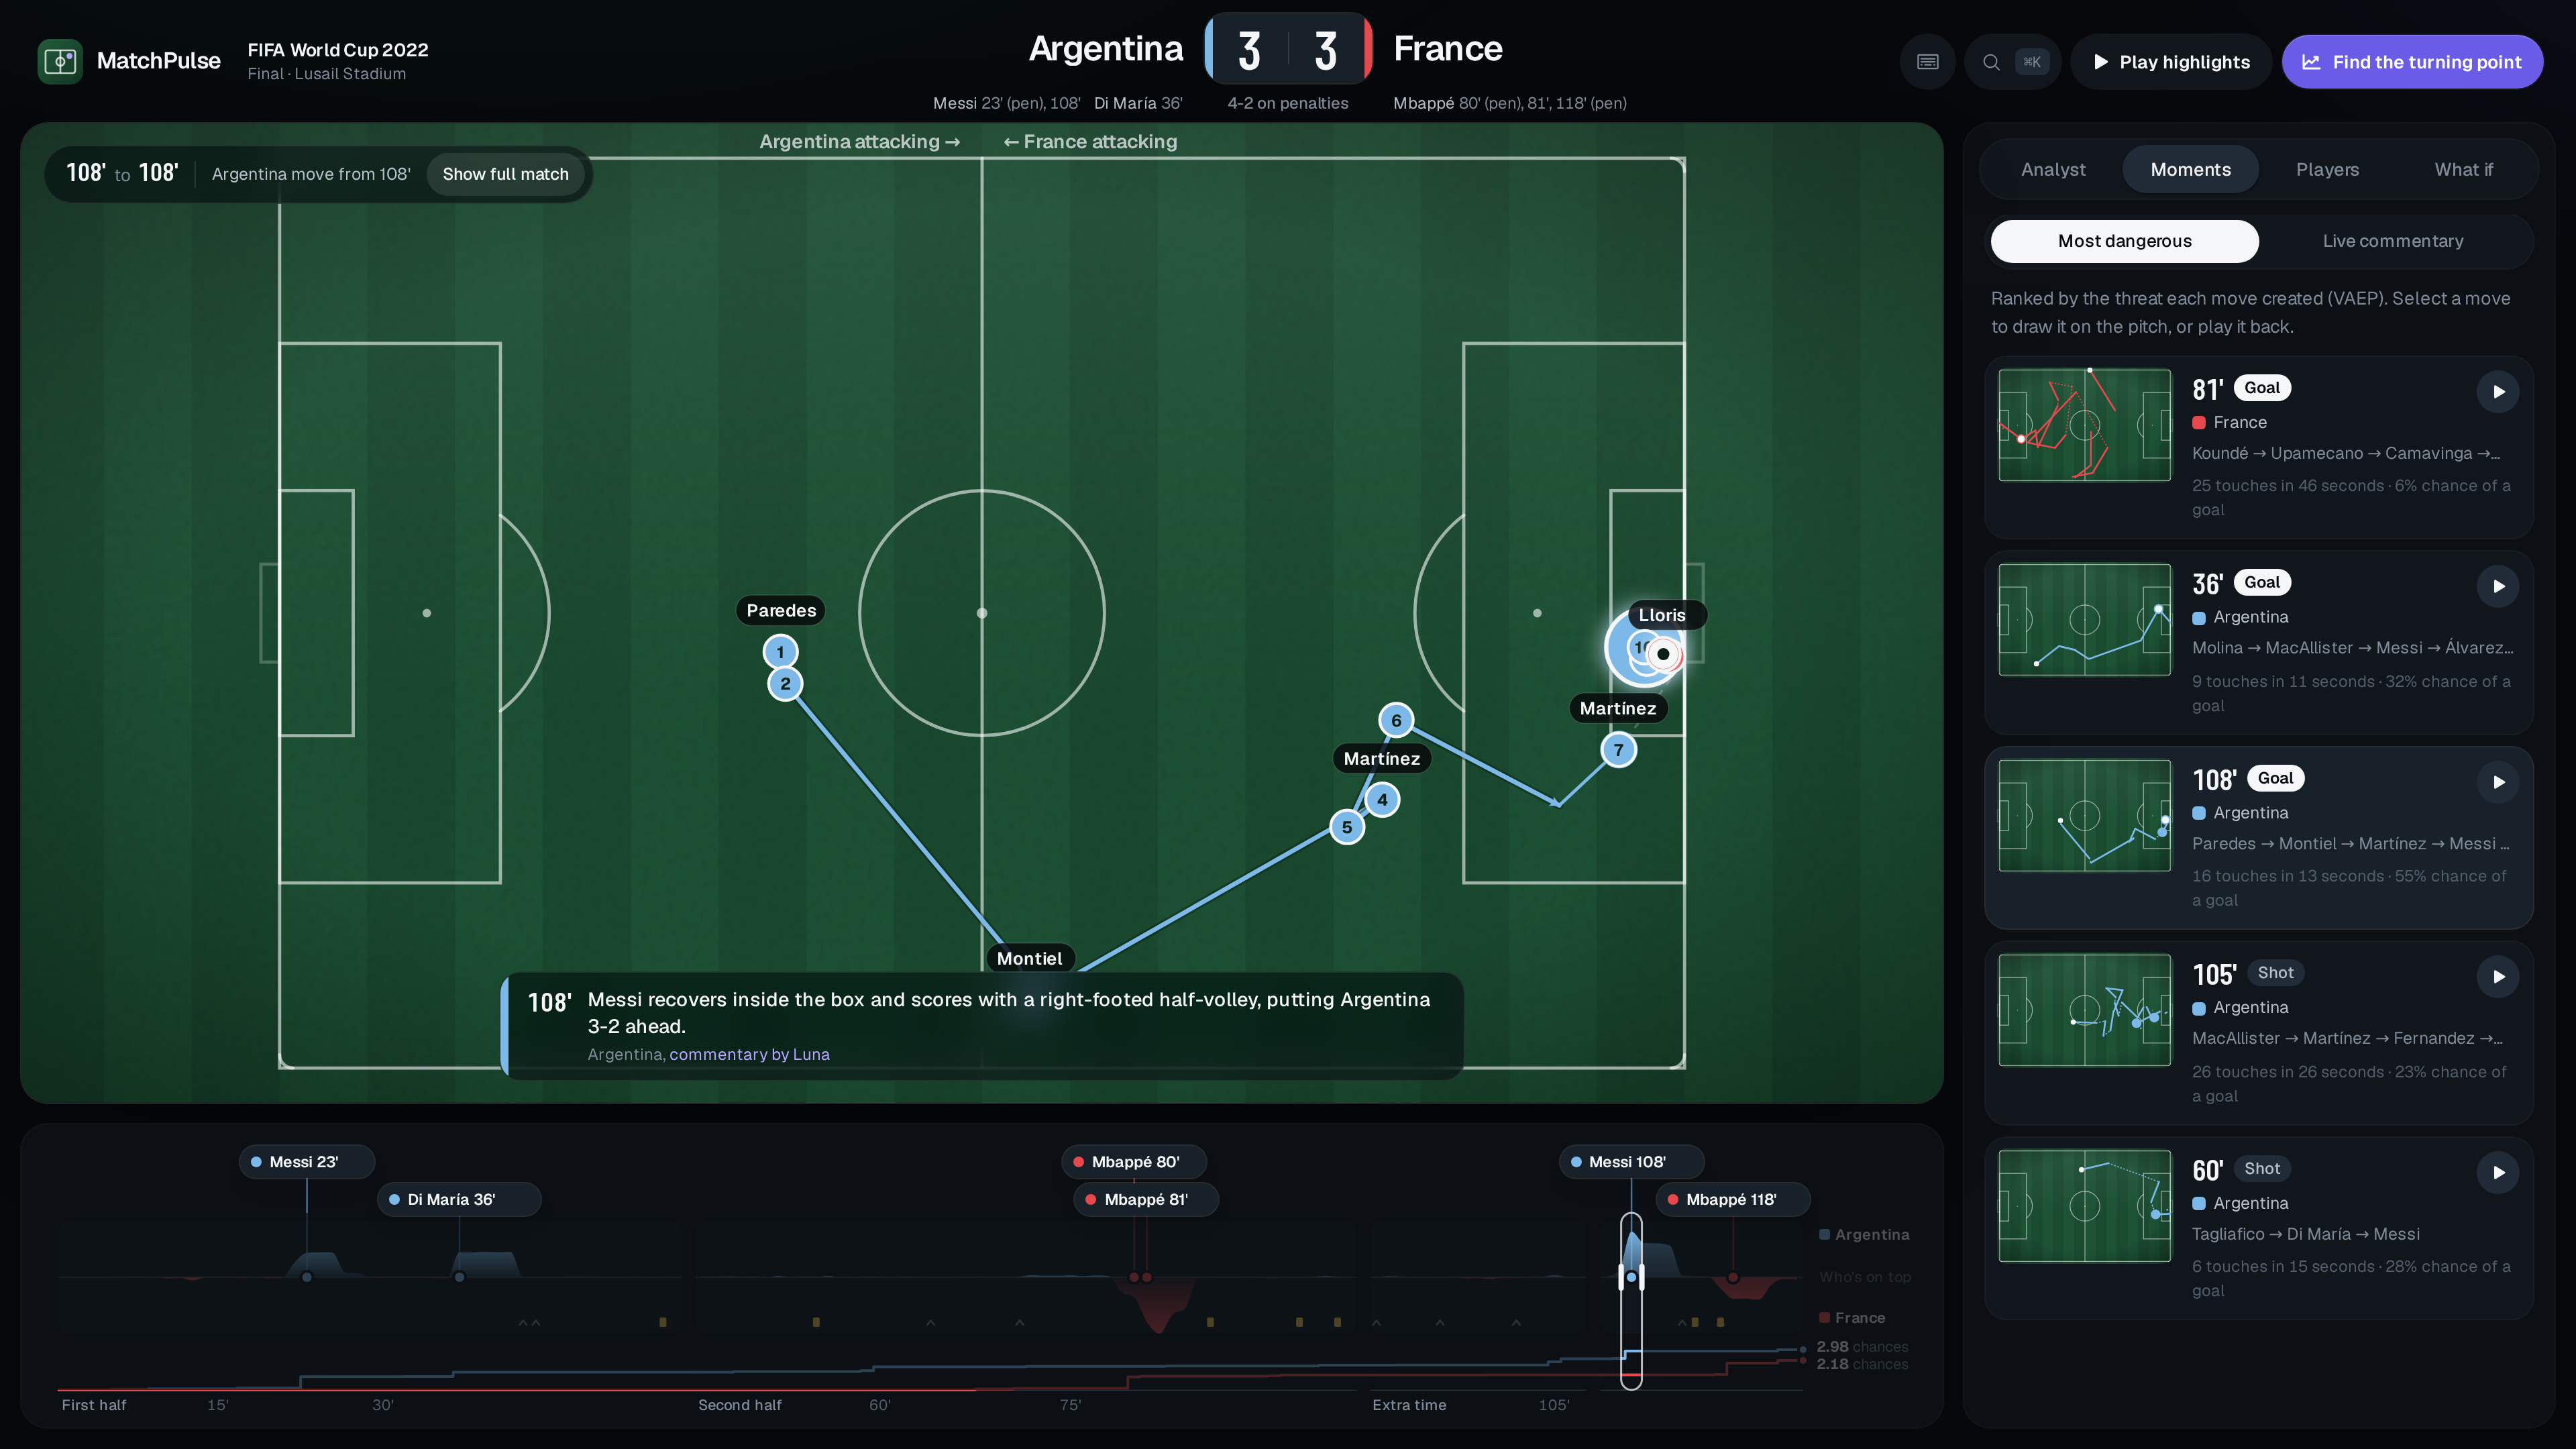
- Ask the analyst. Ask questions in plain English. The analyst answers by calling our analytics as tools. Every citation is a chip that jumps the pitch to that moment, and every number comes from a tool result, never from the language model.
- Read the commentary. 82,580 broadcast-style lines, one for every move in every match, written only from facts in the event data. They also show as captions while a move replays.
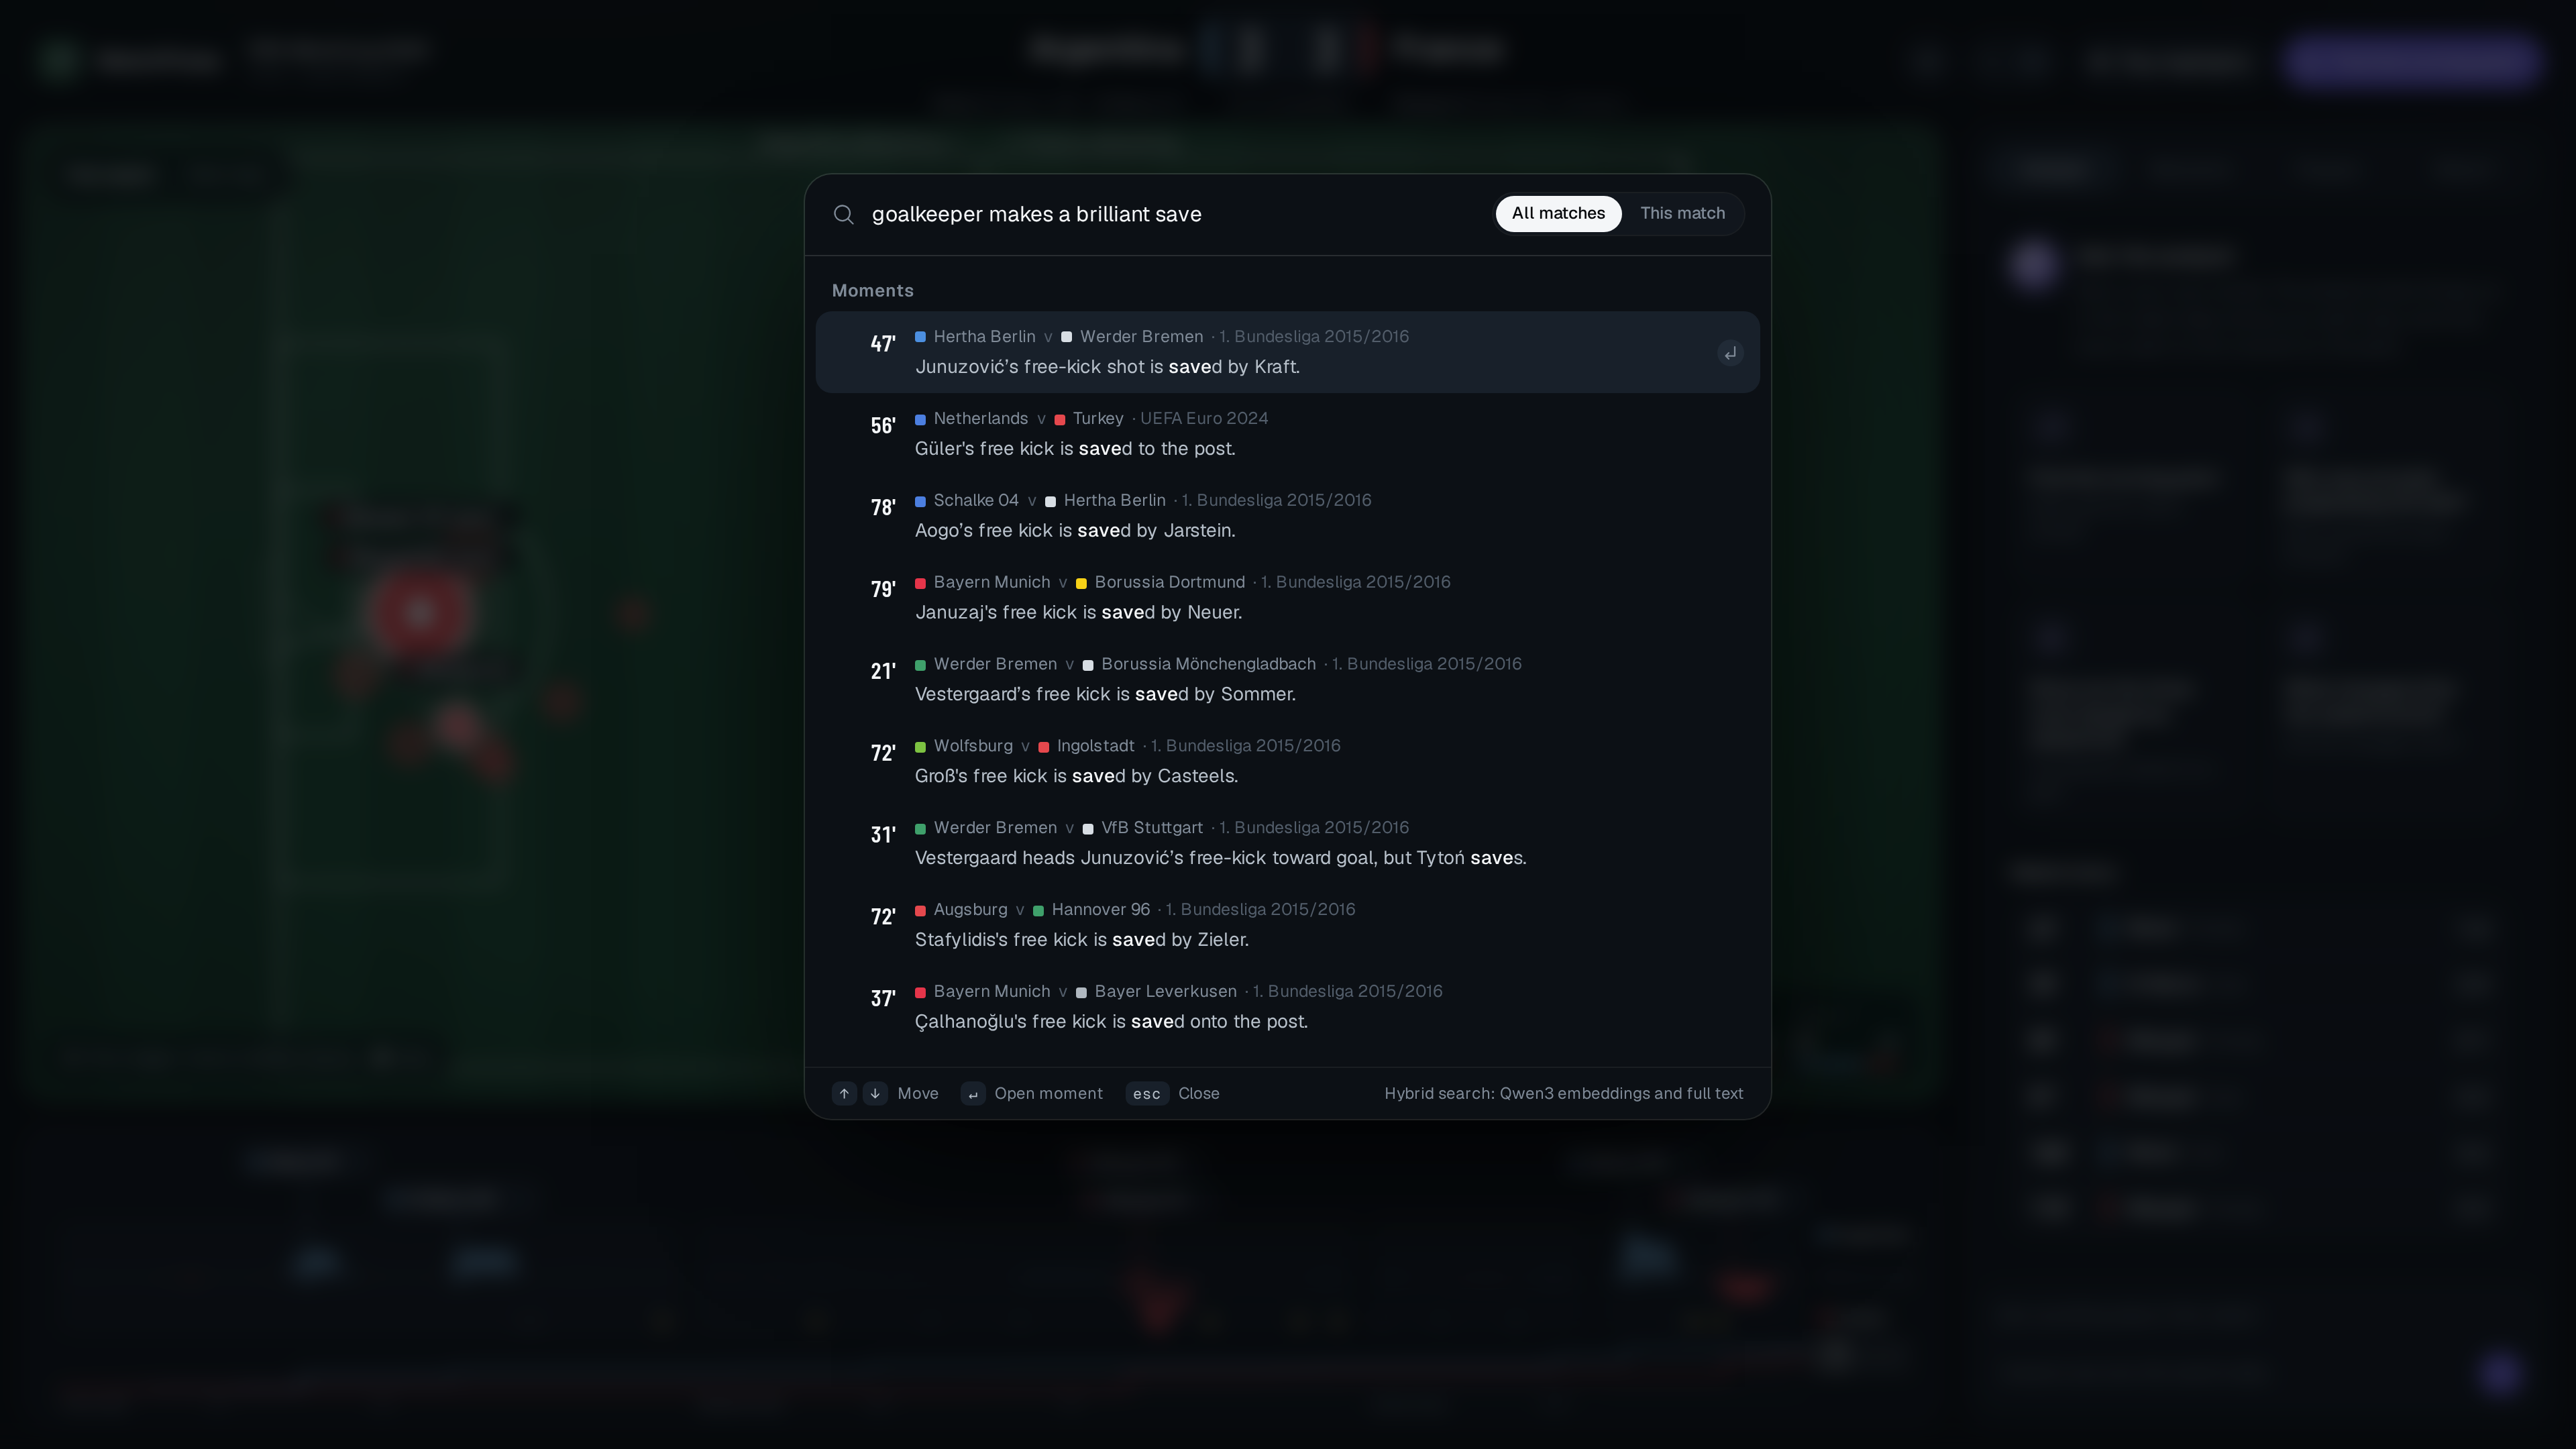
- Search every moment. Hybrid semantic and keyword search across all 3000 matches. "A goalkeeper makes a brilliant save" finds saves that never use those words.
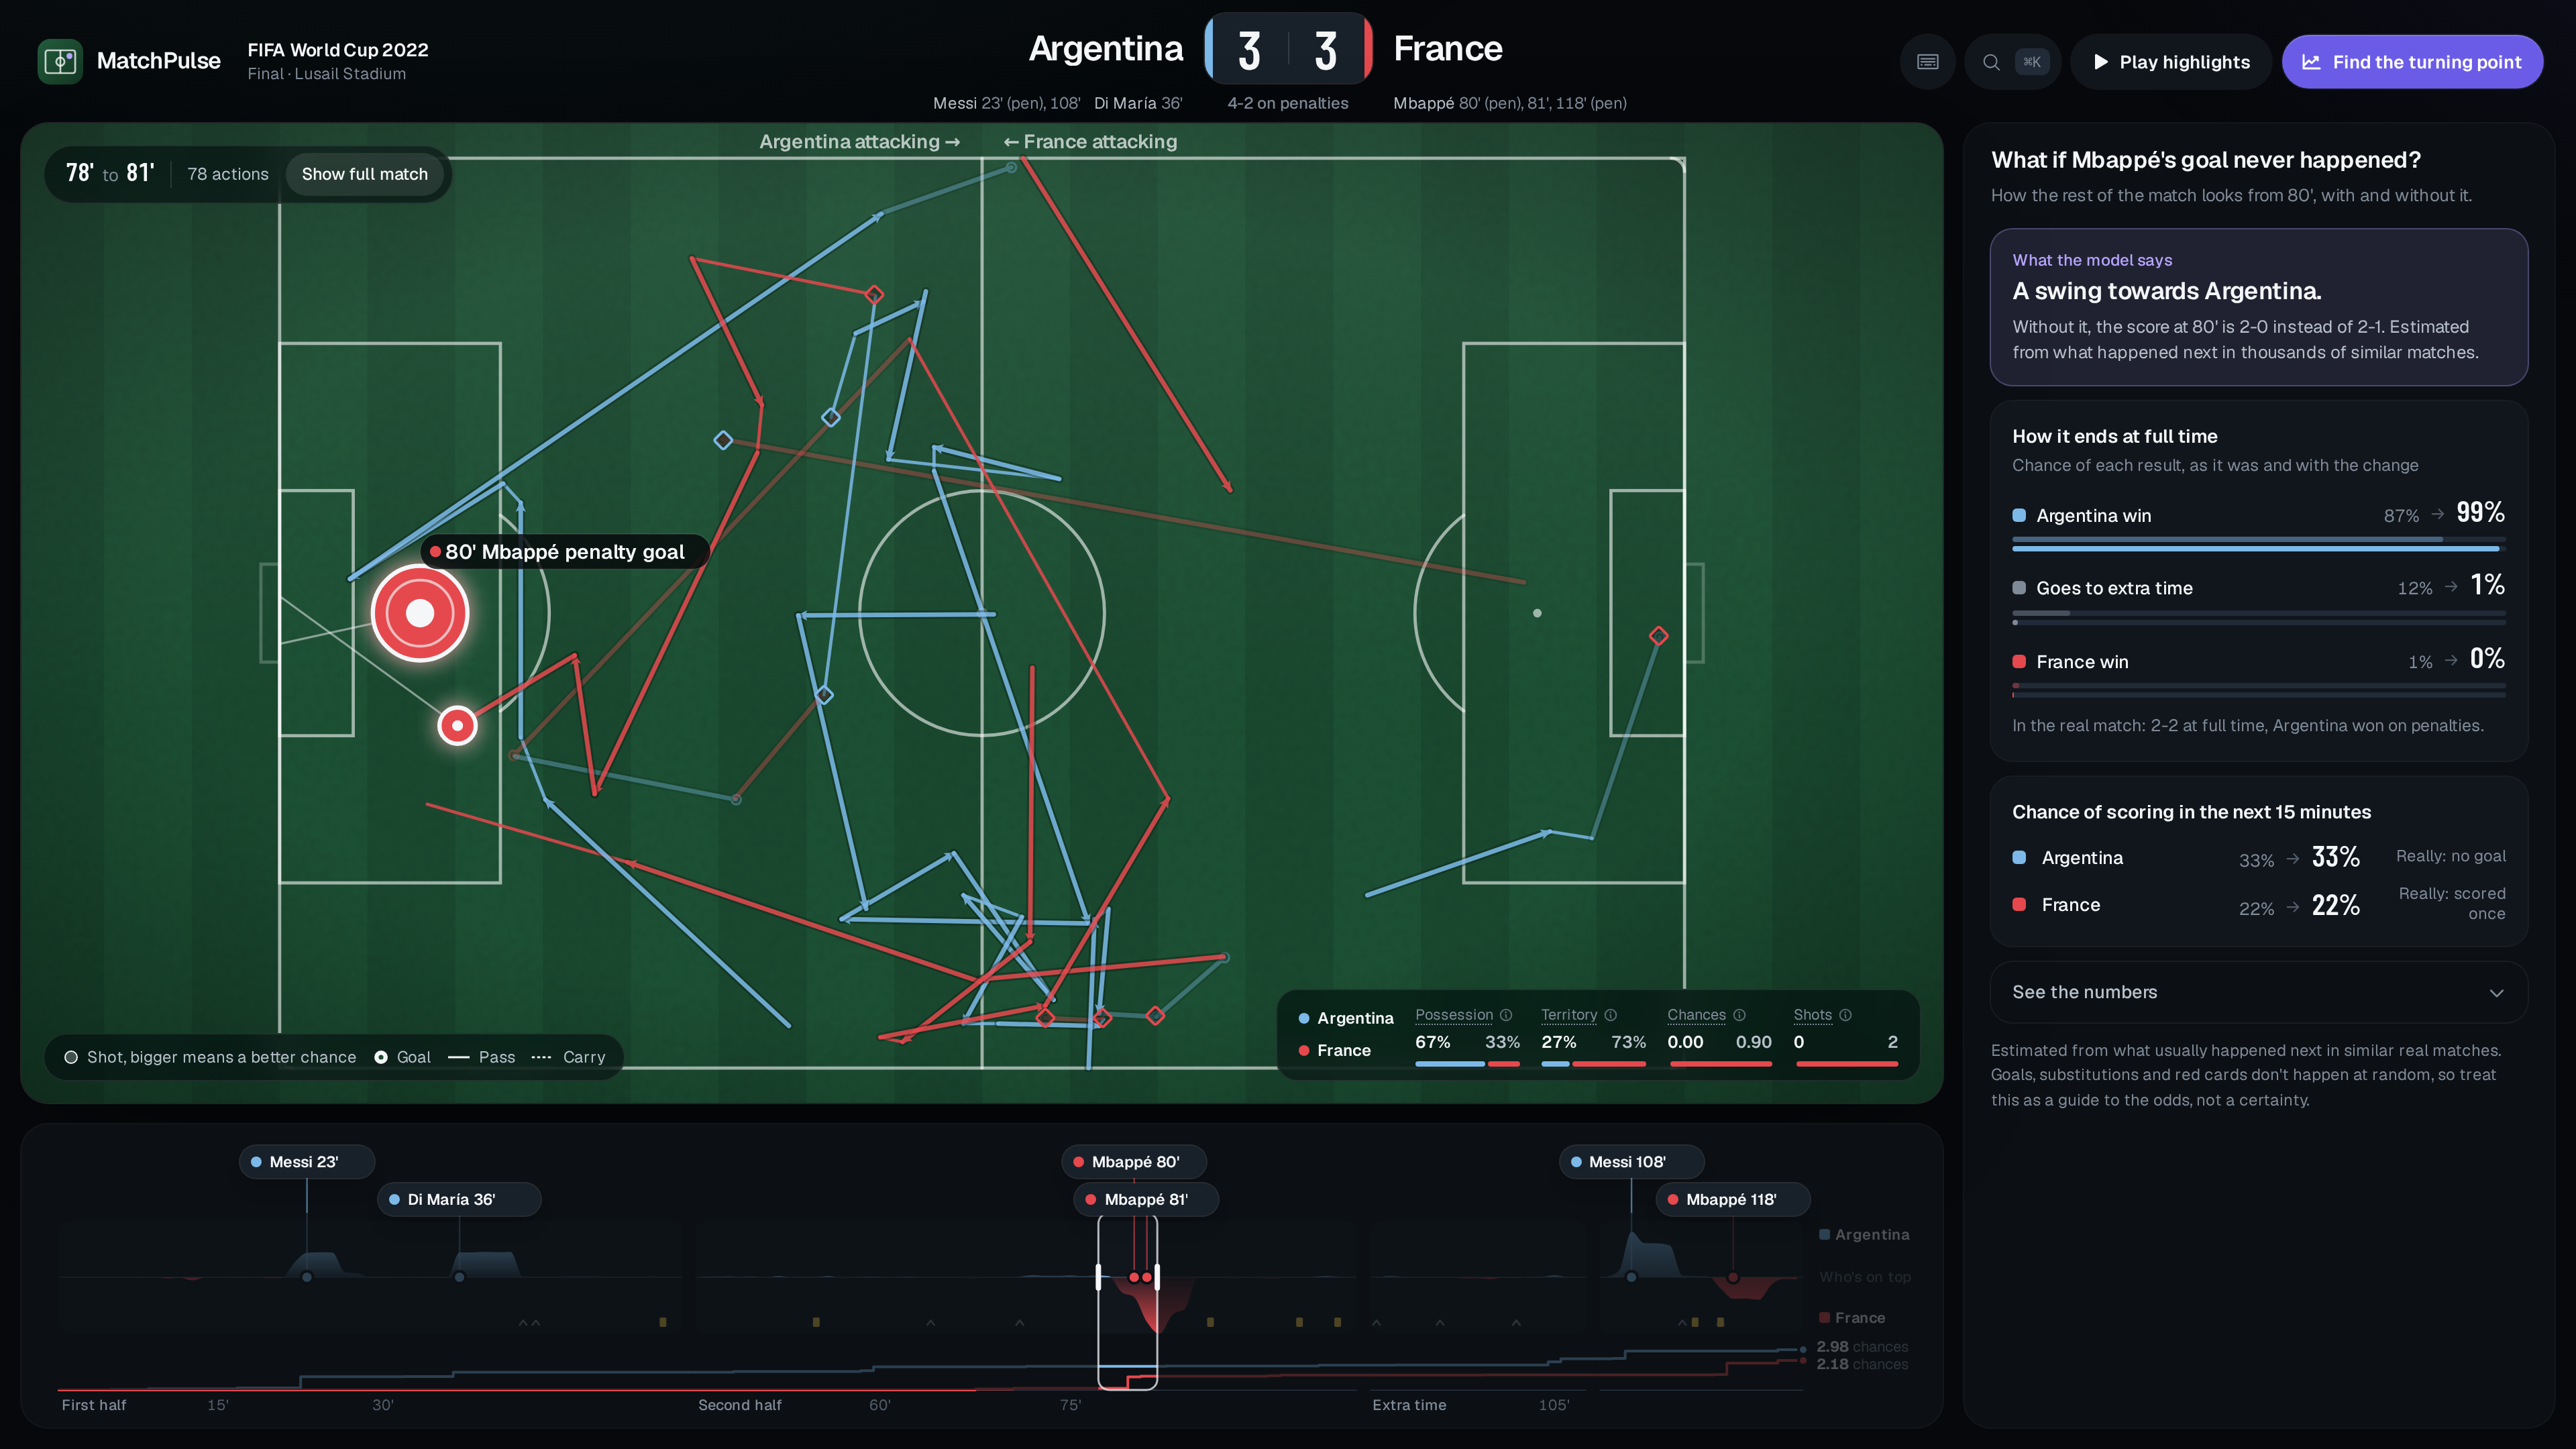
- Ask "what if?" Remove a goal, a substitution or a red card, and our models compare the rest of the match with and without it. Removing Mbappé's 81st-minute equaliser in the World Cup final, for example, moves Argentina's modelled chance of winning in normal time from 26% to 87%. Next to that, it shows the most similar real situations from 2,924 matches. Or pick a shot and see which passes were on instead, with a completion chance based on where the defenders were. All of this is clearly labelled as modelled, not as what would have happened.
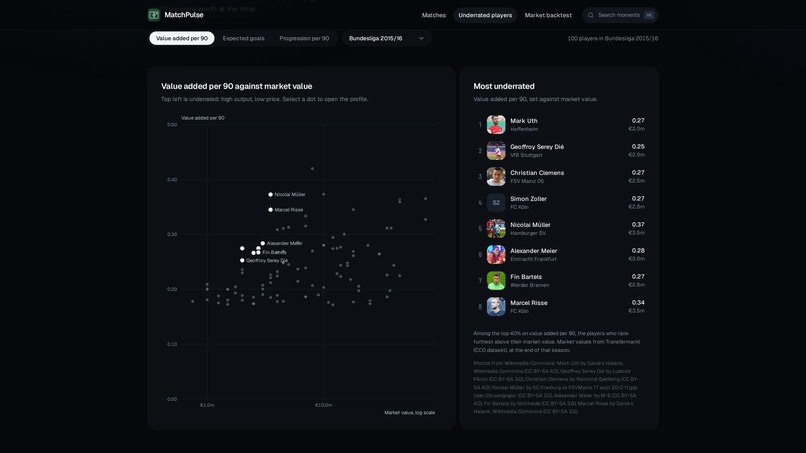
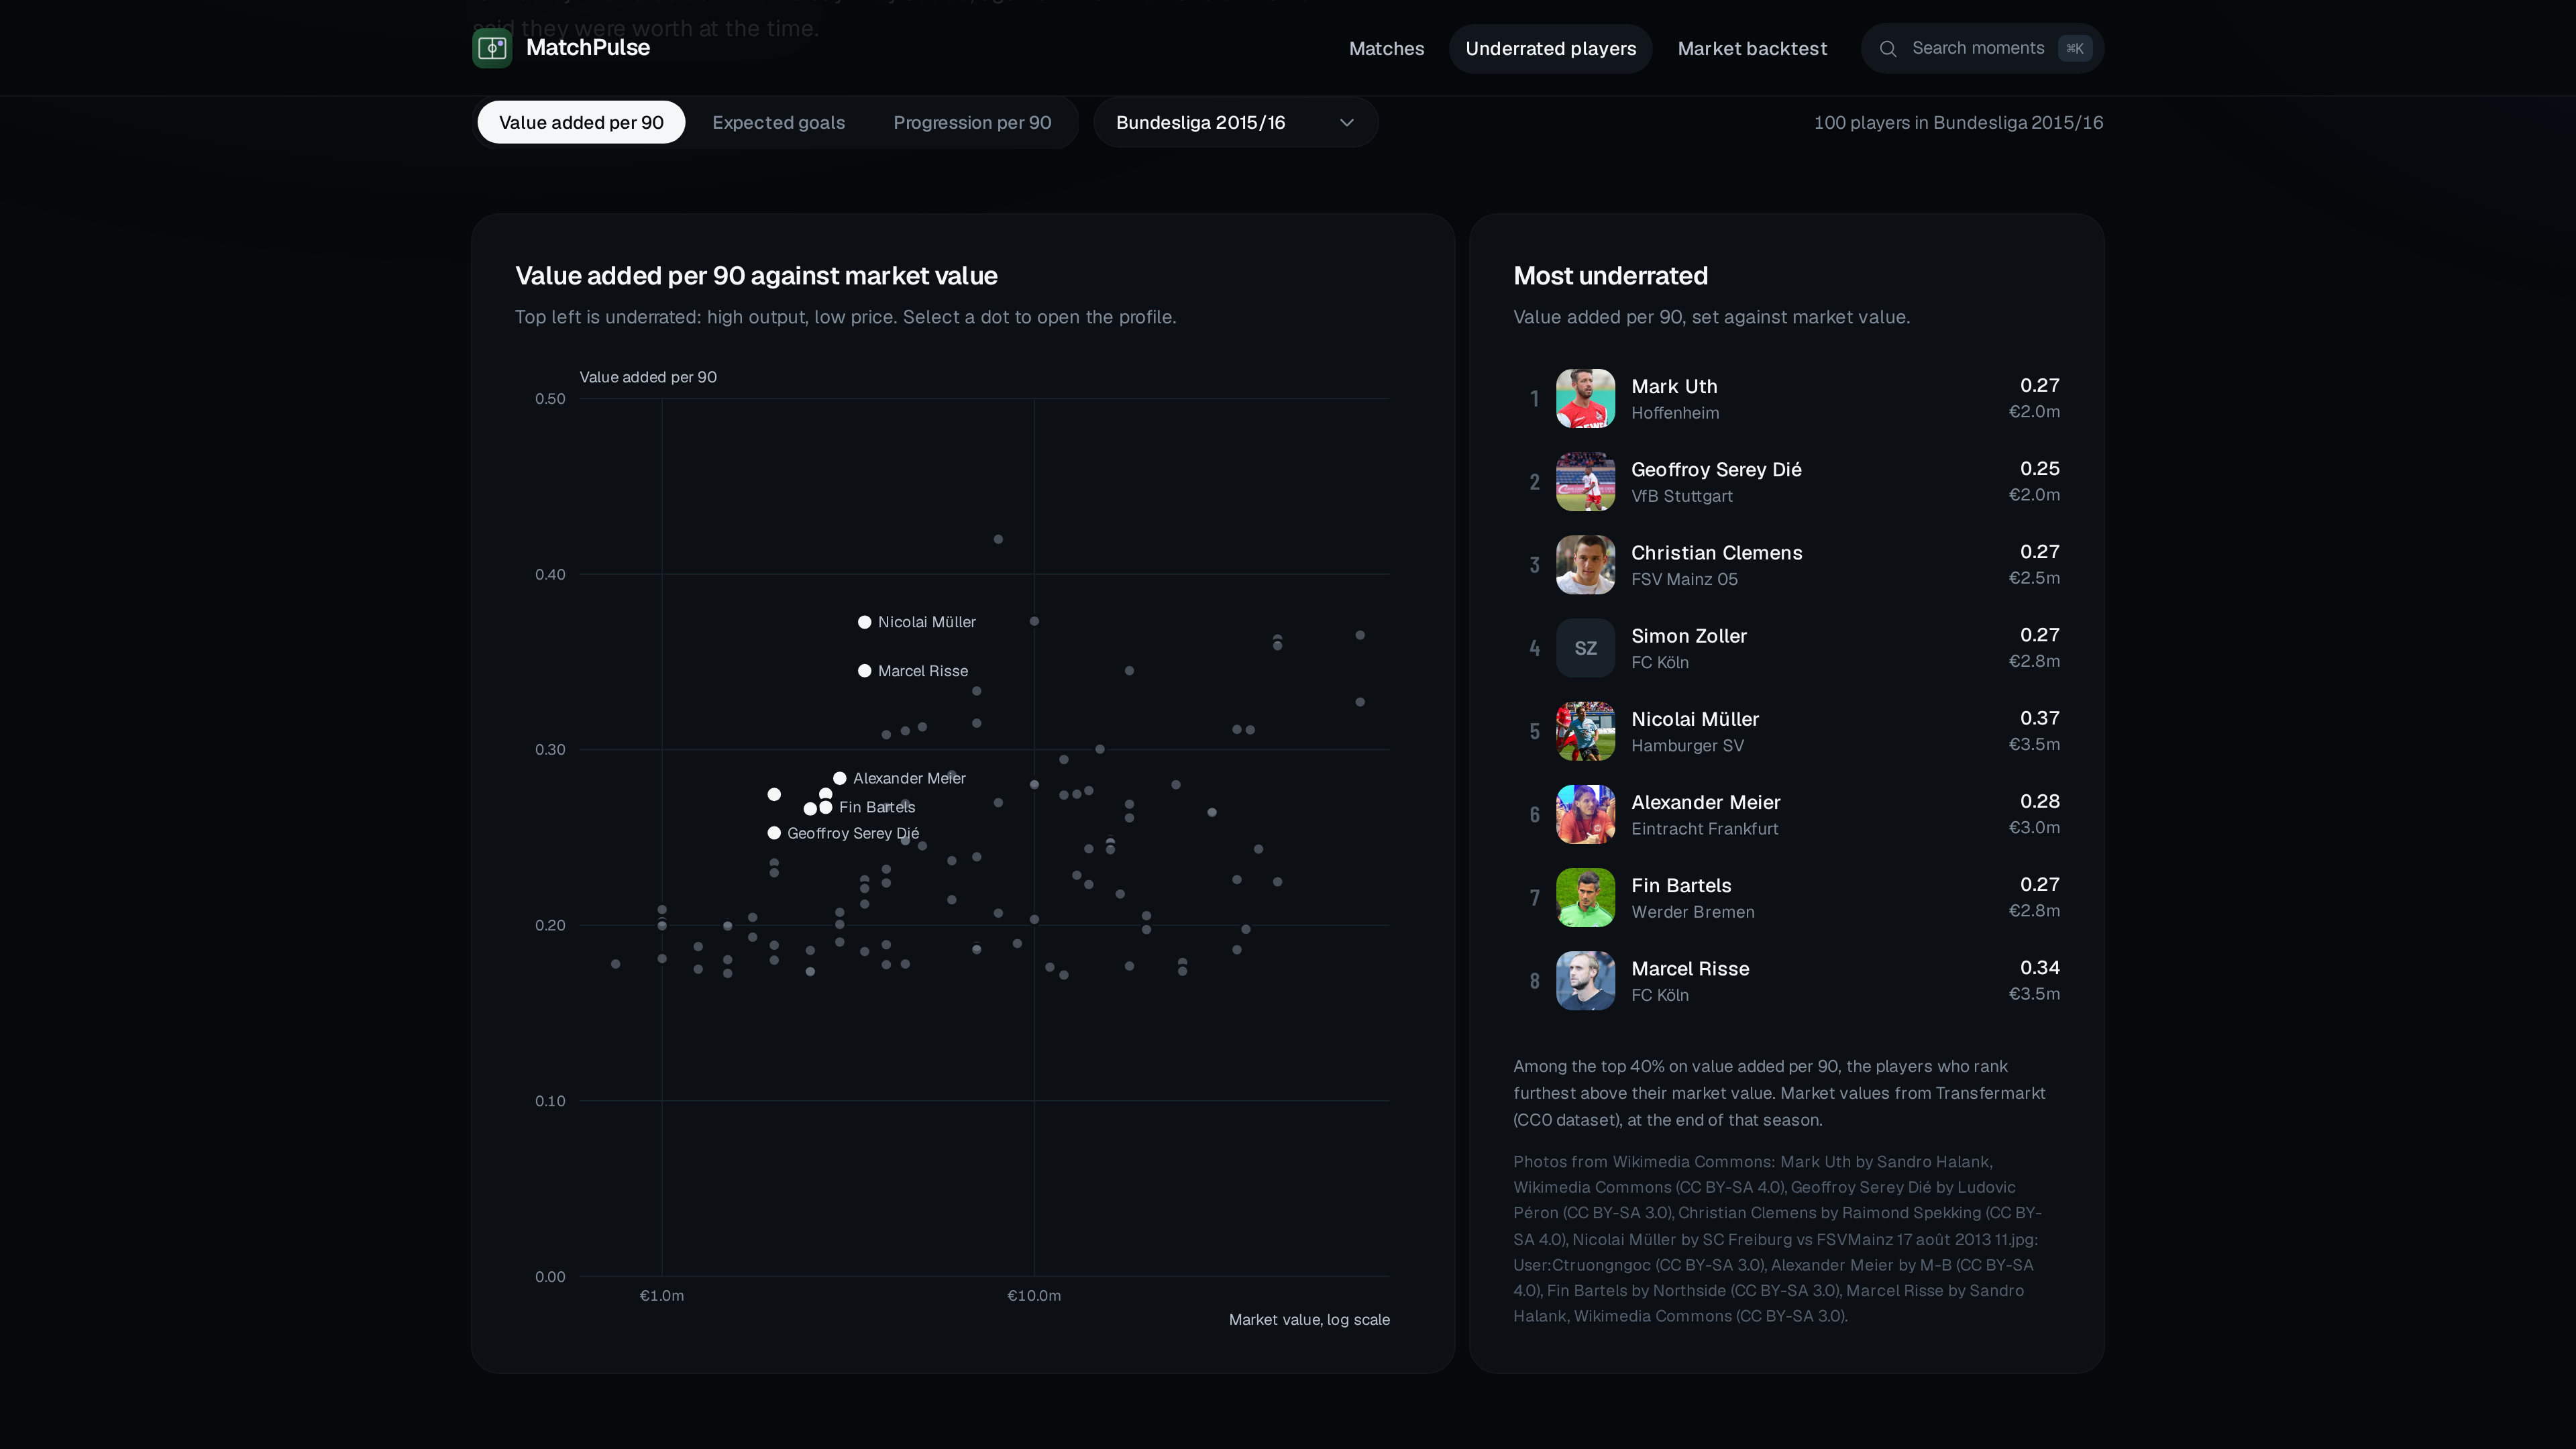
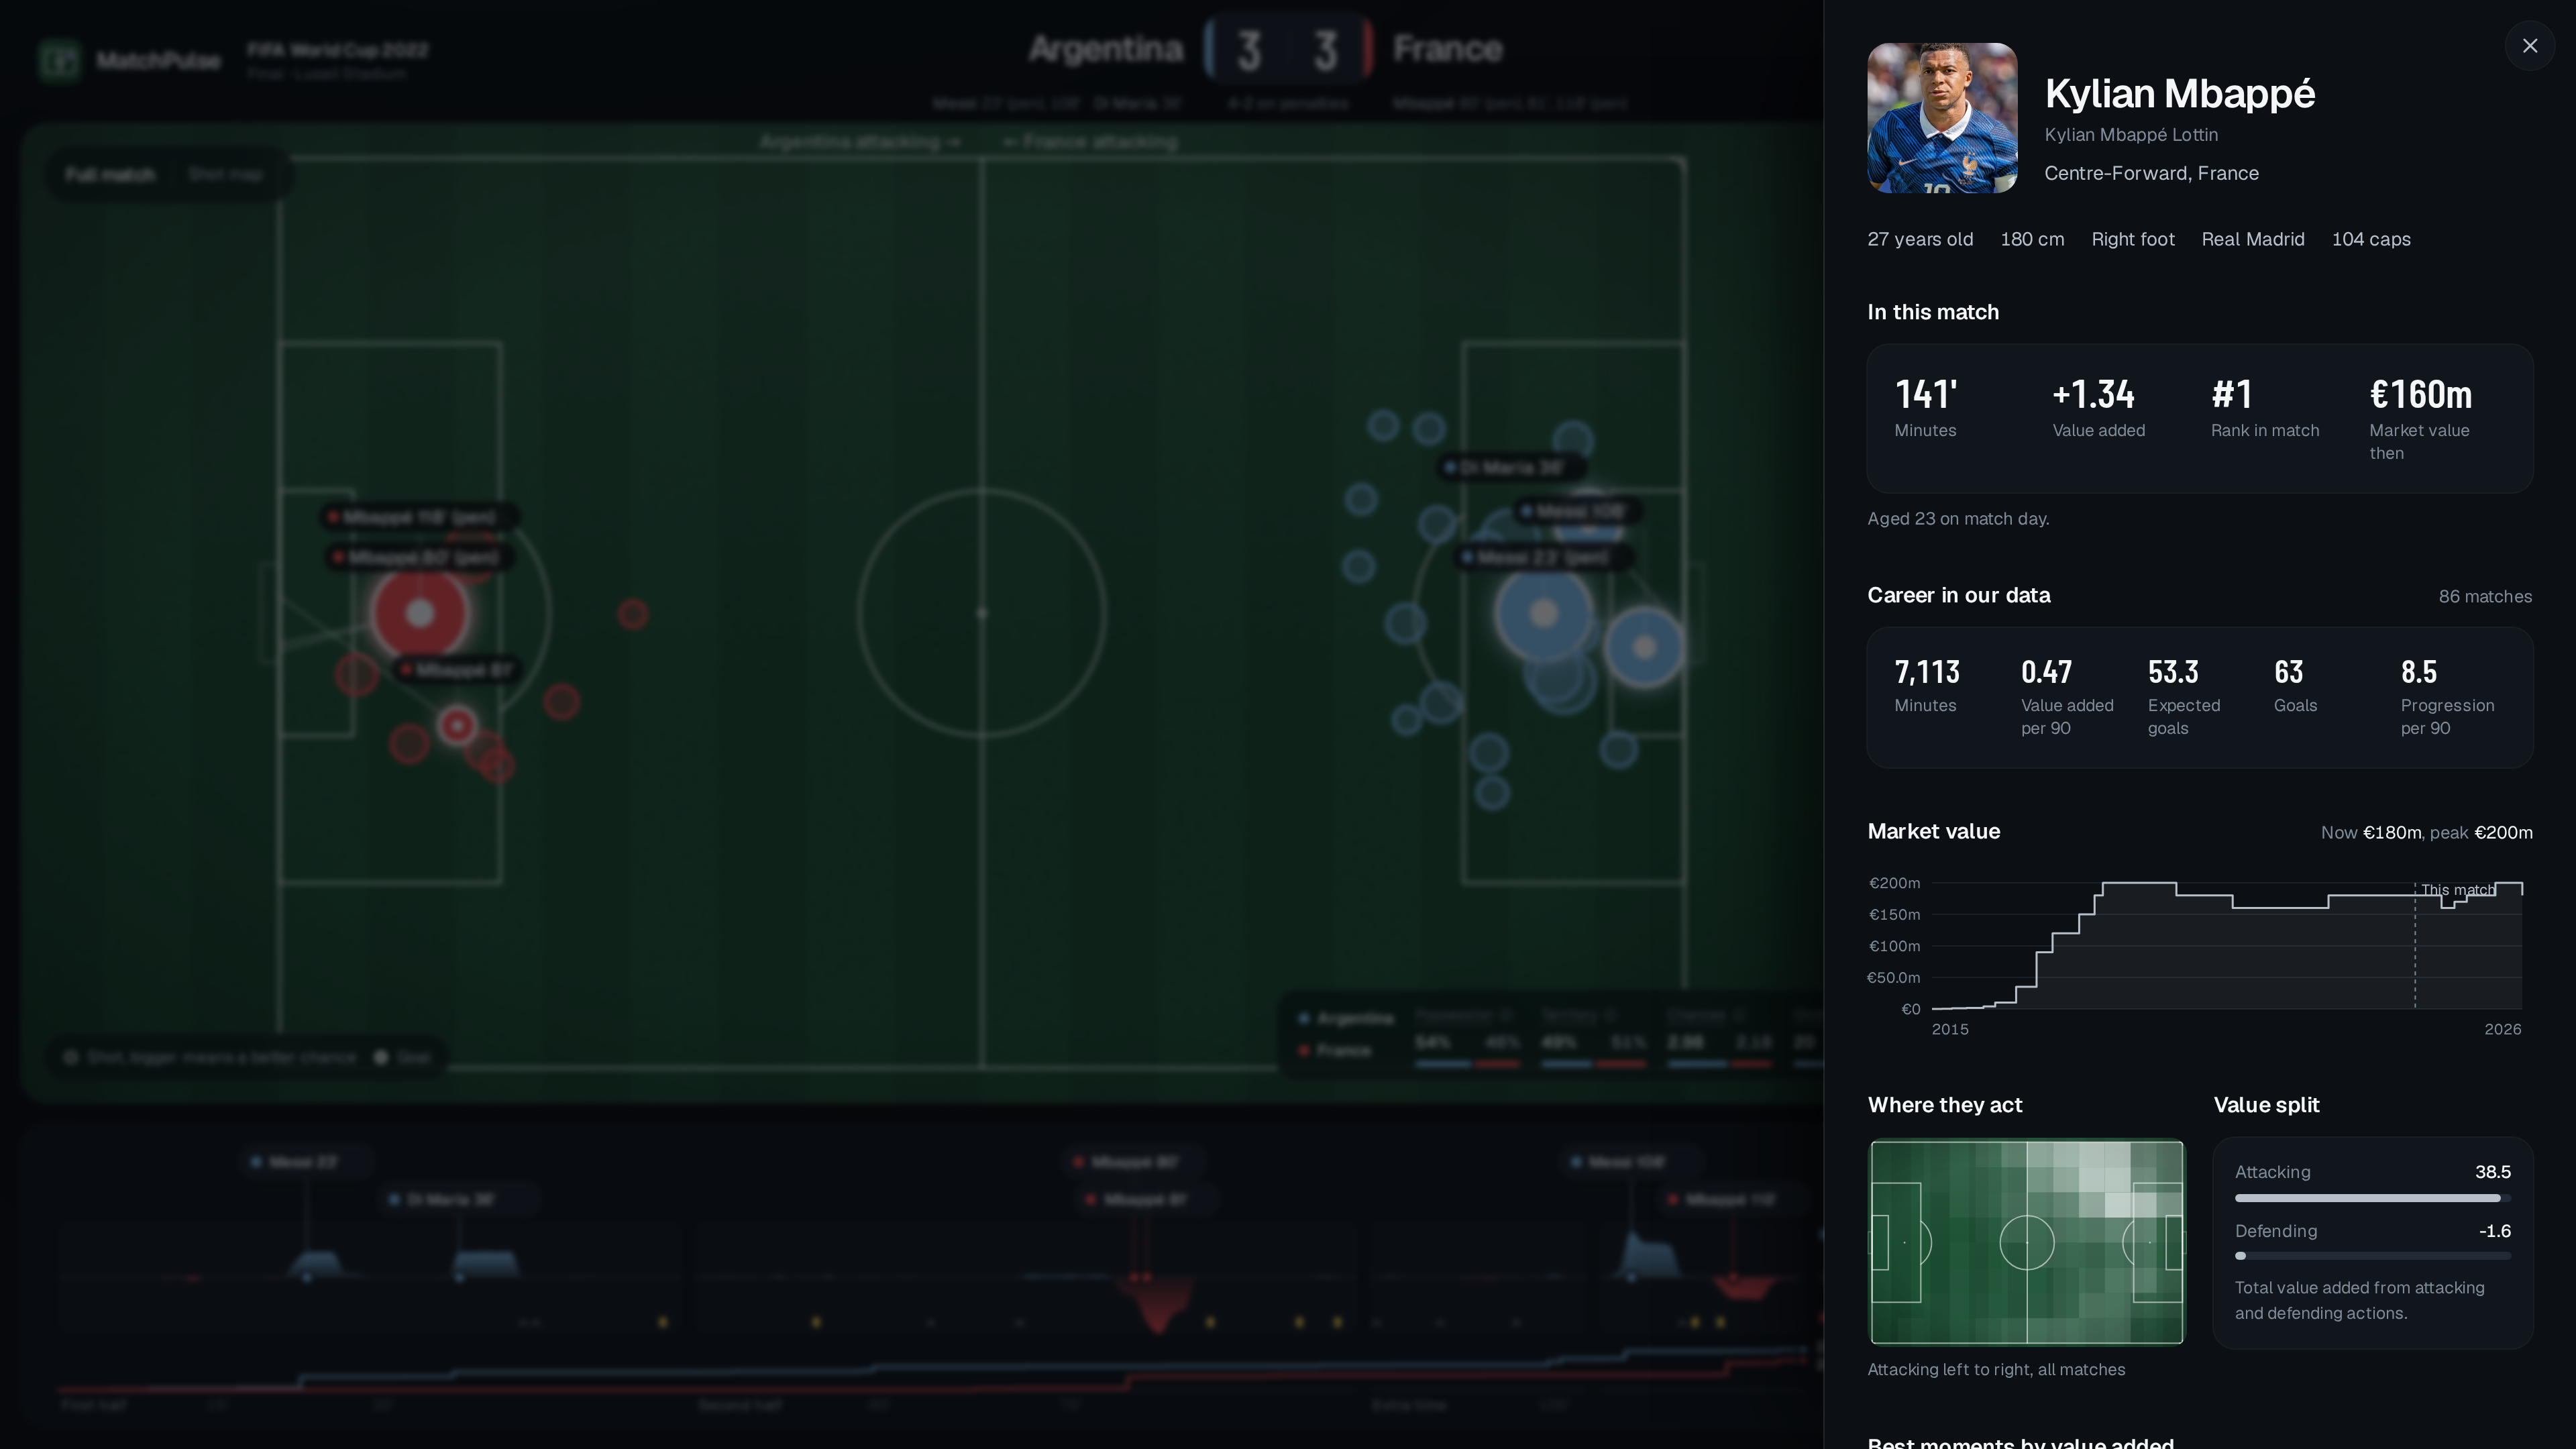
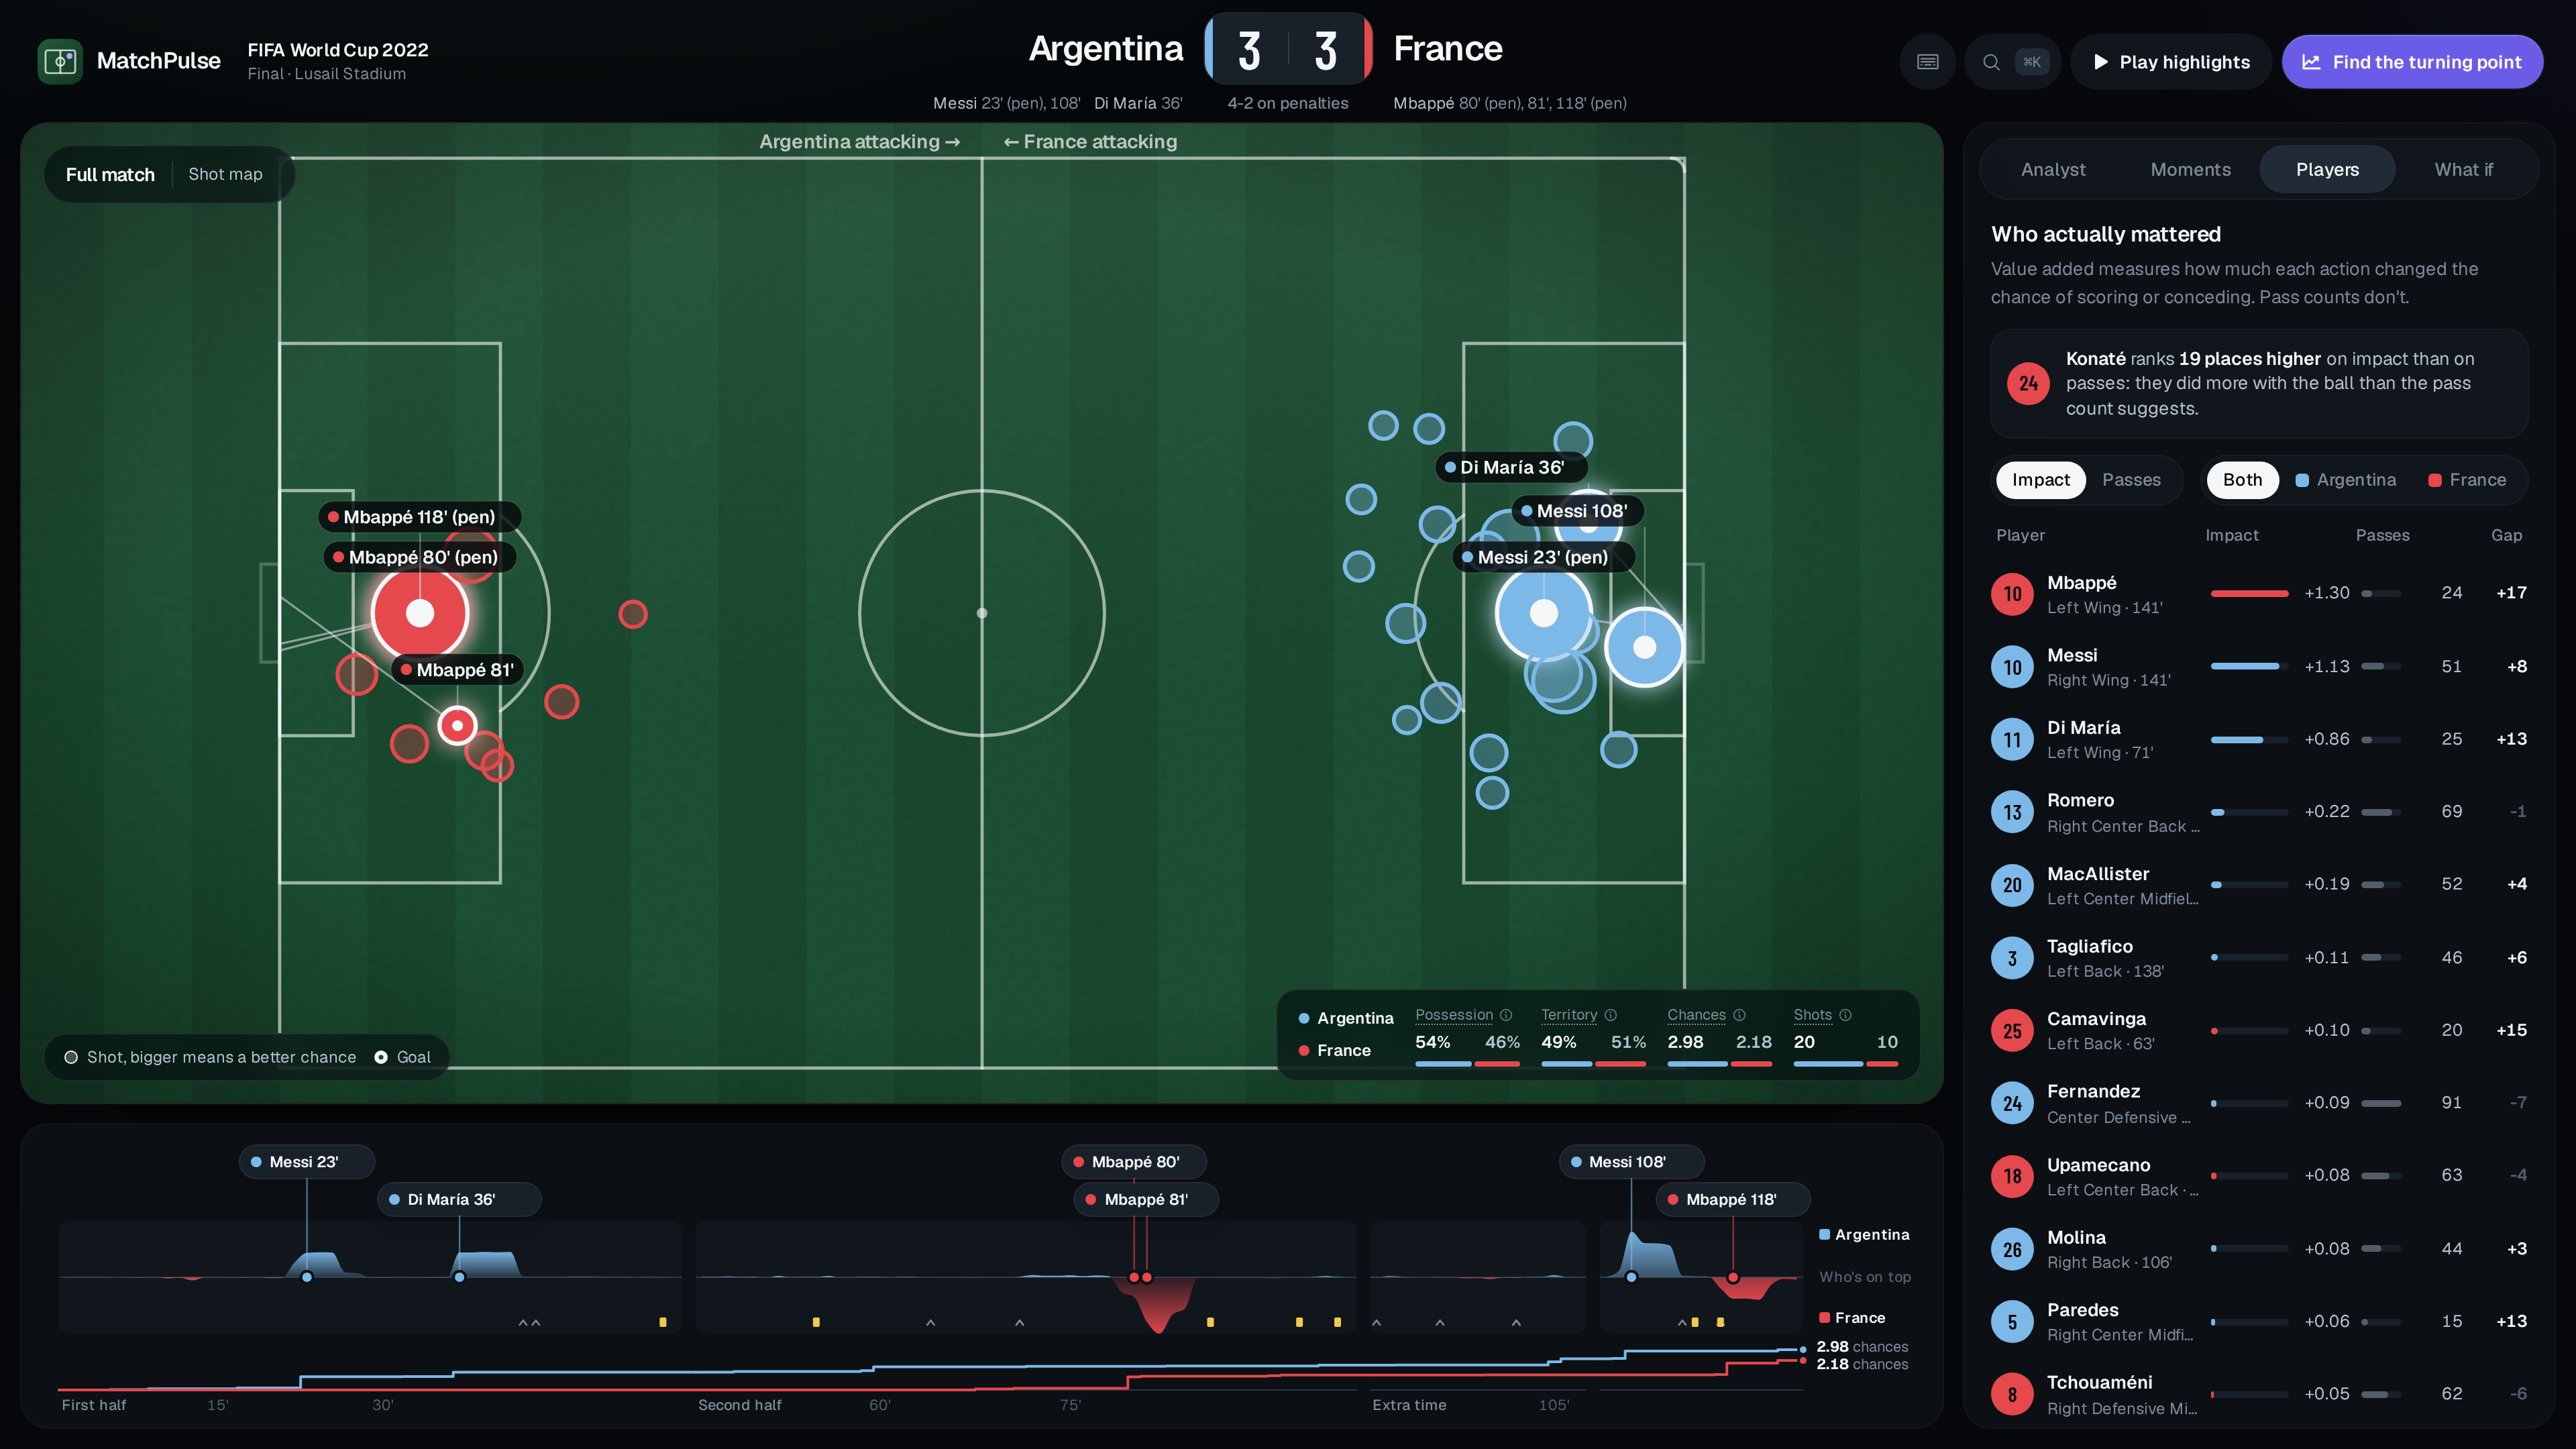
- See who really mattered. Players are ranked by value added (VAEP), not pass counts. Profiles include bios, market-value history, career numbers from our models, heatmaps and best moments. There is also a leaderboard of players the market underrated.
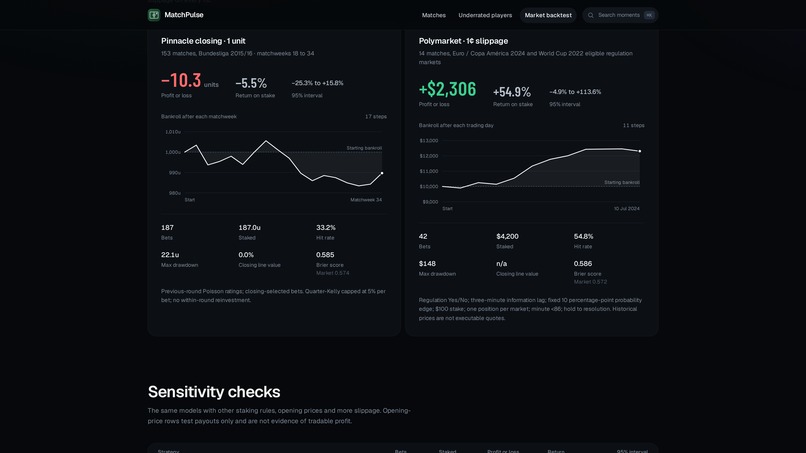
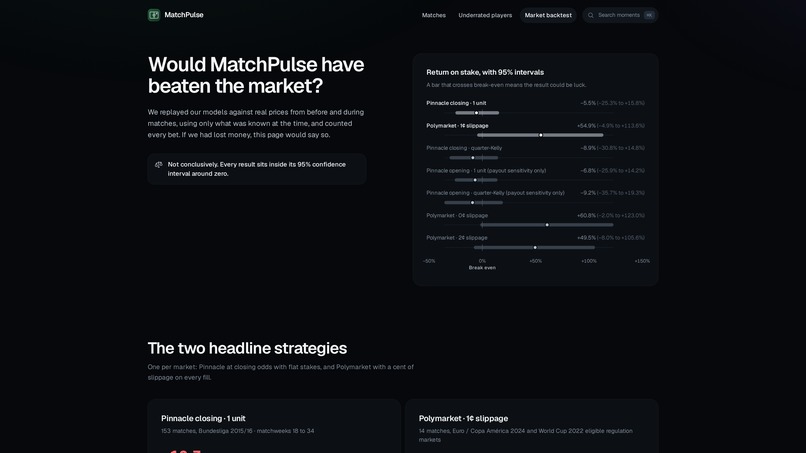
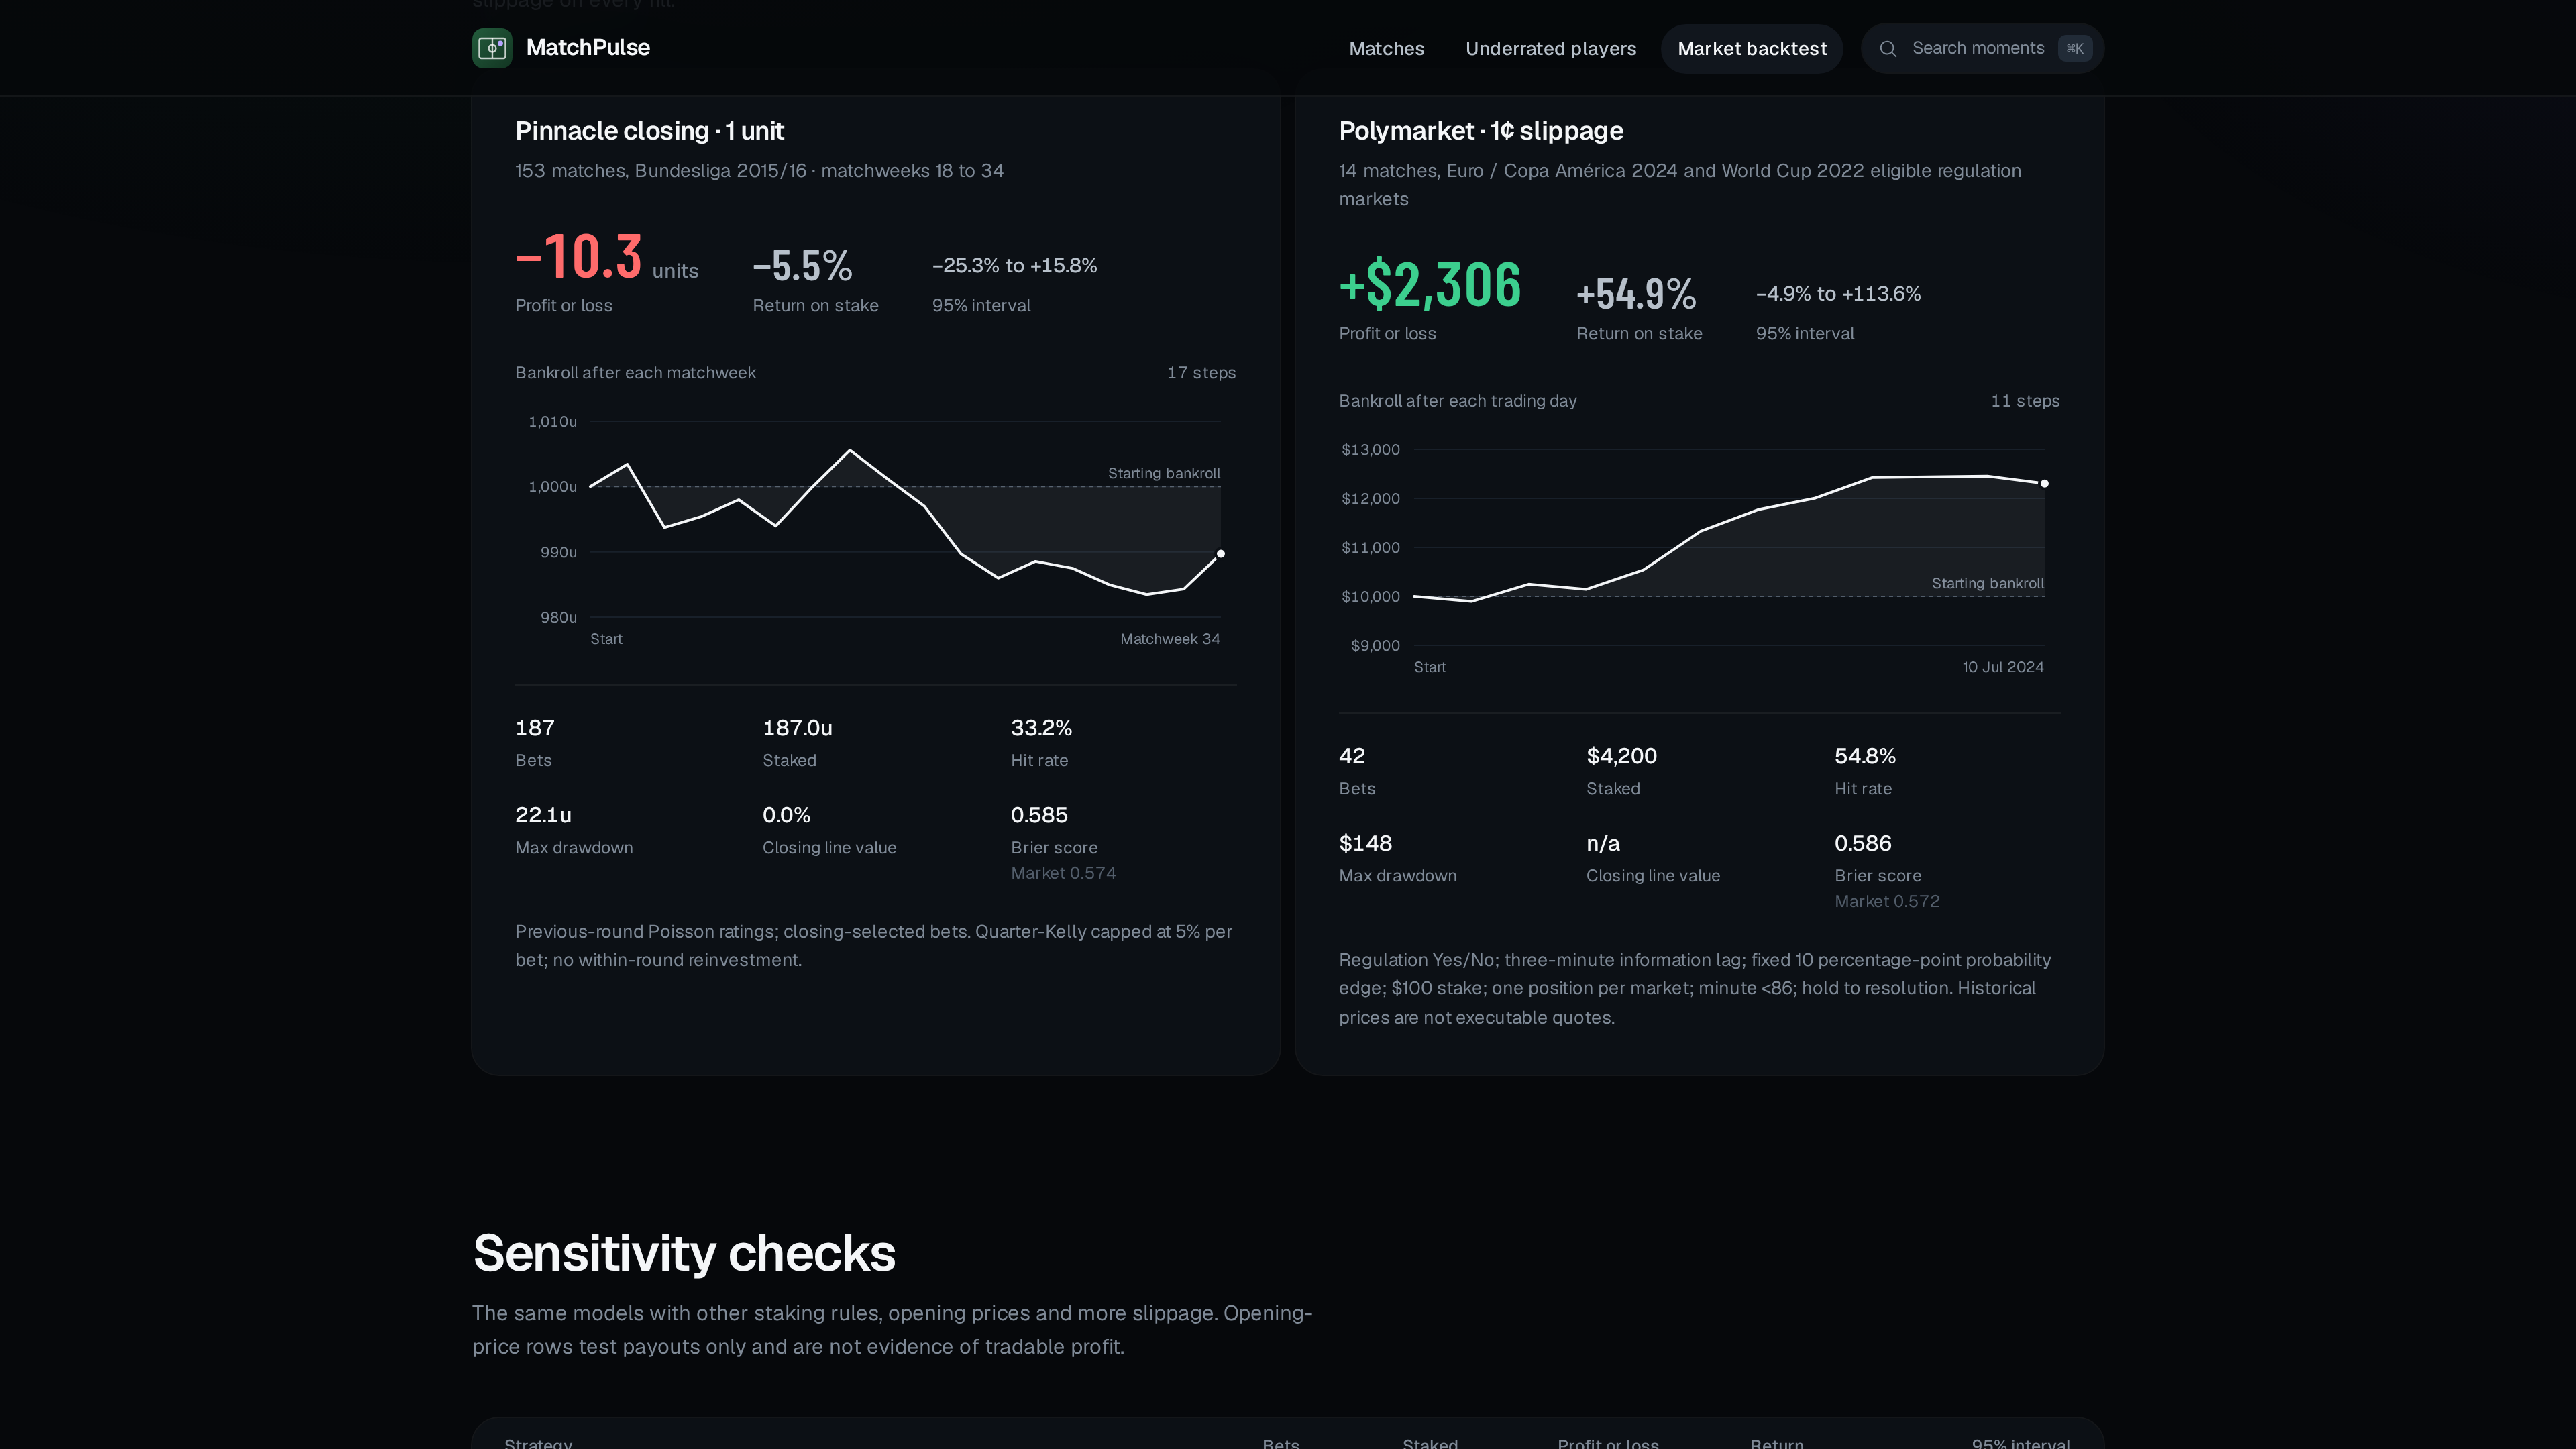
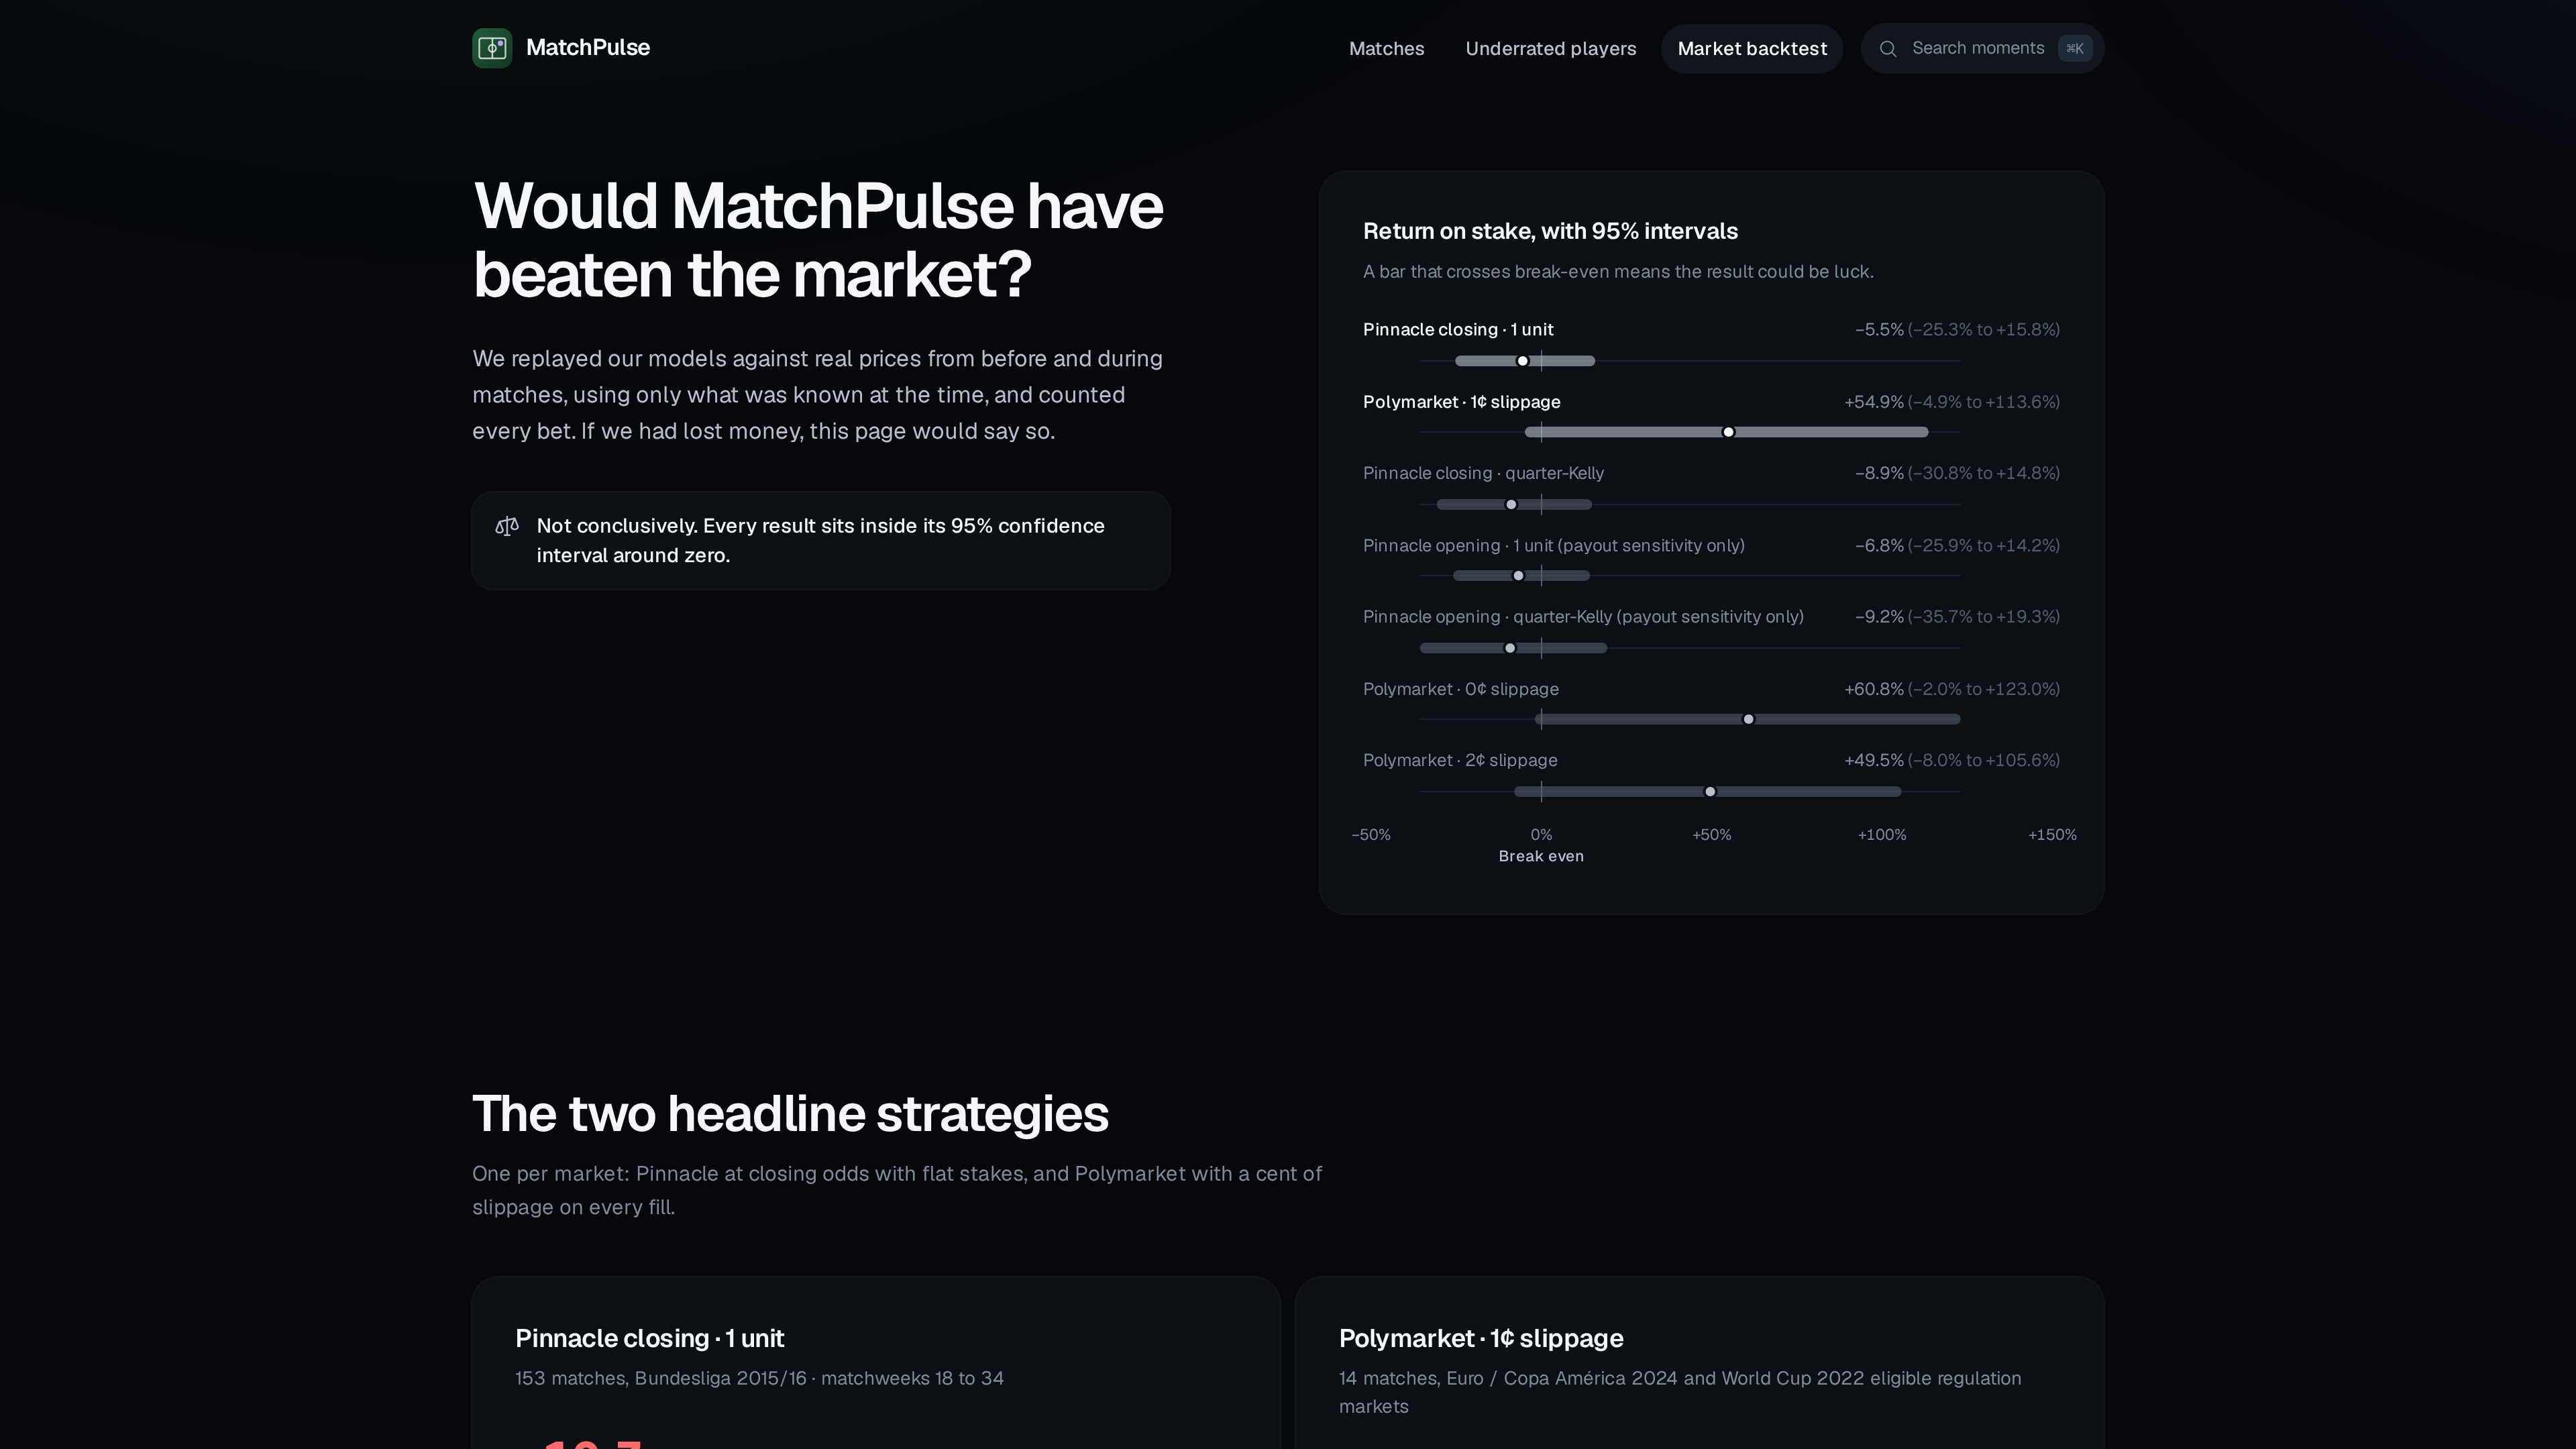
- Check us against the market. A full backtest against Pinnacle closing odds and Polymarket prices, with confidence intervals and every bet listed.
How we built it
- Data: StatsBomb open event data, converted to SPADL actions with socceraction. We train on all 2,924 men's matches in the dataset (5.96 million on-ball actions).
- Models: all trained by us, with cross-validation grouped by match, so every number shown for a match comes from a model that never saw that match.
- xG (LightGBM on 73,598 shots, with defender and keeper positions). It matches StatsBomb's own model: log loss 0.2629 vs 0.2628.
- VAEP for the value of each action (AUC 0.82) and xT for the threat of each pitch zone.
- Game-state model: quantile regression giving a range for the next 15 minutes of xG and possession. The ranges are calibrated: the middle estimate is hit 50% of the time and the upper one 90%.
- Actual-goals model: predicts how a match ends. It beats a score-and-clock-only baseline on held-out data (Brier 0.407 vs 0.436).
- Pass completion using 360 freeze frames (AUC 0.936), player ratings, a pre-match result model and in-play win probability.
- Database: TimescaleDB stores 1.75 million events in a hypertable. A per-minute continuous aggregate answers timeline queries in about 1 ms. pgvector indexes the commentary for search.
- AI: GPT-6.1 Sol is the analyst, GPT-6 Luna writes the commentary, and Qwen3 embeddings run on Cloudflare Workers AI. Search fuses embedding similarity with Postgres full-text rank.
- Grounding: the analyst can only explain what the tools return. Every sentence is checked before it streams:
- every number must appear in a tool result;
- a number with a unit ("3 shots") must come from a field about that unit;
- every citation must point to a real event;
- "would have" phrasing is blocked.
- Stack: Python 3.12, pandas, LightGBM, FastAPI with server-sent events; React, TypeScript, Vite, Tailwind, D3 and Motion on the front end.
Challenges we ran into
- Missing matches. StatsBomb's match index leaves out 273 matches that do have event files, including most of Bundesliga 2015/16. We rebuilt their teams and scores from the events and checked the method against all 6 million indexed matches.
- Leakage. It's easy to show a model's score for a match it was trained on. Grouped cross-validation had to run through the whole chain: xG feeds VAEP, VAEP feeds player ratings, and those feed the what-if models.
- A what-if that didn't react. Our first version barely responded to the score: removing an equaliser showed almost no difference. We built a separate model trained on actual goals so the answer reflects how matches really end.
- Stopping the AI from making things up. Getting an LLM to cite real events and never invent a number took a sentence-by-sentence checker and a set of 10 test questions. All 10 now pass with no rejected sentences.
- Matching players across datasets. We link StatsBomb players to Transfermarkt by match date, club and name. That covers 87.8% of minutes played (about 98% in the Bundesliga). Unclear matches are left unmatched rather than guessed.
- Being honest about the market. Pinnacle's closing line beat our pre-match model (−4.2% ROI over 203 bets). Polymarket in-play came out +54.9%, but over only 42 bets on 14 matches, with a confidence interval that crosses zero. We report it as no proven edge.
Accomplishments that we're proud of
- An xG model as accurate as StatsBomb's own, trained in a hackathon.
- An analyst that cites every claim and can't invent numbers, with every citation jumping the pitch to the moment.
- 82,580 lines of commentary grounded in the event data, searchable by meaning across 3000 matches.
- What-if scenarios backed by calibrated models and real comparable situations, always labelled as modelled.
- A market backtest we didn't spin. It mostly says we can't beat the bookmakers.
What we learned
- Explaining beats predicting. Fifteen minutes of xG mostly depends on whether one big chance happens, so even a good model is uncertain. What helps fans is the why, with evidence.
- Baselines keep you honest. Our in-play win-probability model, with all its xG and VAEP features, was no more accurate than score and clock alone. We'd never have known without the baseline.
- Grounding has to be enforced, not requested. Telling an LLM to "only use tool results" isn't enough. Checking every sentence is what made the analyst trustworthy.
- Jargon loses people. Every screen needs to make sense to a casual fan, not just an analyst.
What's next for MatchPulse
- Live matches: plug in a live event feed so the analyst and turning points update during the game.
- Searching for tactical ideas: pressing traps, transition patterns and set-piece routines, not just single moments.
- Deeper player analysis: ratings by role and what a player is expected to add to a specific team.
- More competitions, including women's football, which StatsBomb's open data covers well.
- A real market test: more matches and forward testing before anyone calls it an edge.
Built With
- fastapi
- framermotion
- lightgbm
- nextjs
- pandas
- pinnacle
- python
- react
- scikit-learn
- socceraction
- statsbomb
- timescaledb
- transfermrkt
- typescript
- vite
