-
-
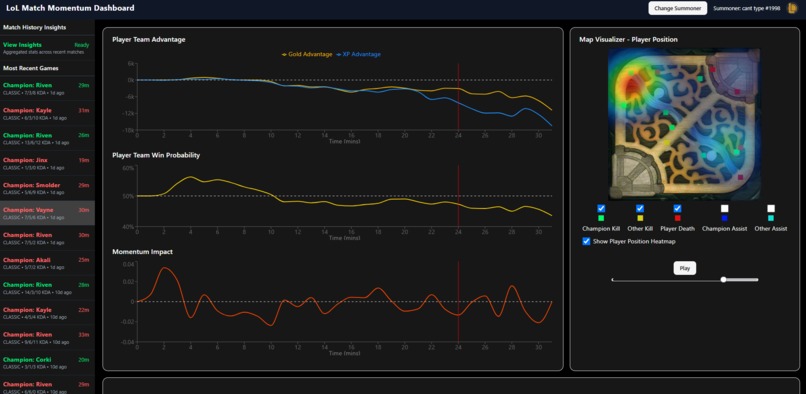
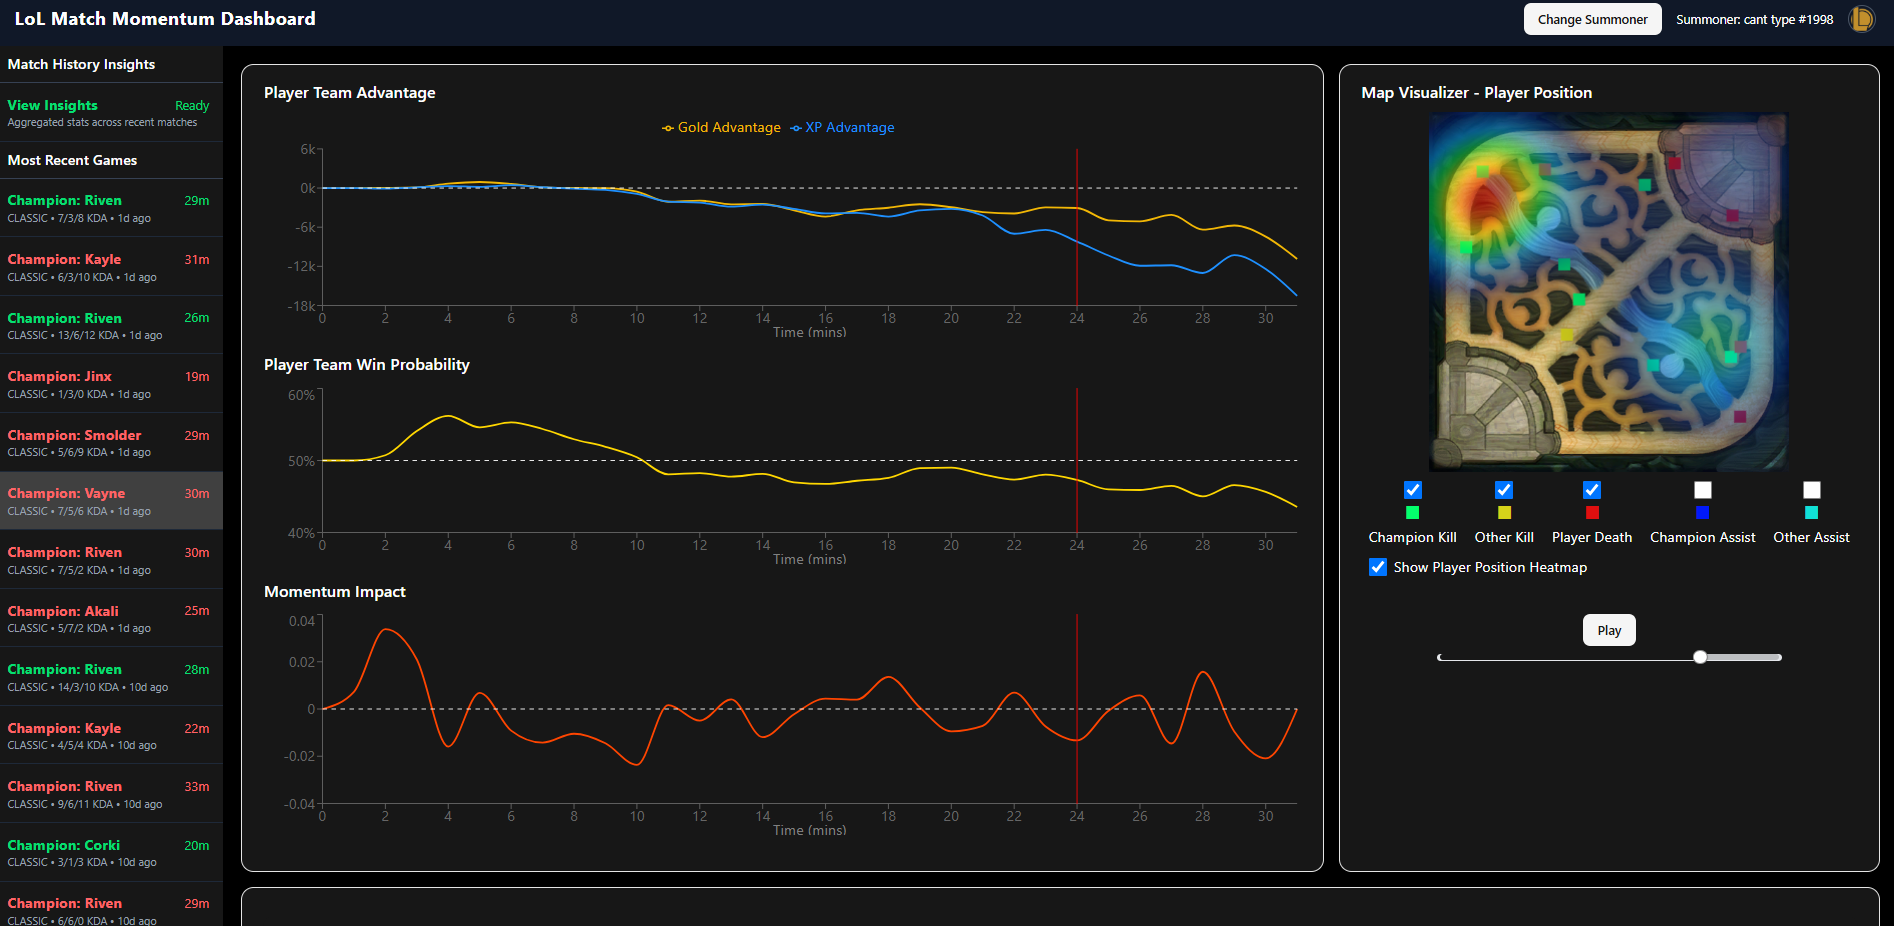
Analysis over a single game
-
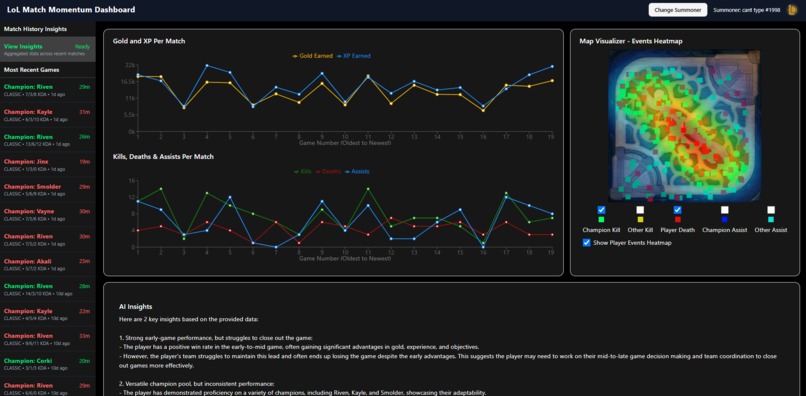
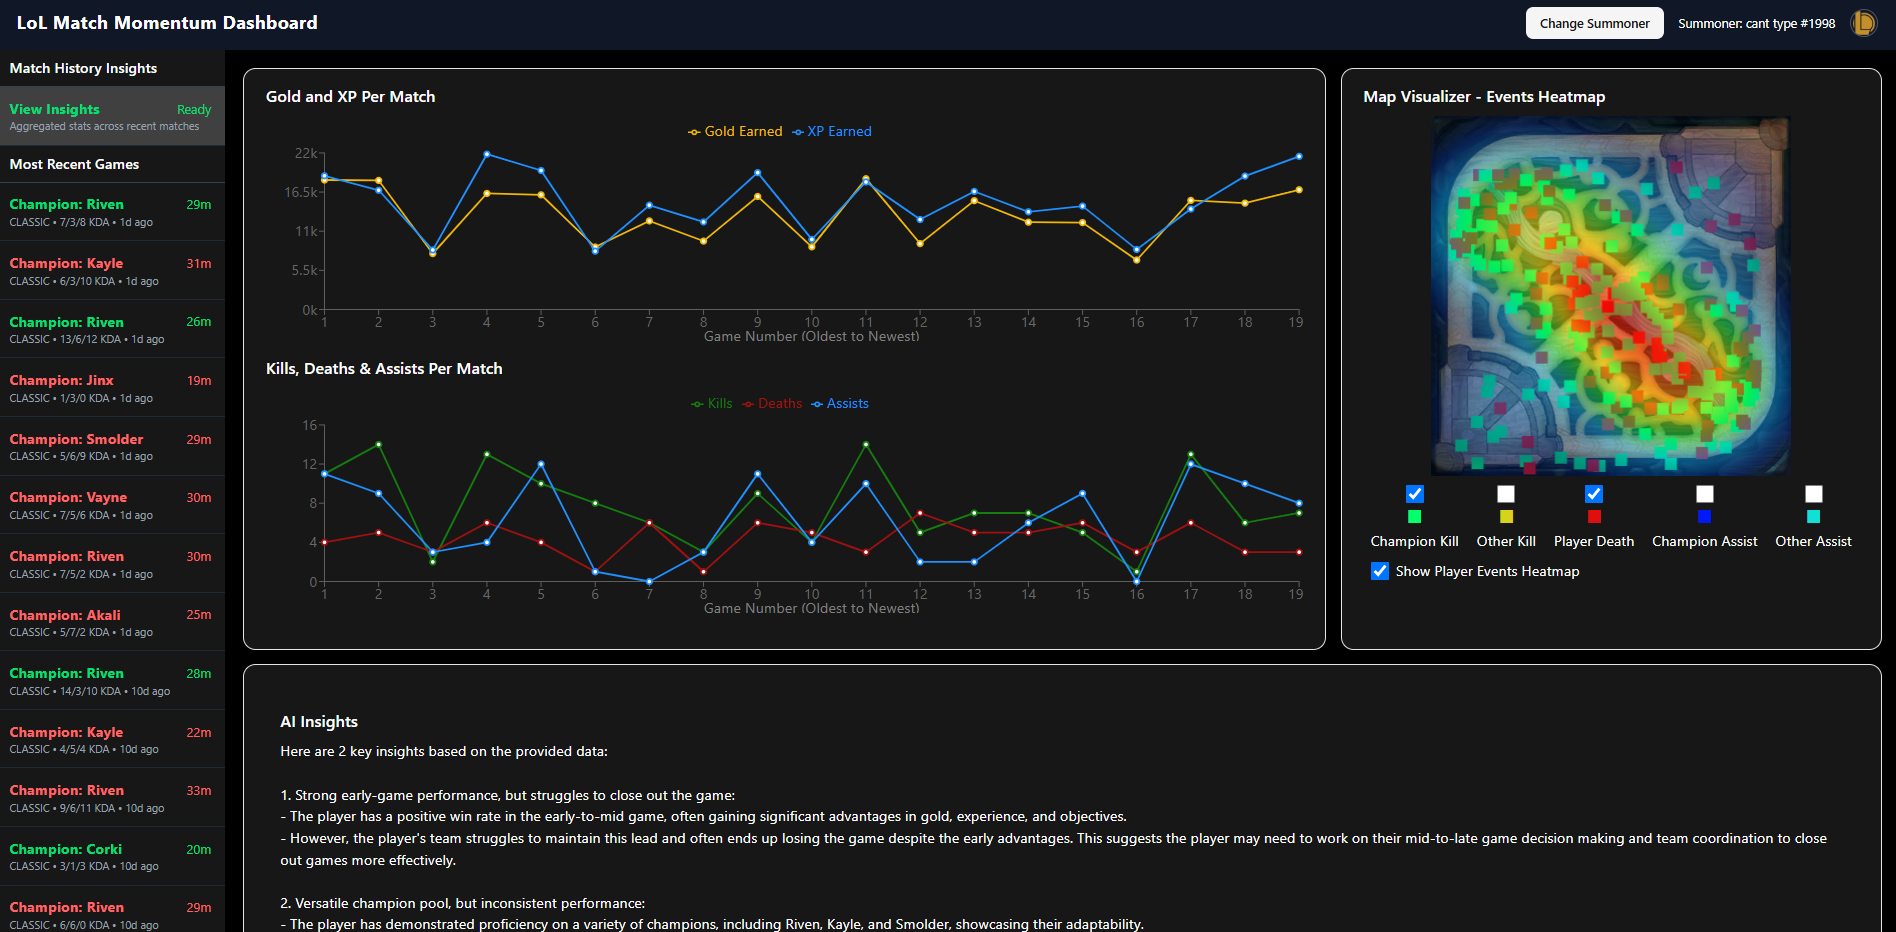
Analysis over multiple games
Project Overview
The Match Momentum Dashboard turns minute-by-minute game timelines into a narrative of control: who was gaining, who was losing, when the game swung and where those swings happened on the map. Instead of only showing raw totals or isolated events, the dashboard visualises probability, momentum, and spatial patterns so a player can answer questions like “When did my team actually take control?”, “Which minutes mattered most?”, and “Where on the map do my decisive plays happen?”.
Inspiration
Inspired by similar projects we have done for football match analysis, where match momentum and player touch heatmaps are key indicators of the final outcome, we thought that current data visualization platforms for LoL lacked aspects of this. Raw LoL data tells you which team and player had what resources, but they don’t show the dynamic story of control. We wanted a single, intuitive view that shows how a player's position and actions over time affect the final outcome of a match. Using this information as an input, we then wanted to create further unique insights into a player's performance by querying an LLM. Overall, our goal was not just to quantify who’s winning, but to visualise the story arc of a match, and use this to provide input to an LLM to provide feedback on the user's performance
What it does
What exactly is Match Momentum
We define momentum as a short, actionable translation of many signals into a single concept: the change in a team’s win expectancy over time. Rather than treating a kill, an objective or a wave clear as isolated facts, we allow a user to ask “how much did that action, at that time and position, move the probability needle for your team?”
In competitive games like League of Legends, momentum describes how control and advantage shift between teams over time. It’s a reflection of who is dictating the tempo, securing objectives and putting sustained pressure on the opposition.
To quantify this, we adapted the Pythagorean Expectation, a concept from baseball analytics developed by Bill James. Originally, it estimated a team’s win percentage from runs scored versus runs allowed, using the formula:
$$ P(Win) = \frac{ A^{\alpha}}{(A^{\alpha} + B^{\alpha})} $$ Where \( A \) and \( B \) represent team performance and \( {\alpha} \) controls sensitivity.
In our case, we replace runs with in-game resources: gold and experience. These capture economic and level progression. By applying the same formula frame by frame (minute by minute) through a match timeline, we translate shifting gold and XP totals per team into an evolving win probability curve, which we can then visualise.
We can take these probabilities and see the ebbs and flows throughout a game. This is what we define as Momentum Impact, which looks at the delta of current win probability in a given minute and the previous minute.
Match Event Visualization
Where things happen can be just as insightful as what has happened. That’s why we have included a heatmap that allows our user to do spatial analysis of each of their games. To achieve this, we have used a Kernel Density Estimation (KDE) to visualise player movement and positioning across the map.
We do this by transforming discrete player locations into a continuous probability surface. The resulting heatmap highlights ‘hot’ zones, where players have spent the most time or had the highest activity density. Red regions represent strong presence, whereas blue areas represent less activity. The goal is to identify tendencies such as: lane focus, roaming patterns or control zone within one visual.
How we built it
Backend data ingestion
AWS Amplify Lambda functions call the Riot API to fetch a player’s most recent matches and then retrieve each match’s match summary and timeline.
Each function first checks S3 for an existing object; network calls to Riot are made only when the match data is not already cached.
Responses are validated and normalised on ingestion so downstream systems see a consistent shape for frames, events, and participant stats.
Data Compacting and Feature Extraction
- Implemented a data compactor that consumes raw match summary and timeline data and extracts minute‑level features: team gold, XP, Creep Score, and aggregates events player was involved in per minute
- Computed win expectancy per minute, and used this to derive Momentum Impact as the discrete difference \( \Delta P_{t} = P_{t} - P_{t-1} \)
- The compactor outputs a compact JSON designed for fast rendering and for being directly fed into LLM prompts. This file is also cached in an S3 bucket to avoid recalculations for a match.
Frontend visualization and interaction
The dashboard links a Win Probability Timeline, Momentum Impact Chart, event overlay and an interactive map visualiser.
Player positions and event points are transformed to be displayed as an overlap on top of the Lol map. Event rendering supports per‑category toggles, so users can show/hide Champion Kills, Assists, Objectives, etc.
A KDE heatmap layer converts discrete positions into a continuous density surface and is composited over the map with adjustable smoothing and opacity to reveal lane focus, roaming corridors and objective control zones.
The frontend is built with React + TypeScript, using Framer Motion for animation and Recharts for data visualization. All components are designed to be modular and reactive to live data updates.
Accomplishments that we're proud of
- Creating a visually appealing view of LoL match timeline data which gives users unique insights into their performance within a game and across multiple games
- Creating a simple and scalable process for extracting and summarising data to minimise the token count of a prompt fed to LLMs
- Making intelligent use of S3 buckets to cache expensive data extraction and summarisation steps to improve the user experience by reducing wait time
Challenges and What we learned
How to apply data summarisation and analysis techniques to LoL match timeline data
How to summarise data effectively to minimise the token count for prompts
Extracting and summarising data from multiple match timelines took time, and so we processed multiple games in the background and used S3 buckets to cache summarised data
What's next for the Match Momentum Dashboard
Add automatic minute ranking: present the top 3 “most impactful minutes” per match as coaching highlights with the recommended tactical focus.
Enhanced LLM Insights: Create insights on a play-by-play basis, so a user can get more specific feedback on better options when in a particular part of the map at a certain time
Team-level and role-level breakdowns so coaches can see whether certain lanes or champion types are driving momentum.
Aggregate over many matches to expose player tendencies (e.g., “this player tends to lose control around minute 12 due to objective timing”).
Comparative Analytics: Allow players to compare their momentum profiles against pros or specific roles (e.g., how do top-laners sustain momentum past 10 minutes?).
Built With
- bedrock
- kde
- react
- riot-games
- s3
- typescript

Log in or sign up for Devpost to join the conversation.