-
-
01_hook
-
02_problem
-
05_watcher
-
03_intro
-
06_analyst
-
04_discovery
-
07_advisor
-
10_close
-
08_executor
-
09_selfobserve
Inspiration
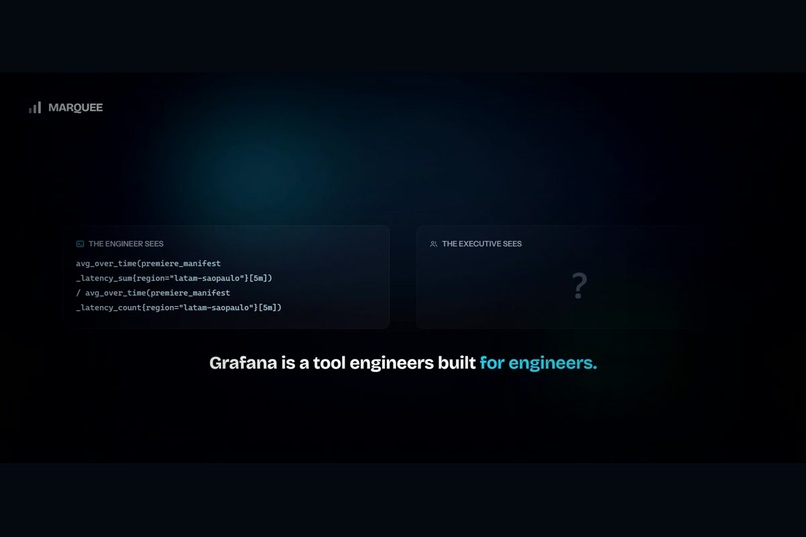
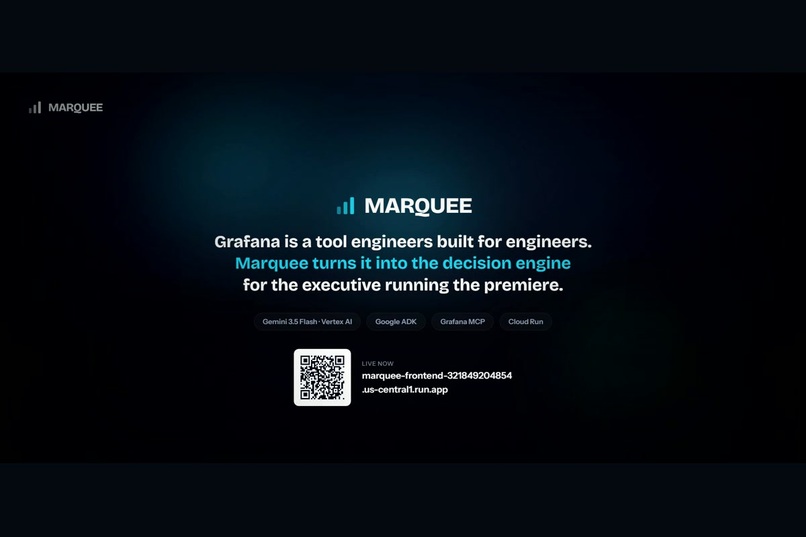
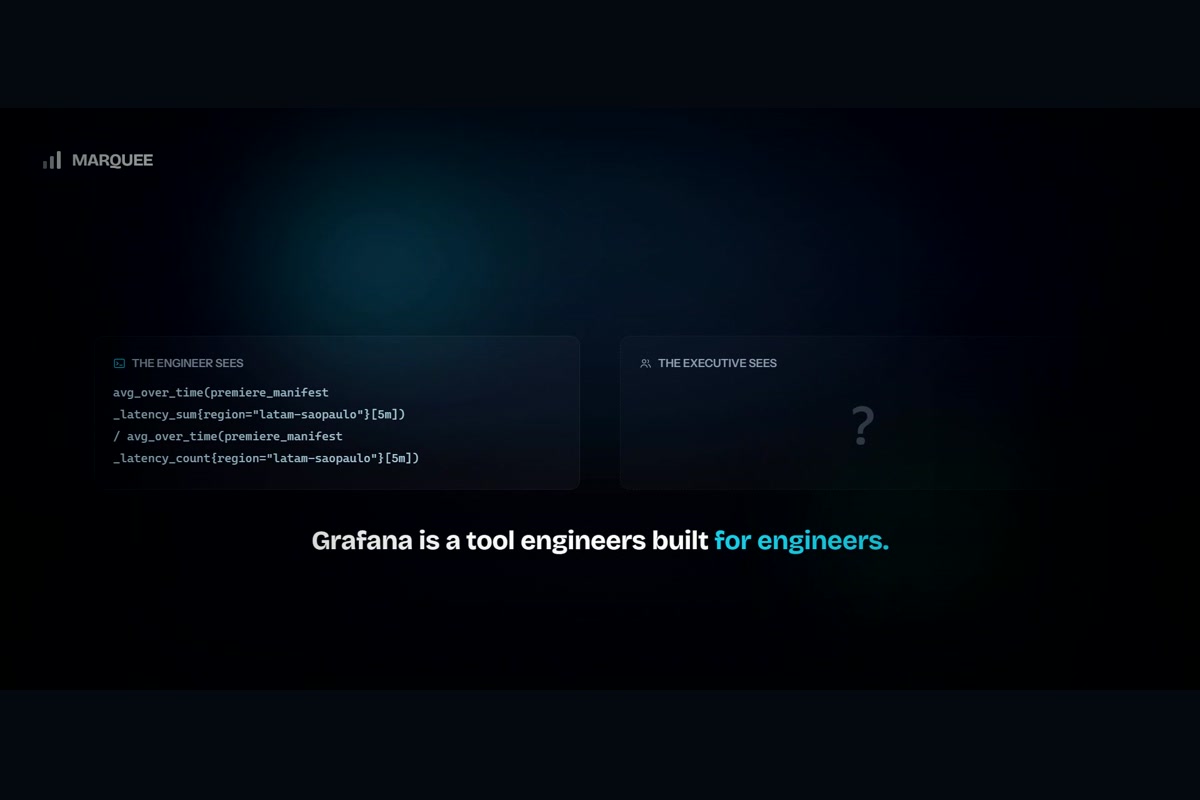
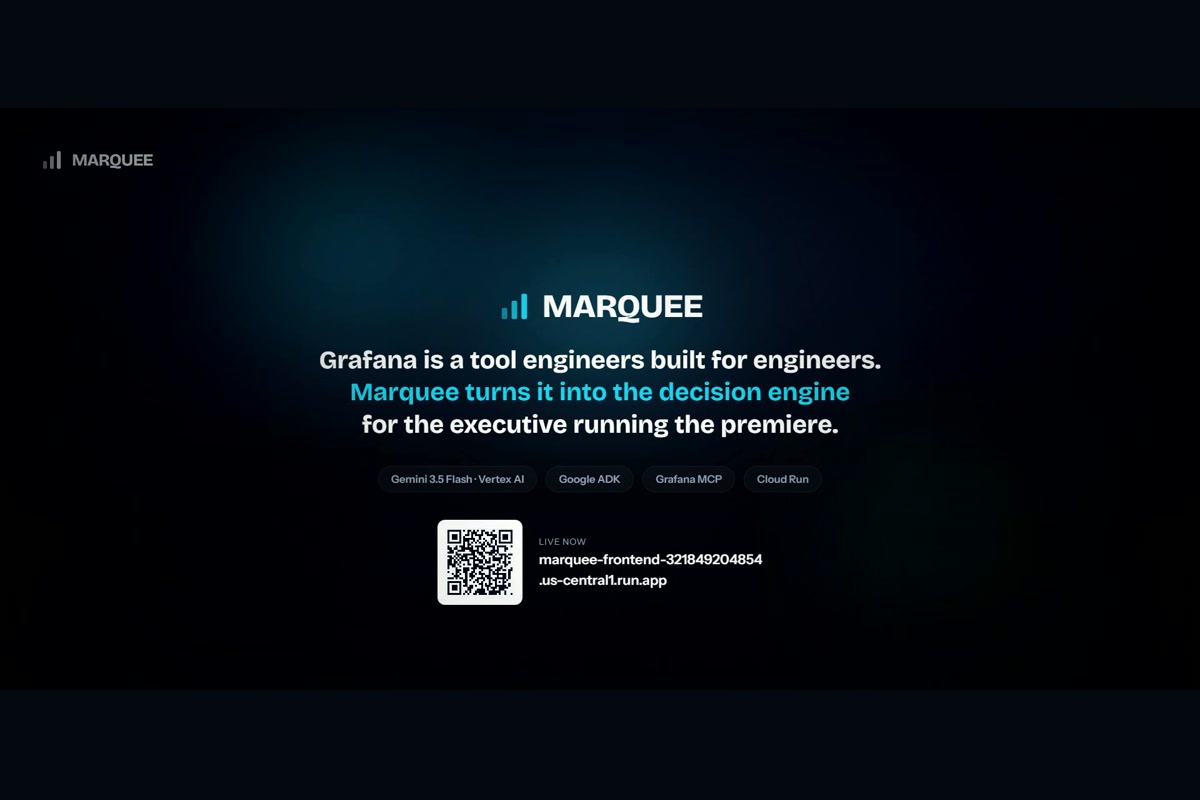
Grafana is a tool engineers built for engineers, and it is very good at that. But during a
global premiere the person who has to decide whether to fail over the CDN, eat the cost of
a bitrate downgrade, or go public with an apology is not an SRE. That person opens a
dashboard and sees avg_over_time(premiere_manifest_latency_sum{region="latam-saopaulo"}[5m]).
Every observability tool on the market speaks to the engineer. None of them speak to the person deciding whether to pull the film. That gap is what Marquee closes.
What it does
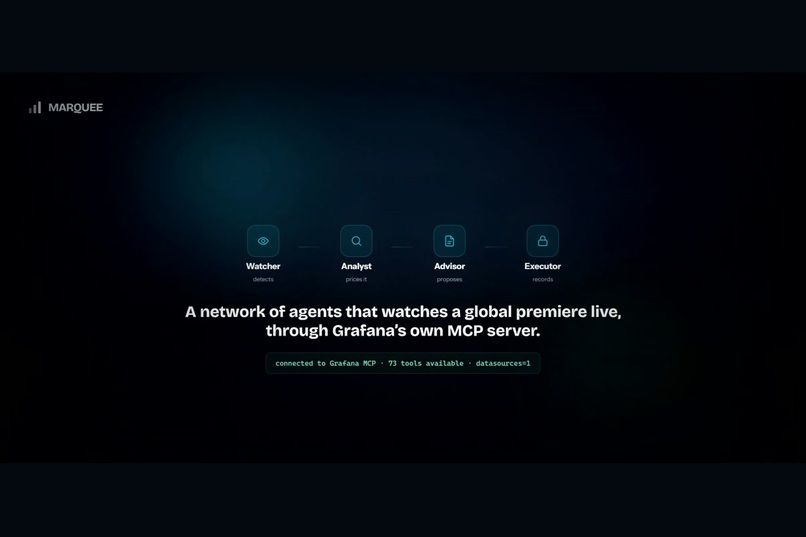
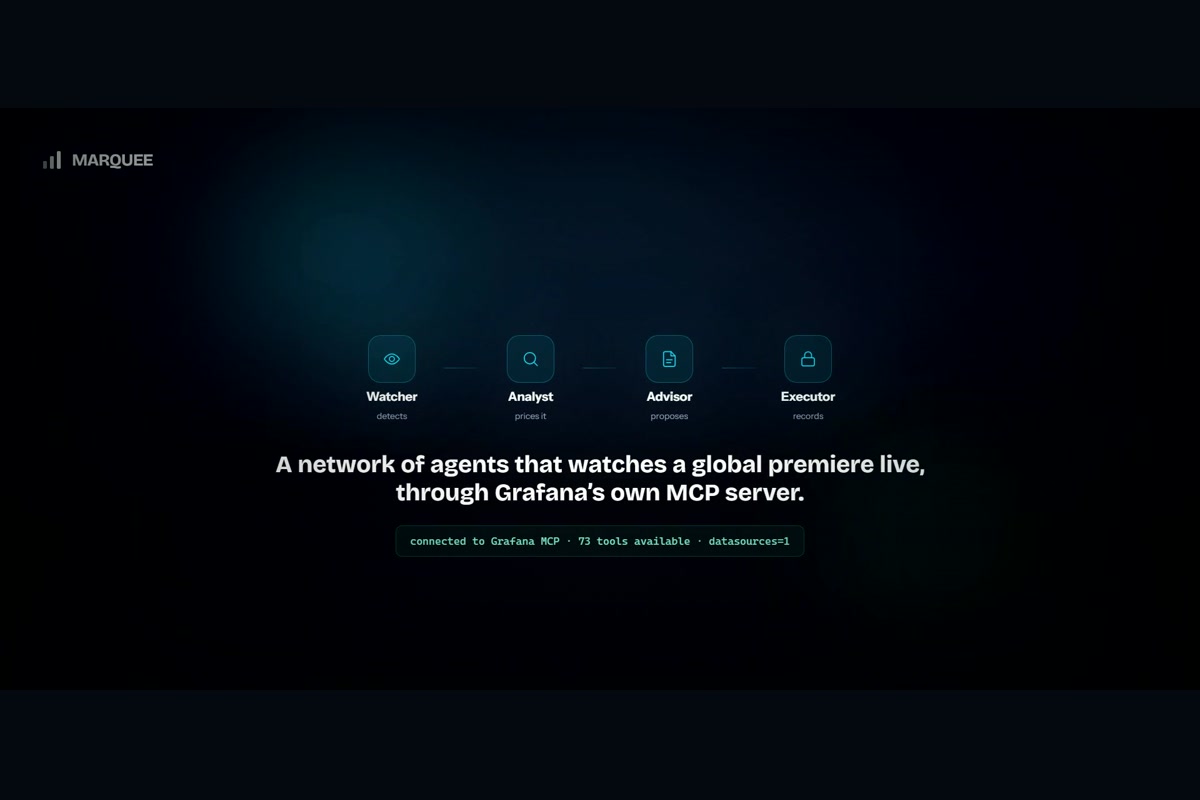
Four agents, chained by the Google Agent Development Kit, watch a live premiere through Grafana Cloud's MCP server:
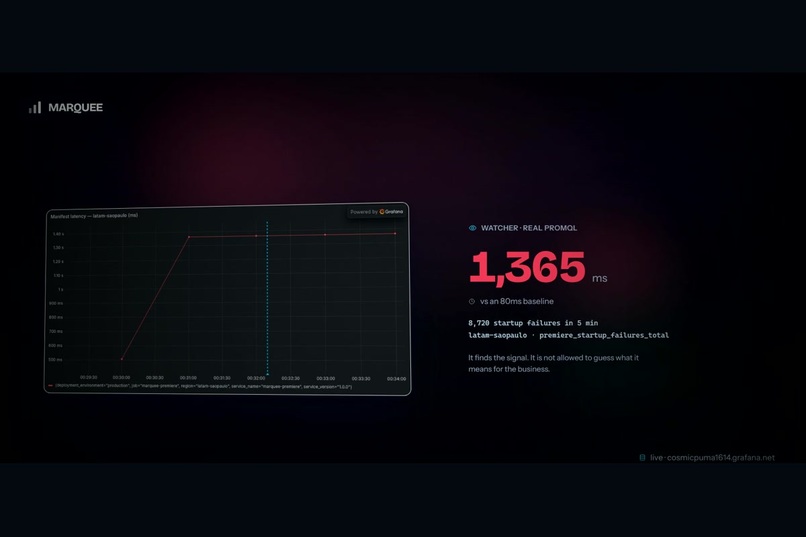
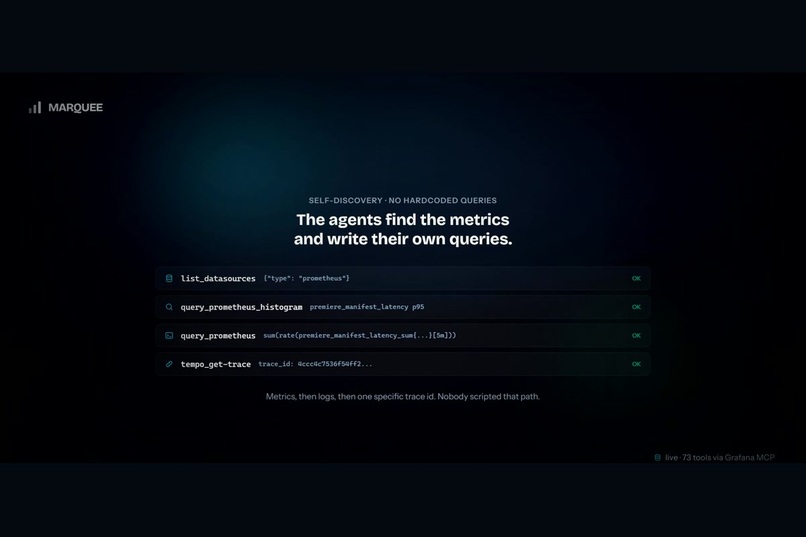
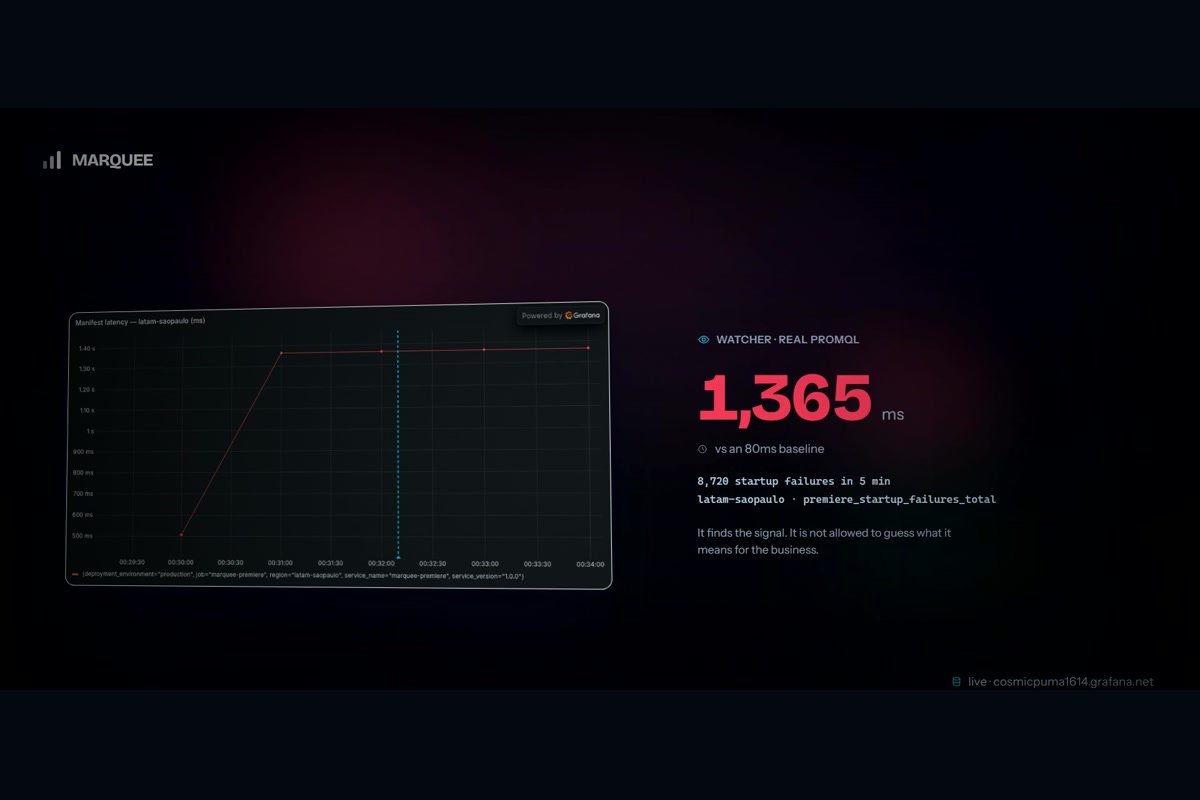
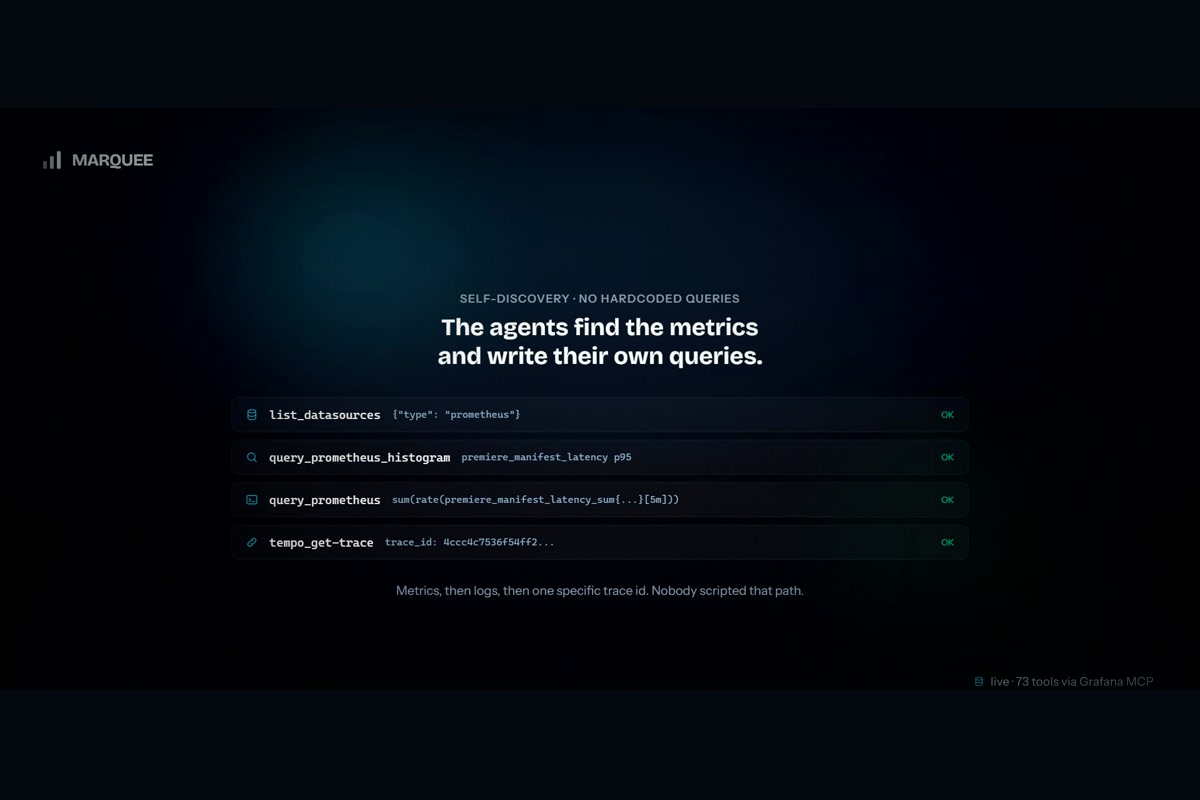
- Watcher discovers the datasources, finds the metric names itself and writes its own
PromQL. In our recorded run it reached for
query_prometheus_histogramwithout being told the tool existed. - Analyst goes from metrics to Loki logs to one specific Tempo trace by id, then calls a deterministic pricing function with the live affected-viewer count.
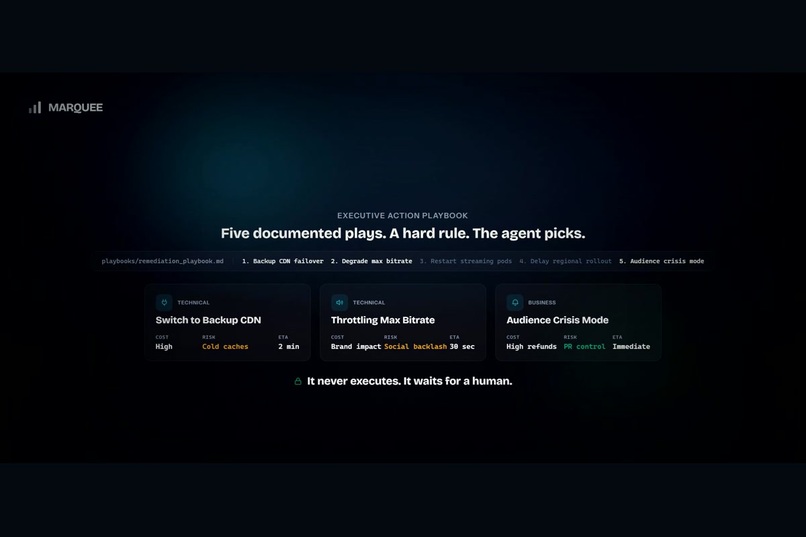
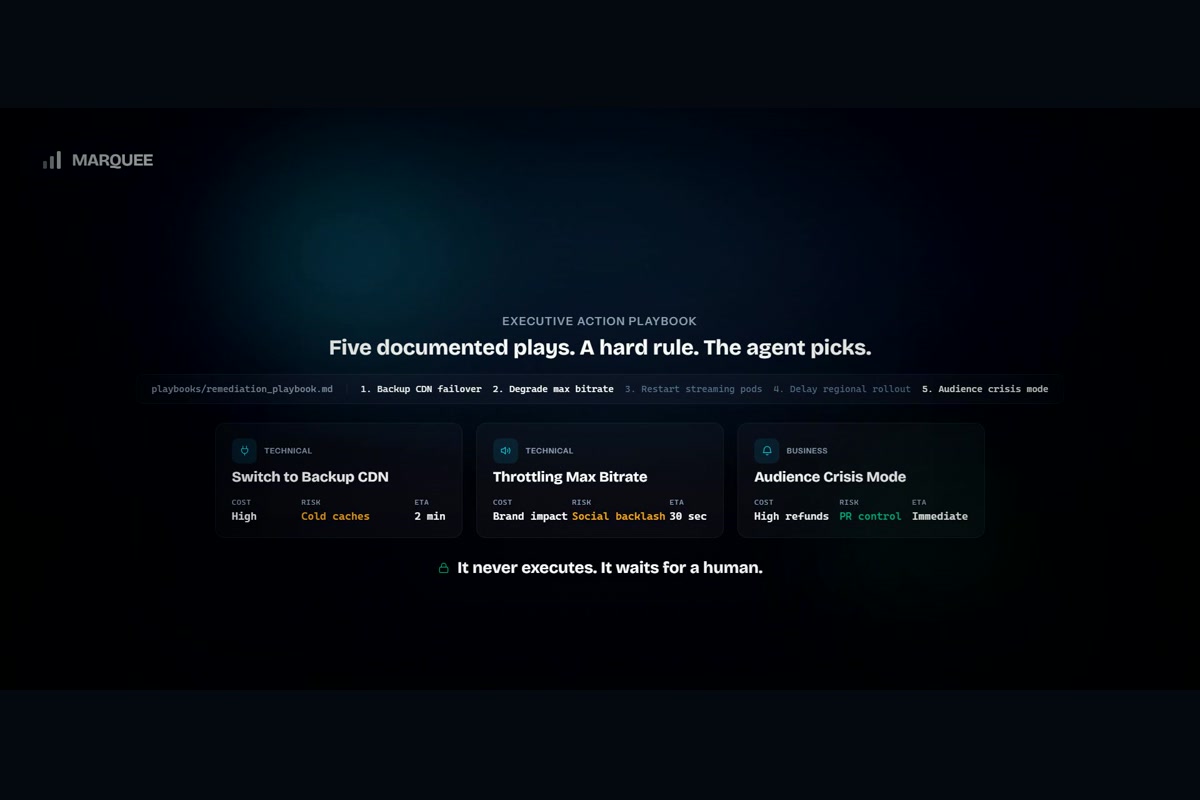
- Advisor reads a five-play remediation playbook and returns structured options with cost, risk and time to effect. It has no tools at all. It cannot act.
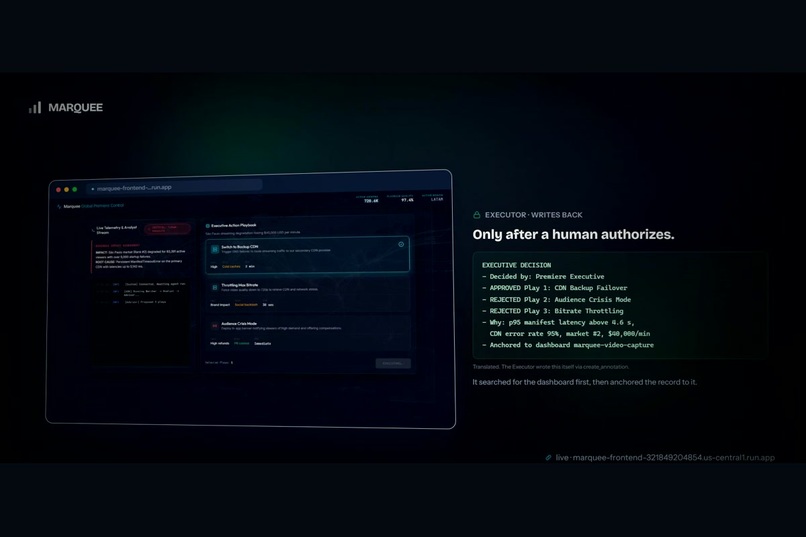
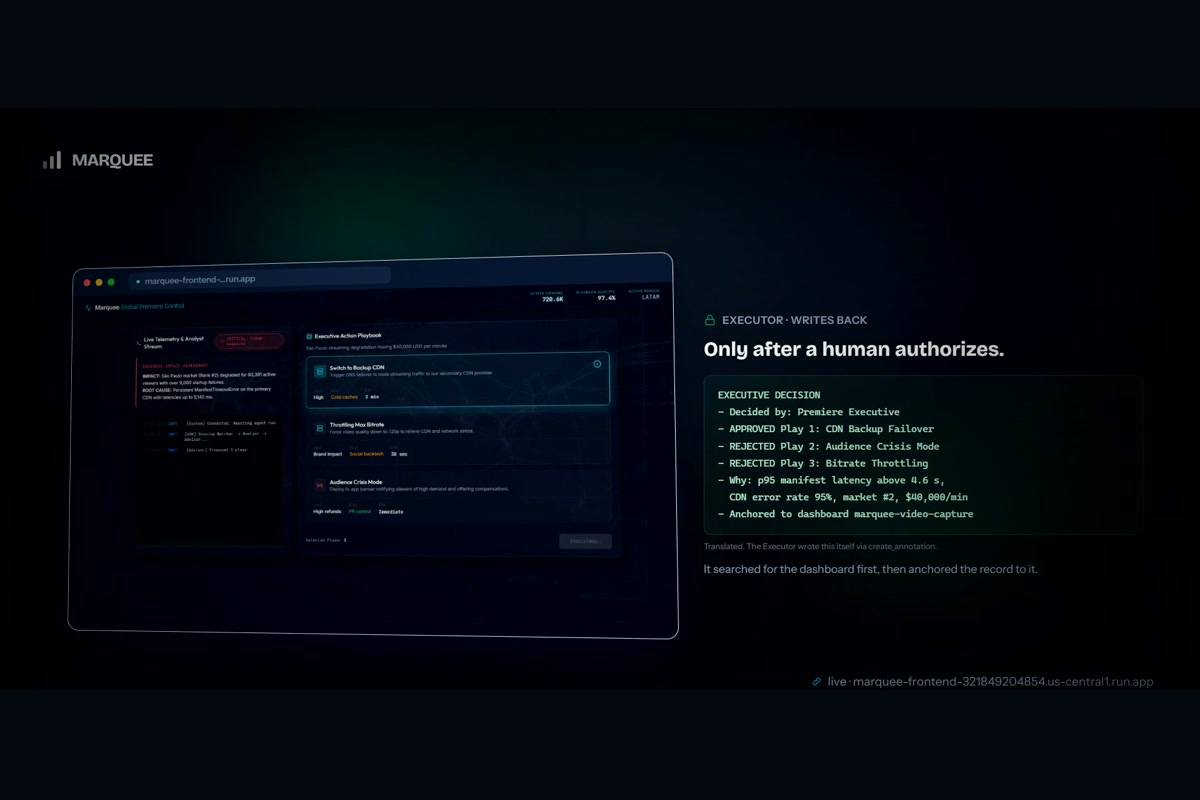
- Executor is the only agent that can write, and it never runs until a human picks a play. Then it records who decided, what they chose, and what they rejected, as an annotation anchored to the same dashboard the engineers already trust.
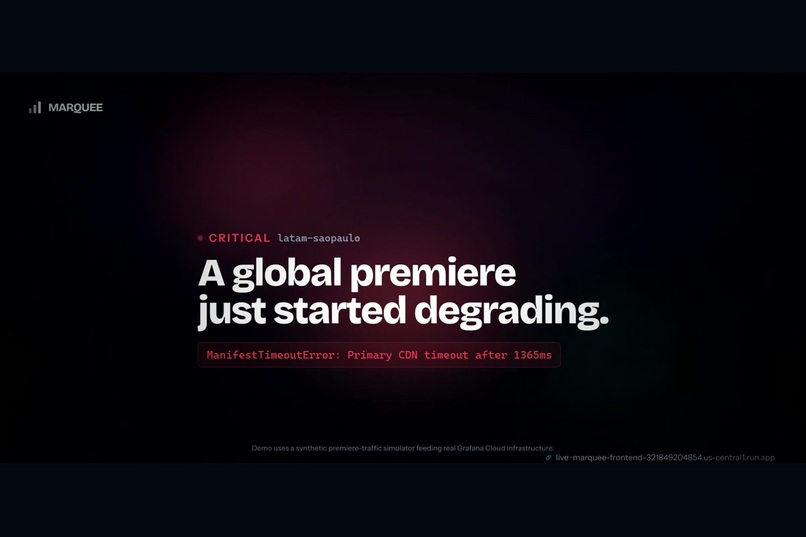
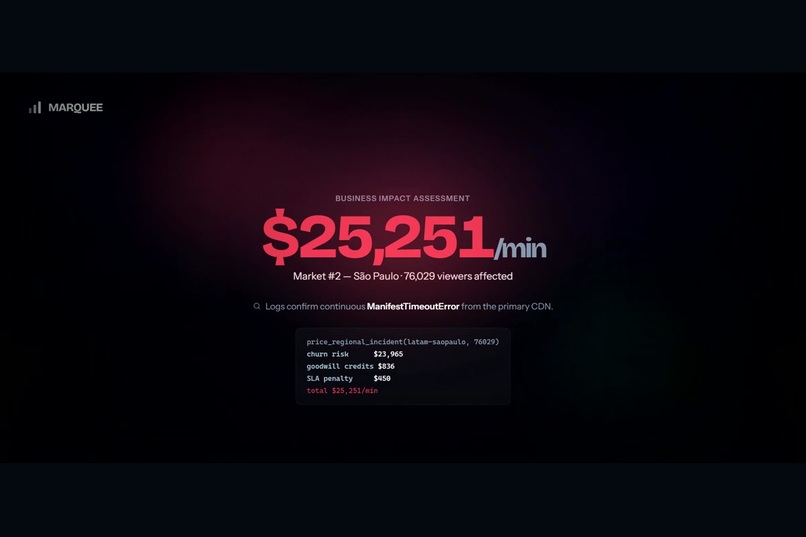
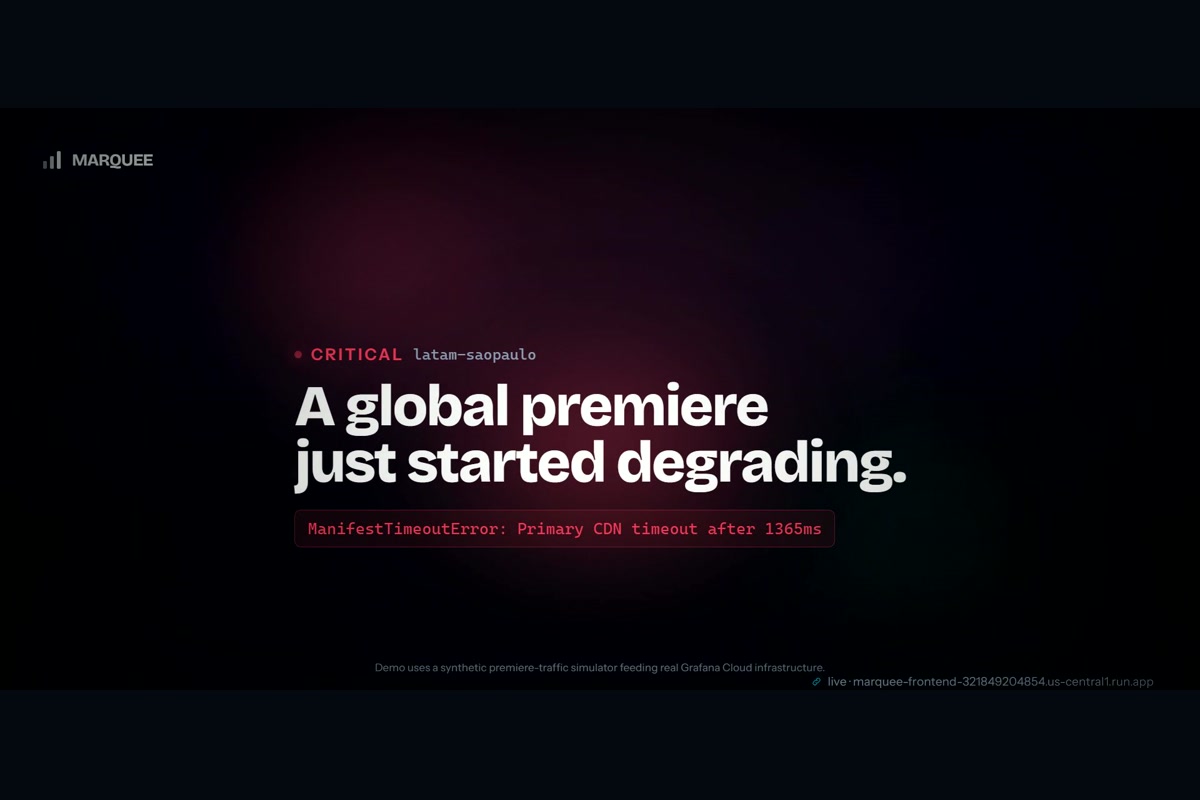
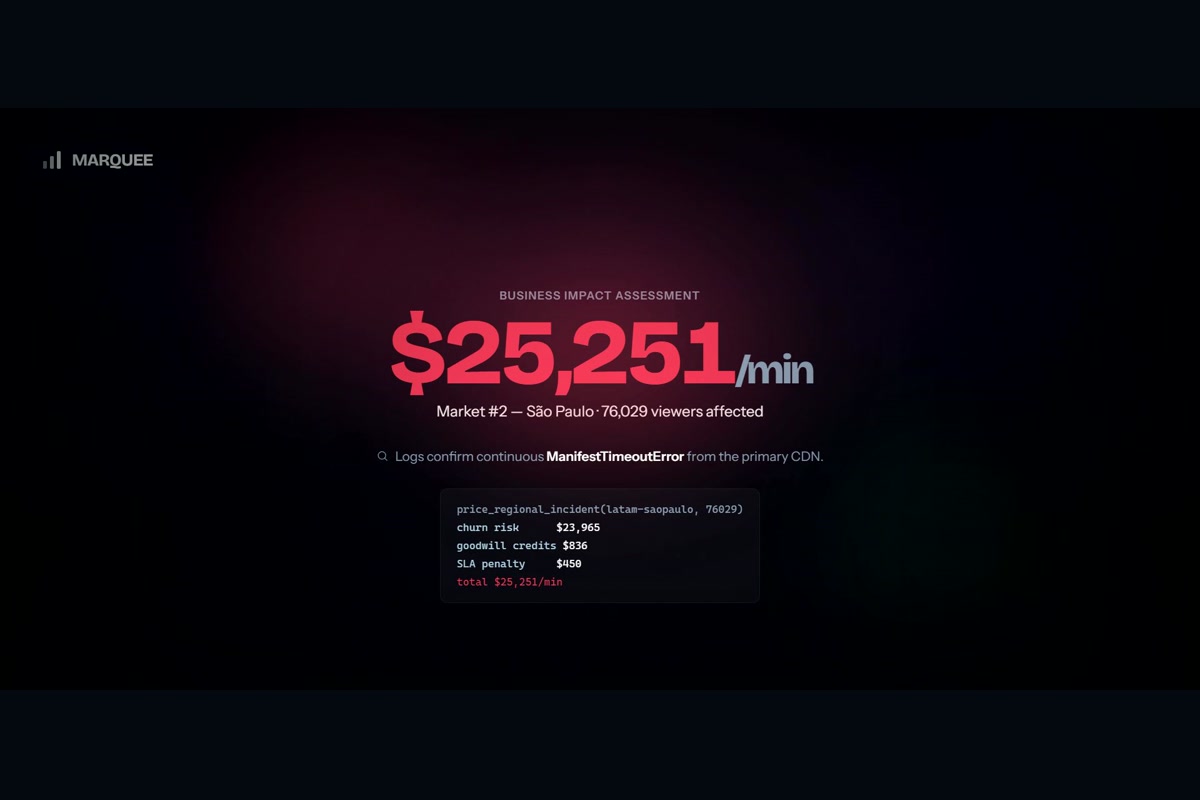
The output is not an alert. It is a priced decision: 76,029 viewers affected in market #2,
$25,251 per minute, with the breakdown that produced it.
How we built it
The orchestration is a real ADK SequentialAgent. Watcher, Analyst and Advisor are chained
with output_key, so each one's output lands in shared session state and the next reads it
by template. The Executor sits deliberately outside that chain: putting it inside would turn
it into one more automatic step, which is exactly what this project claims not to do.
The business model is the part we are most pleased with. It started as a lookup table with
revenue_risk_per_min: 40000 per region, which means the system reported the same number
whether a hundred viewers were affected or a hundred thousand. That is precisely the
distinction an executive needs. It is now a function the Analyst calls as a tool, composing
churn risk, goodwill credits and contractual SLA penalty from the live viewer count. The
assumptions live declared in market_model/config.yaml so anyone can argue with them.
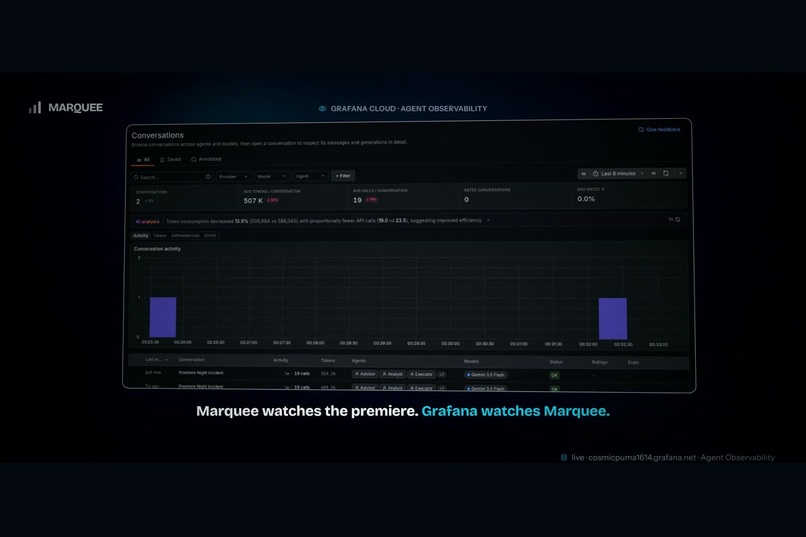
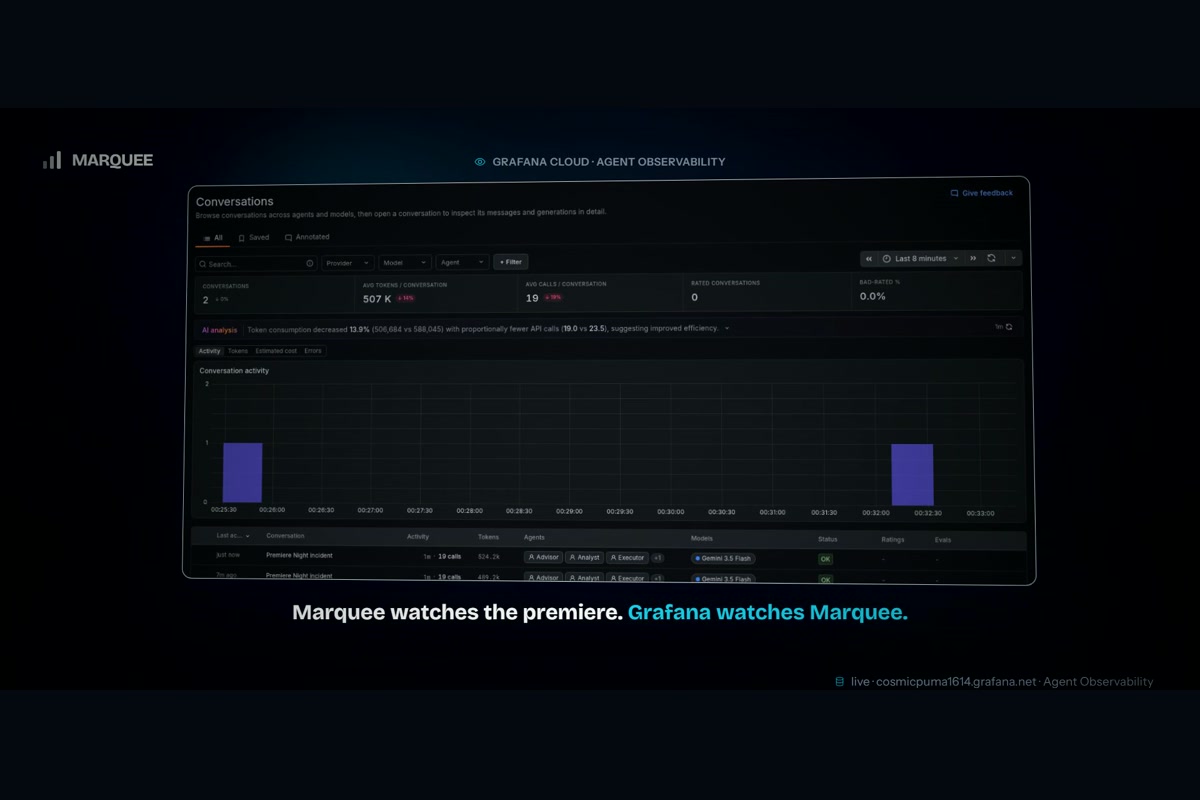
Agent telemetry goes to Grafana's own Agent Observability through the agento11y SDK plus
OpenTelemetry gen_ai.* spans. Marquee watches the premiere. Grafana watches Marquee.
Challenges we ran into
We audited our own pitch and it did not hold. We had written "orchestrated with Google's
Agent Development Kit" in the demo. Then we grepped the repo: there was no Runner anywhere,
only .instruction was being read off the Agent objects, and the model was called directly
through google-genai. ADK was a container for prompt strings. We rewrote it properly. The
interesting part is that real orchestration produced a visibly better product, which is how
we knew the fix was not cosmetic.
A byte-order mark took down production. The deployed backend returned 500 with "tool not
found, available tools: (empty)", and ADK helpfully suggested the model had hallucinated the
tool name. The real cause was in the Cloud Run logs: invalid Grafana URL ?https://.... Our
deploy script wrote secrets with [System.Text.Encoding]::UTF8, which in PowerShell emits a
BOM. Every secret in Secret Manager had an invisible character in front of it, mcp-grafana
died on startup, and the toolset came back empty. Locally it never showed, because locally
the .env is read directly.
Gemini 3.5 Flash does not exist in regional endpoints. It returns 404 in us-central1,
us-east5 and europe-west4, and 200 on global. That single line in the deploy script
would have broken every model call in production.
Our audio pipeline was silently dropping the gaps between scenes. ffmpeg's concat
demuxer takes its stream parameters from the first file and assumes the rest match. Our
scene files were MP3 with a .wav extension while the silence files were real PCM, so the
silences were discarded without a single error. The timing metadata still counted them, so
picture and subtitles drifted almost three seconds by the end of the film.
Accomplishments that we're proud of
Nothing in the demo is hardcoded any more. The plays, the headline, the impact statement and the root cause are all written by the agent. The header metrics come from Prometheus. We removed a fabricated log stream that used to write itself on page load.
And the safety property is enforced by structure rather than by intention: the analysis chain carries no write tools, and there is a test that fails if anyone ever adds the Executor to the automatic chain. That is the kind of regression that produces no visible error at all.
What we learned
The most valuable test we wrote is not about correctness, it is about architecture. Five lines
that assert the Executor is not in the SequentialAgent. Human-in-the-loop is easy to say in a
pitch and easy to lose in a refactor.
We also learned to be suspicious of our own claims. Twice we described the system as doing something it did not quite do, and both times a two-minute grep settled it.
What's next for Marquee
Validation against a real production incident rather than a declared traffic simulator. The pricing parameters are reasoned business assumptions, not measured data, and the obvious next step is fitting them to actual churn observed after a real outage.
Built With
- cloud-run
- docker
- flask
- gemini
- google-adk
- google-cloud
- grafana
- grafana-cloud
- javascript
- loki
- mcp
- model-context-protocol
- opentelemetry
- pytest
- python
- react
- vertex-ai
- vite

Log in or sign up for Devpost to join the conversation.