-
-
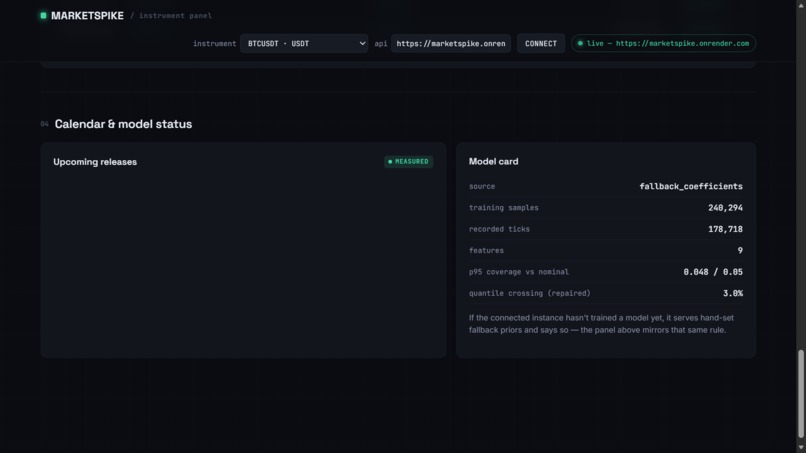
Live Mode
-
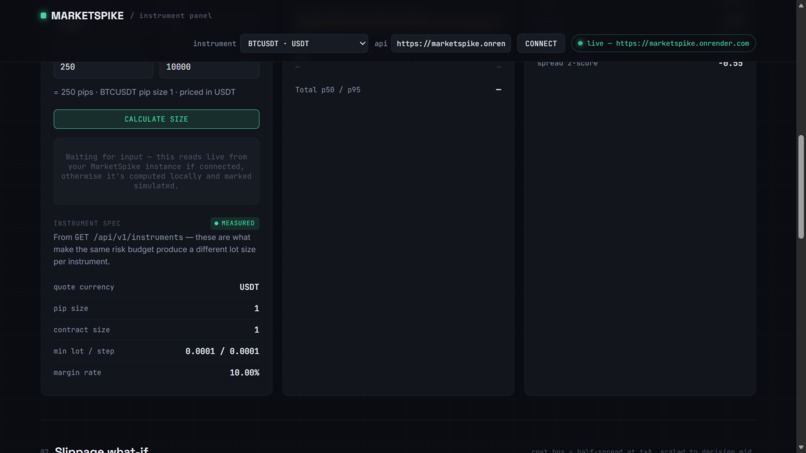
Live Mode
-
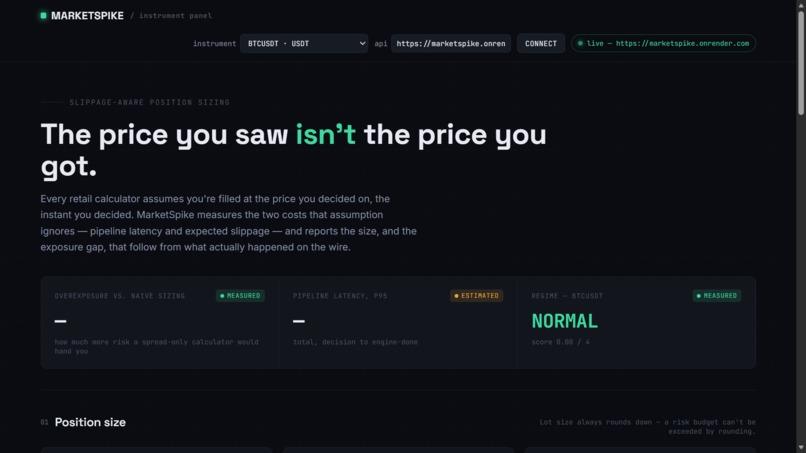
Live Mode
-
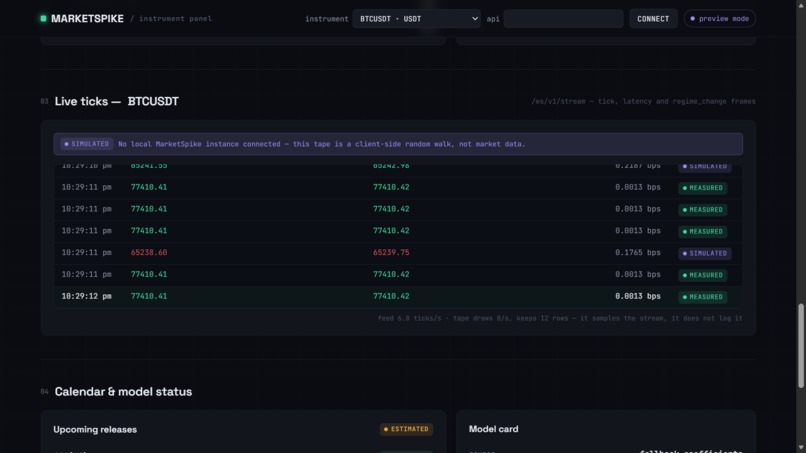
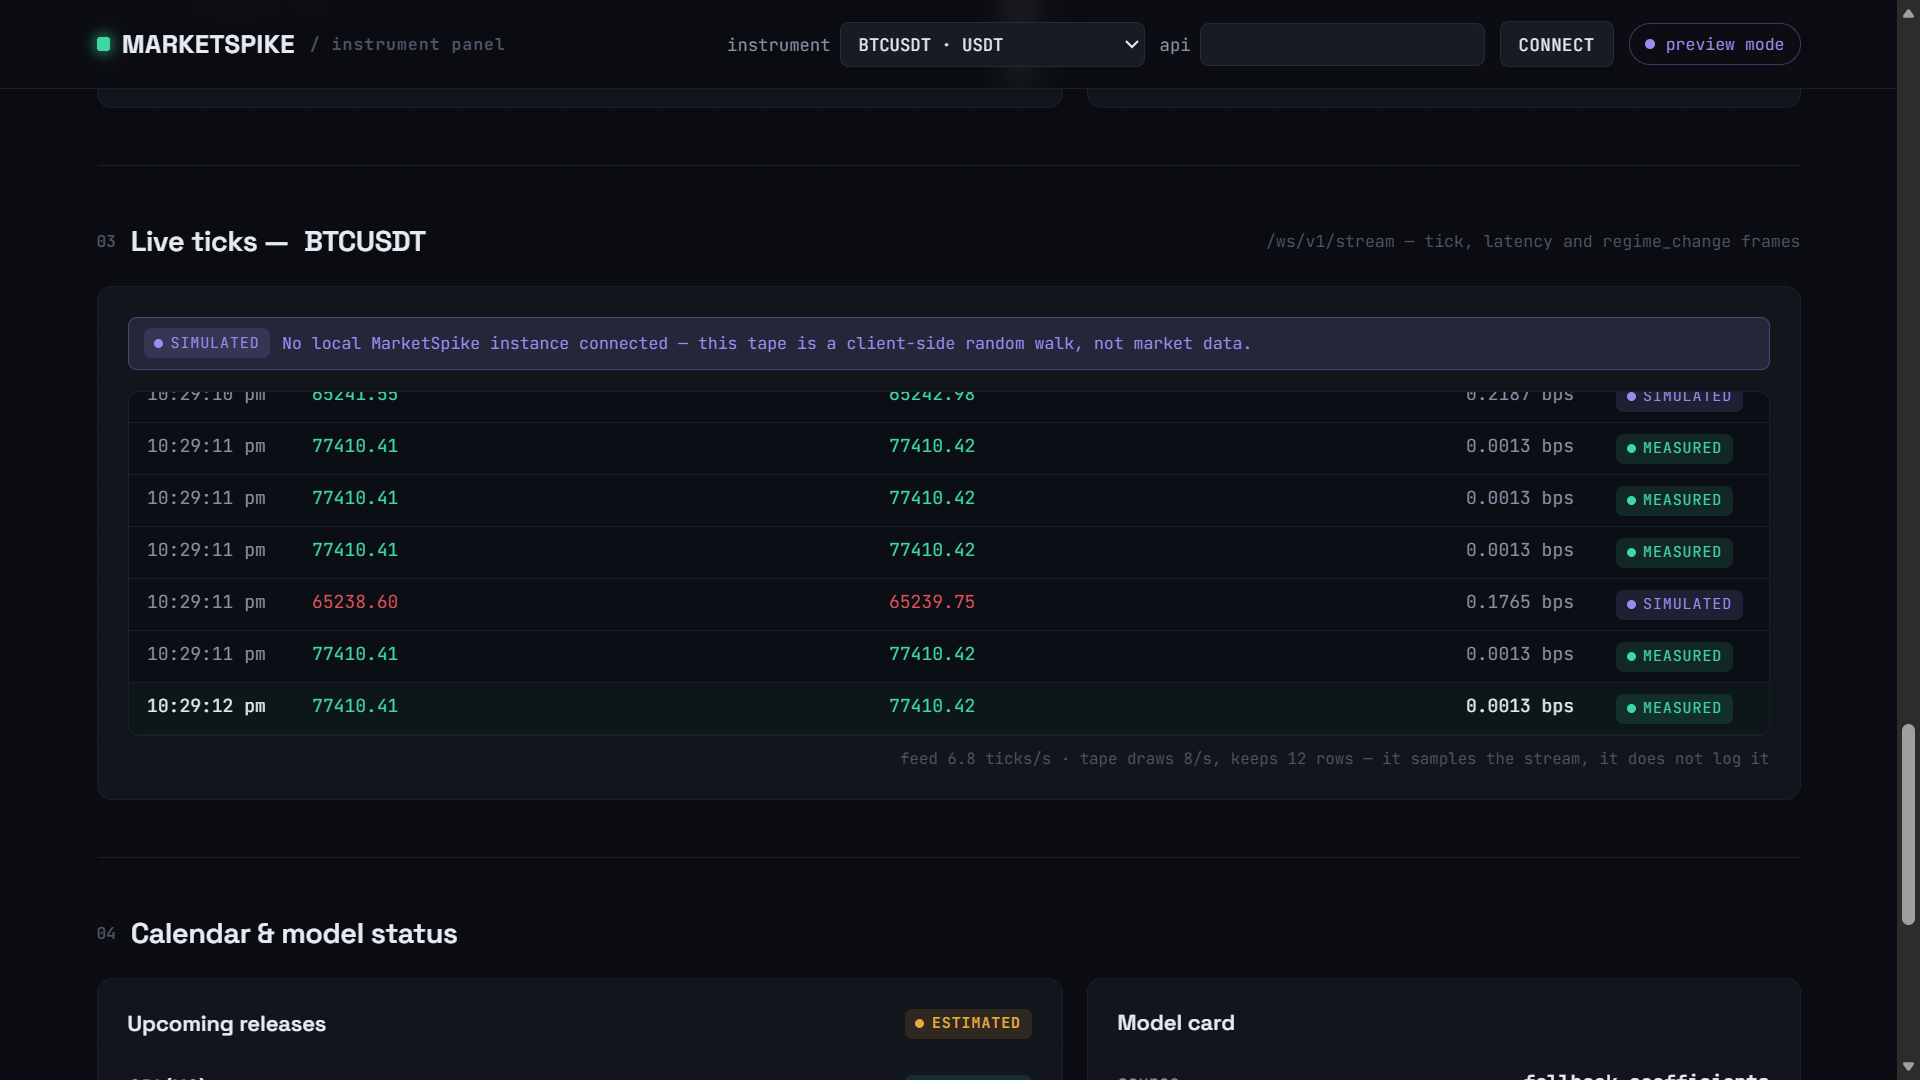
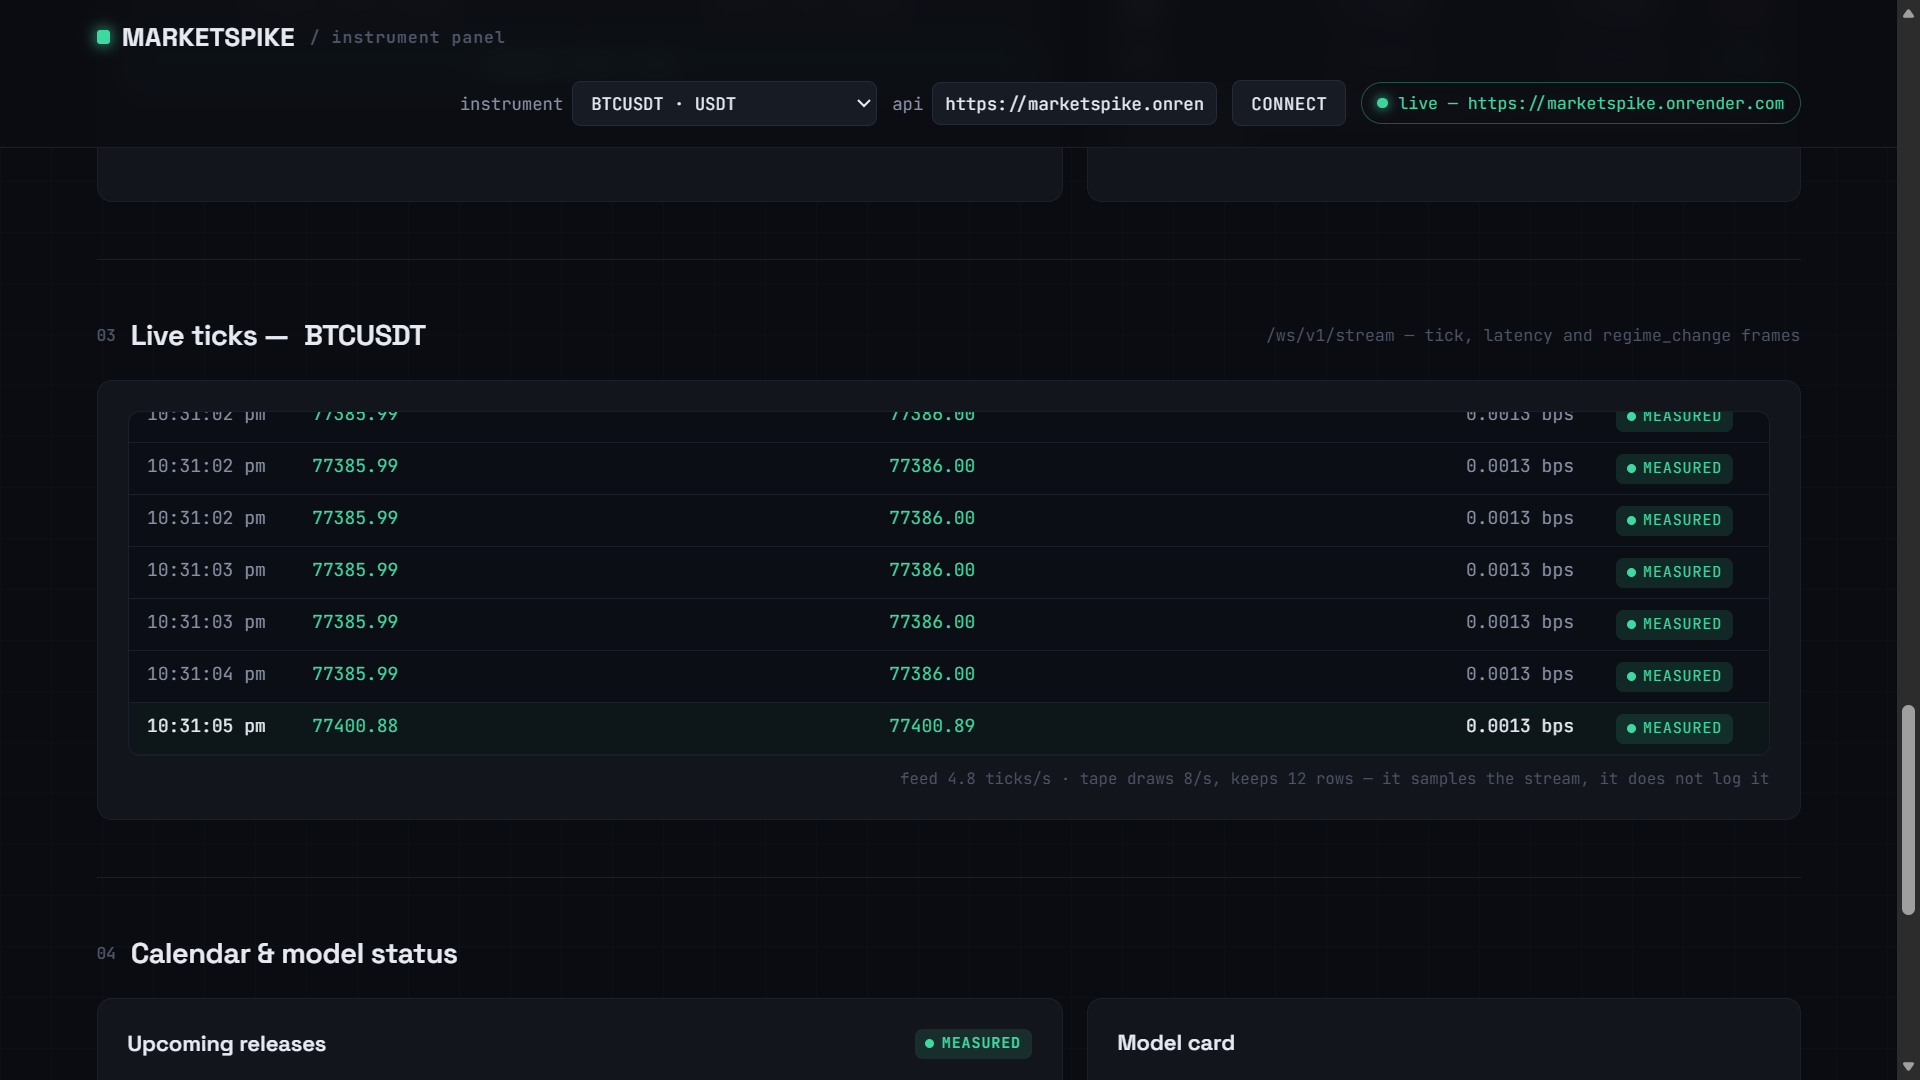
Preview Mode: Live ticks
-
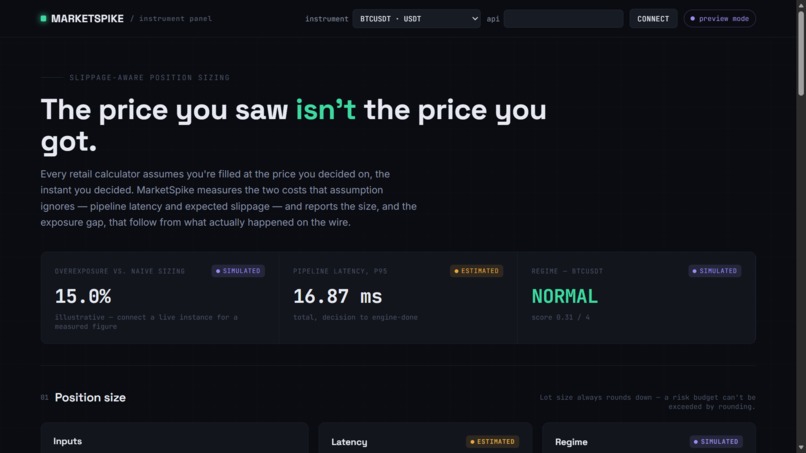
Preview Mode: API connection, Live status, connect button
-
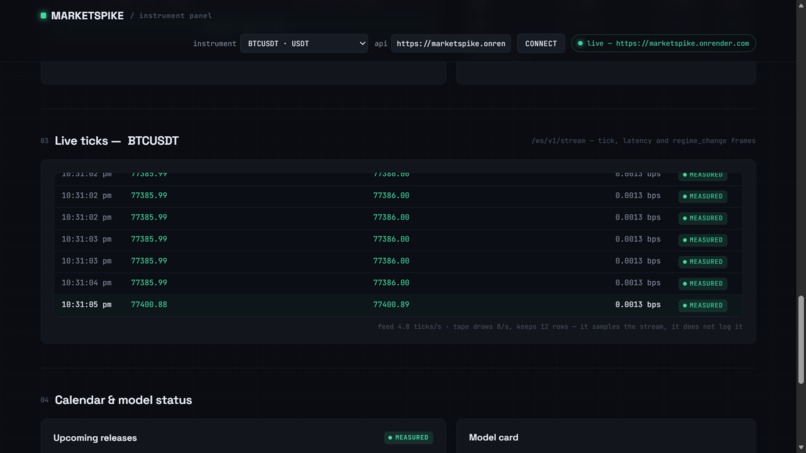
Live Mode
-
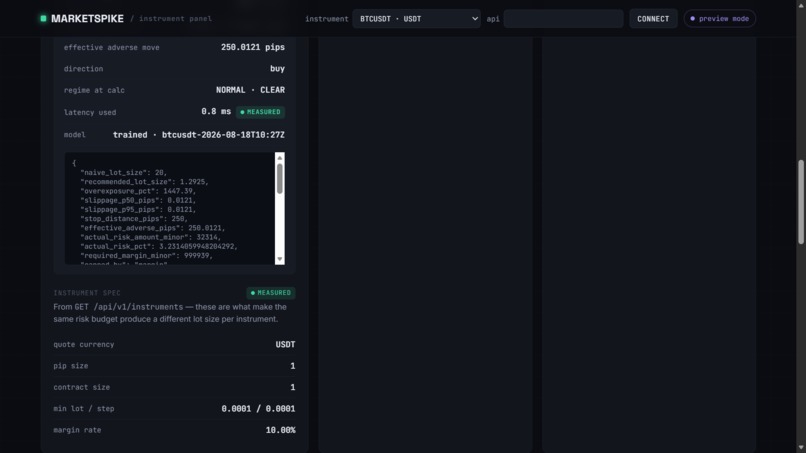
Preview Mode:
-
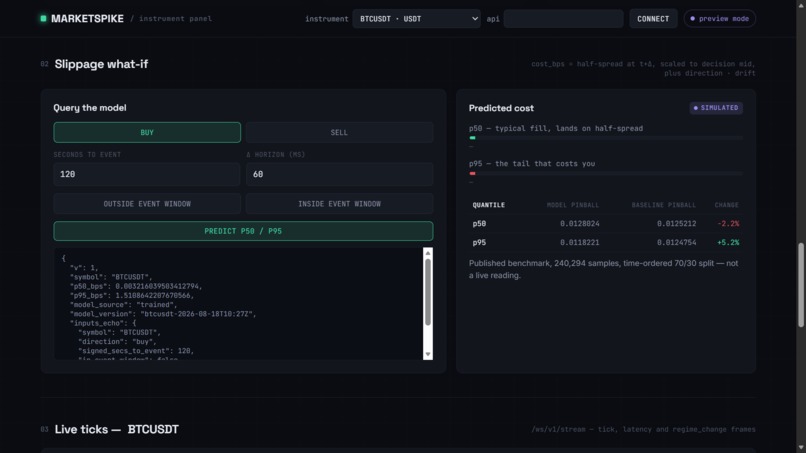
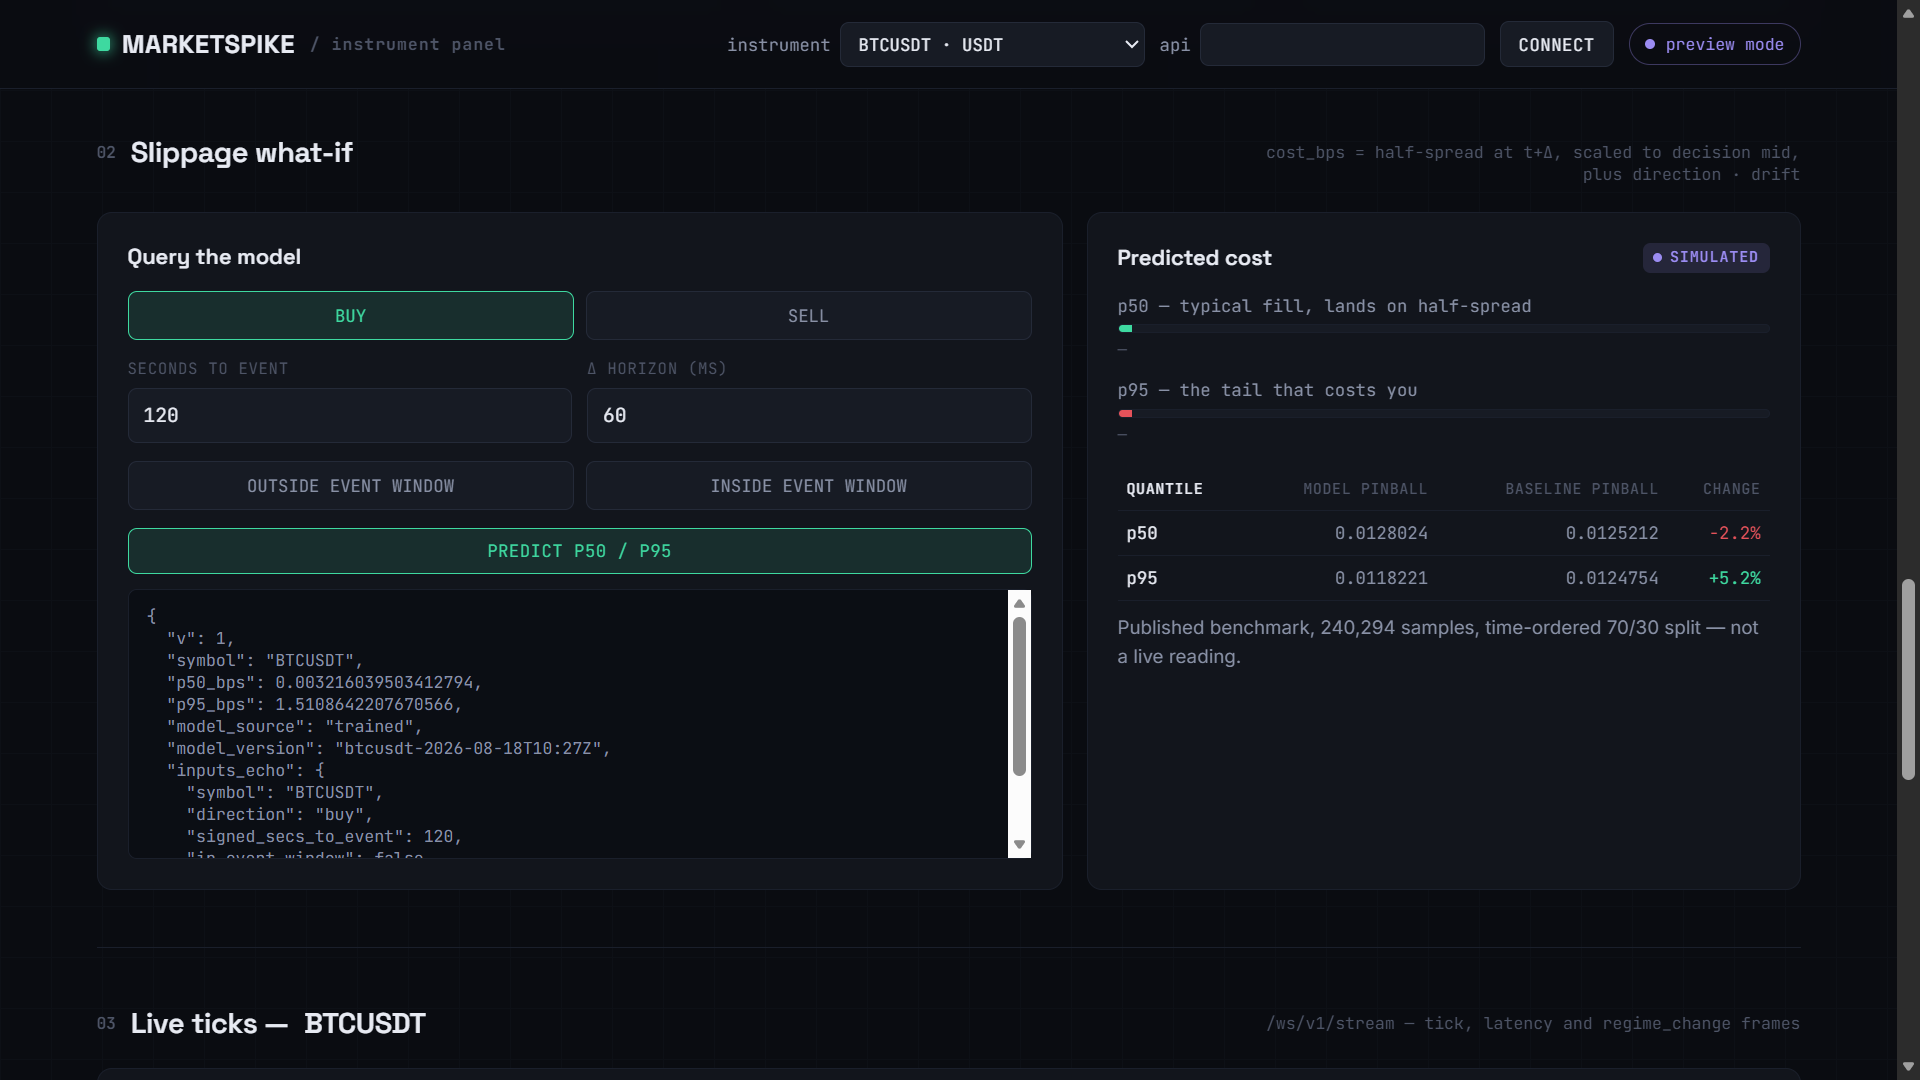
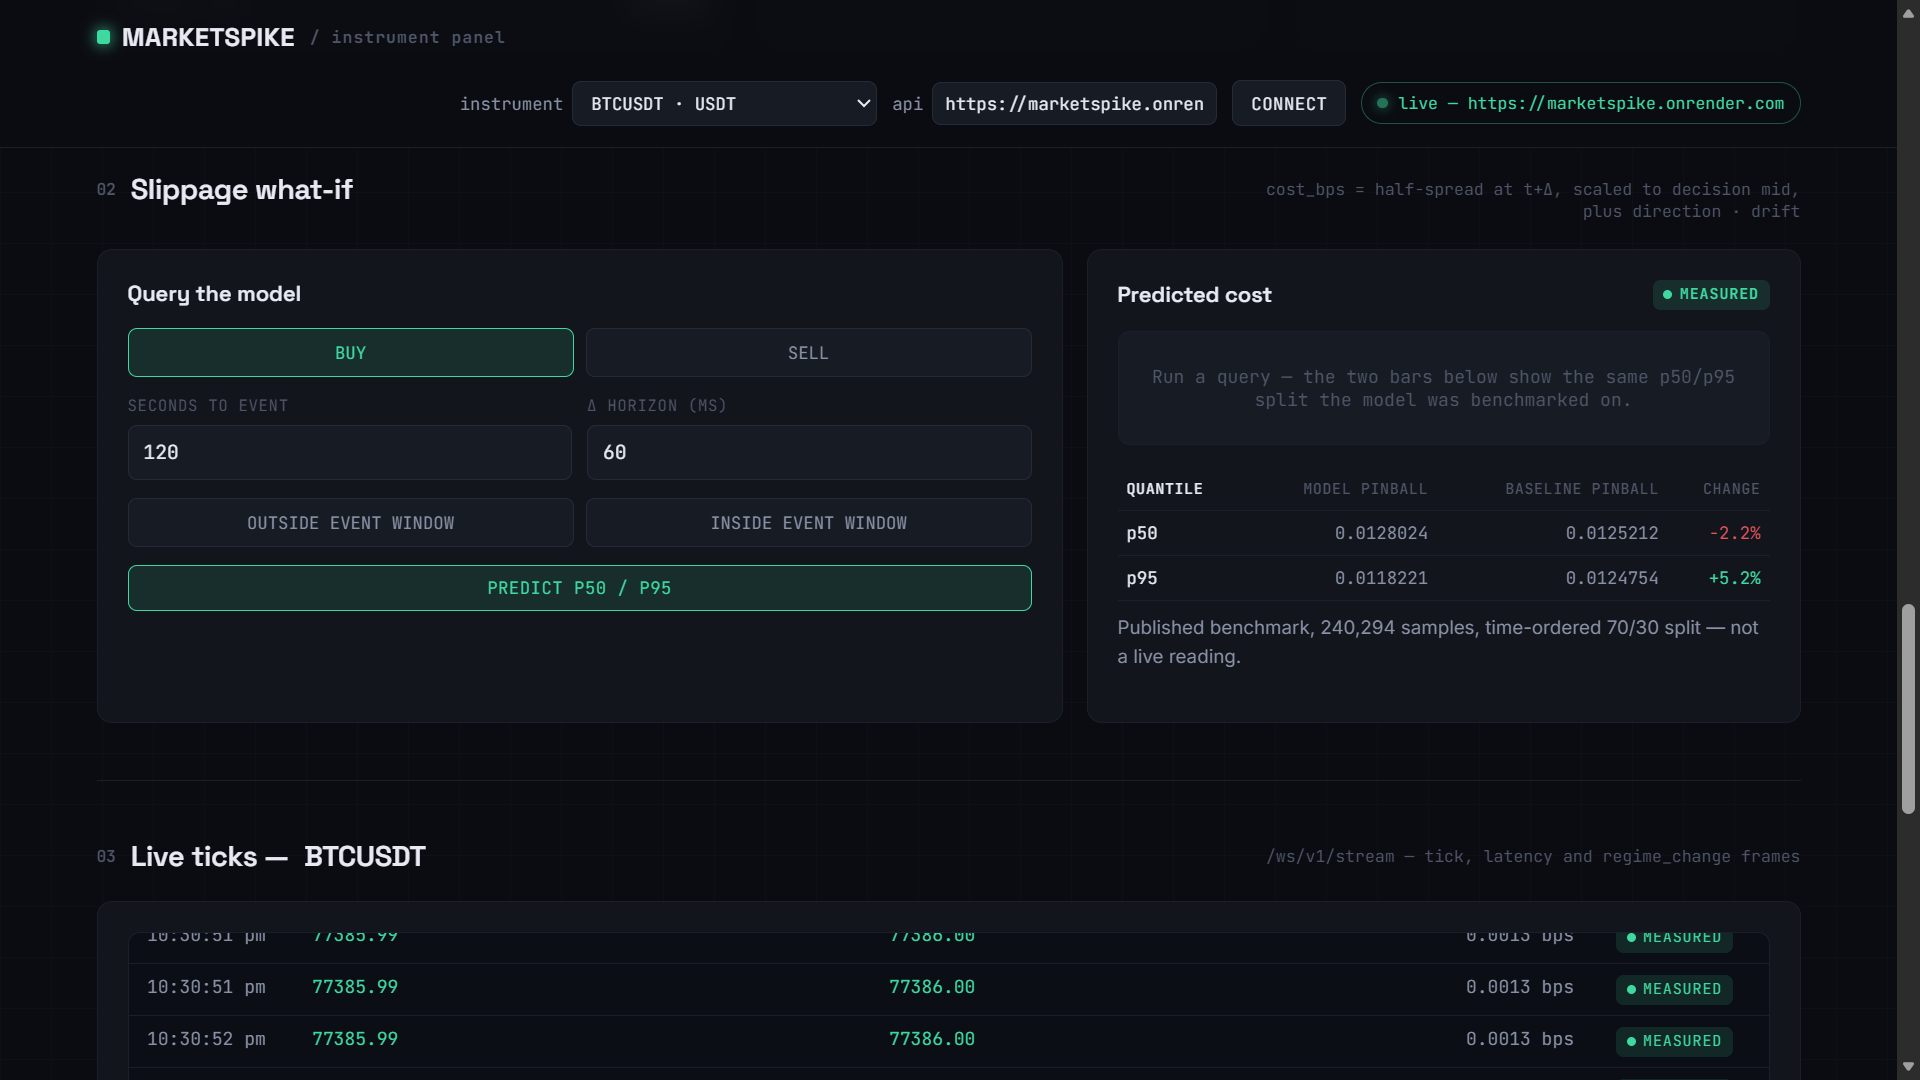
Preview Mode: Slippage prediction
-
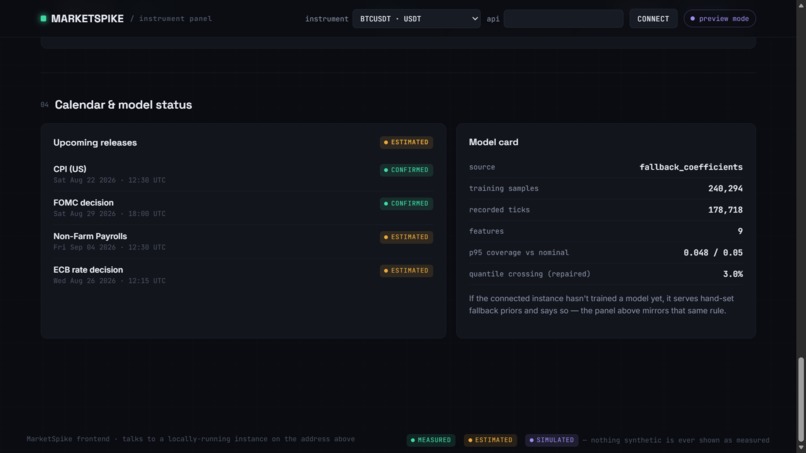
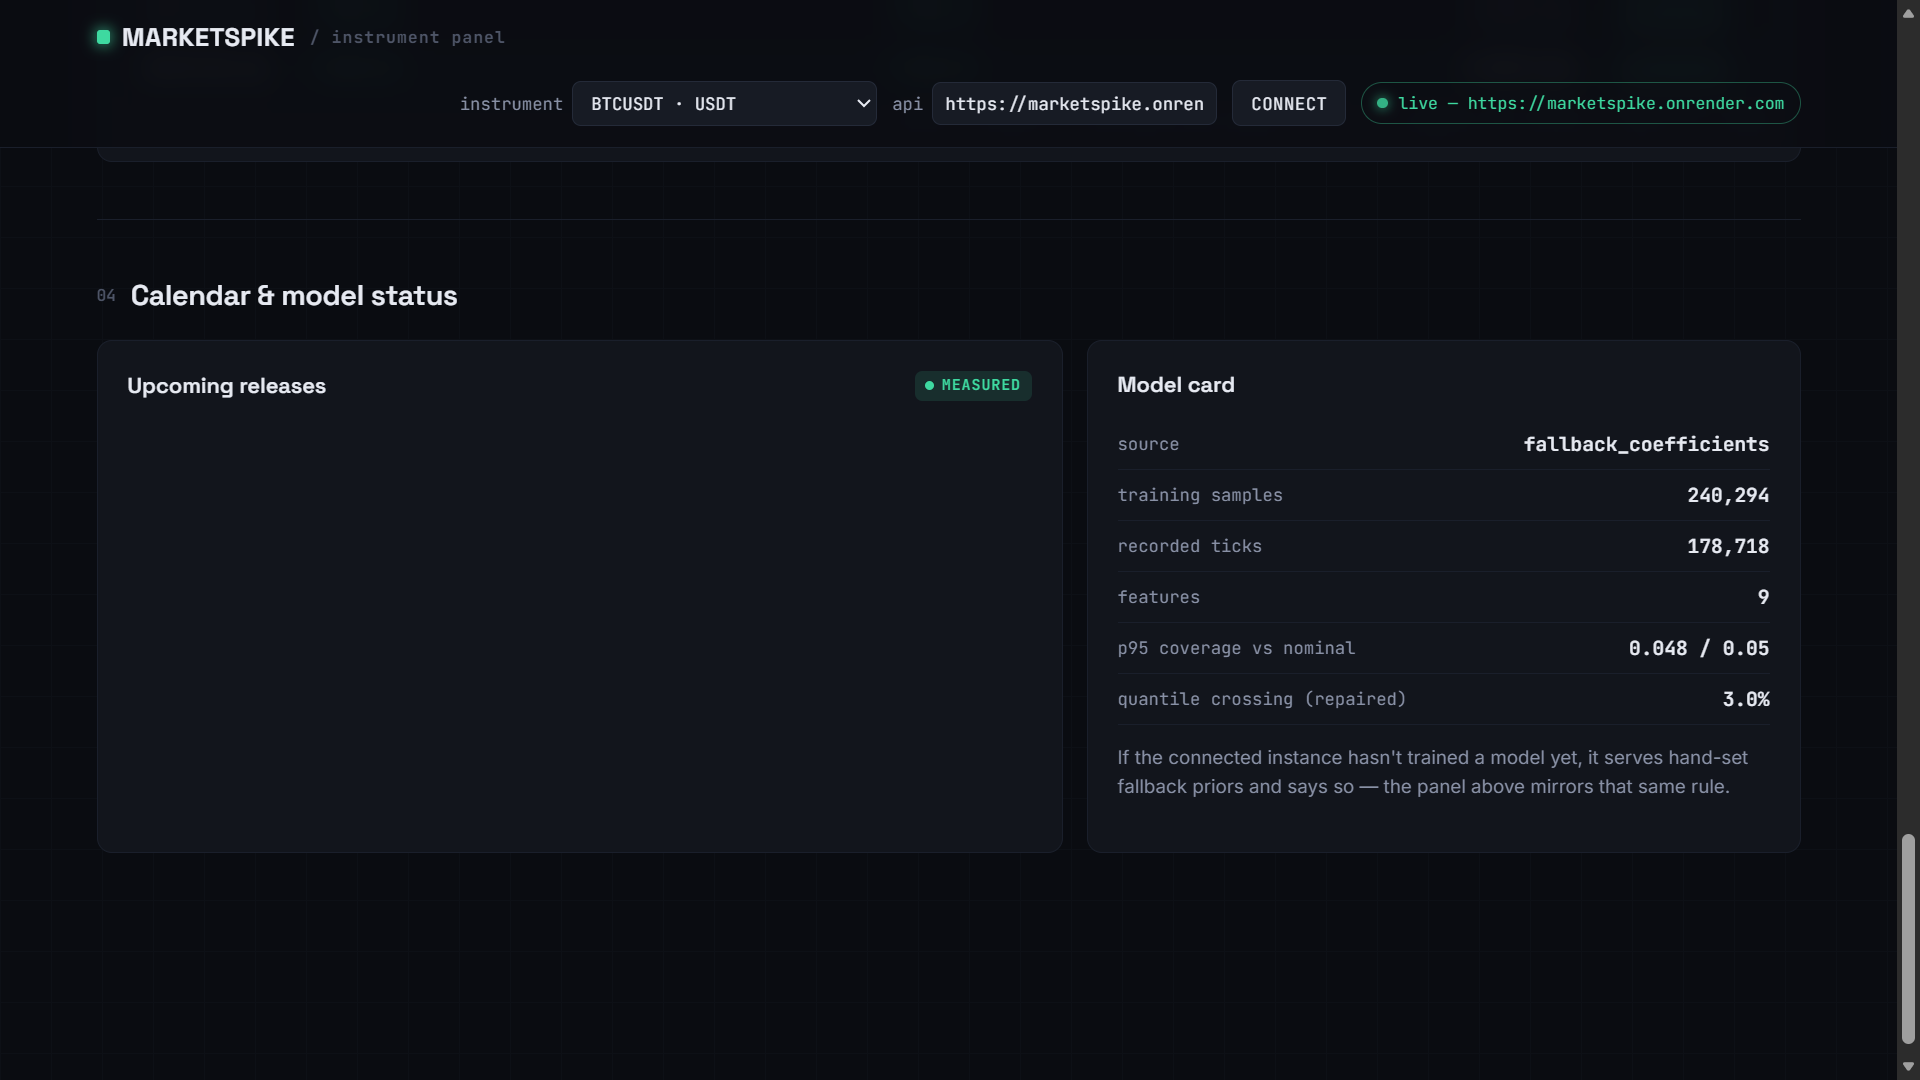
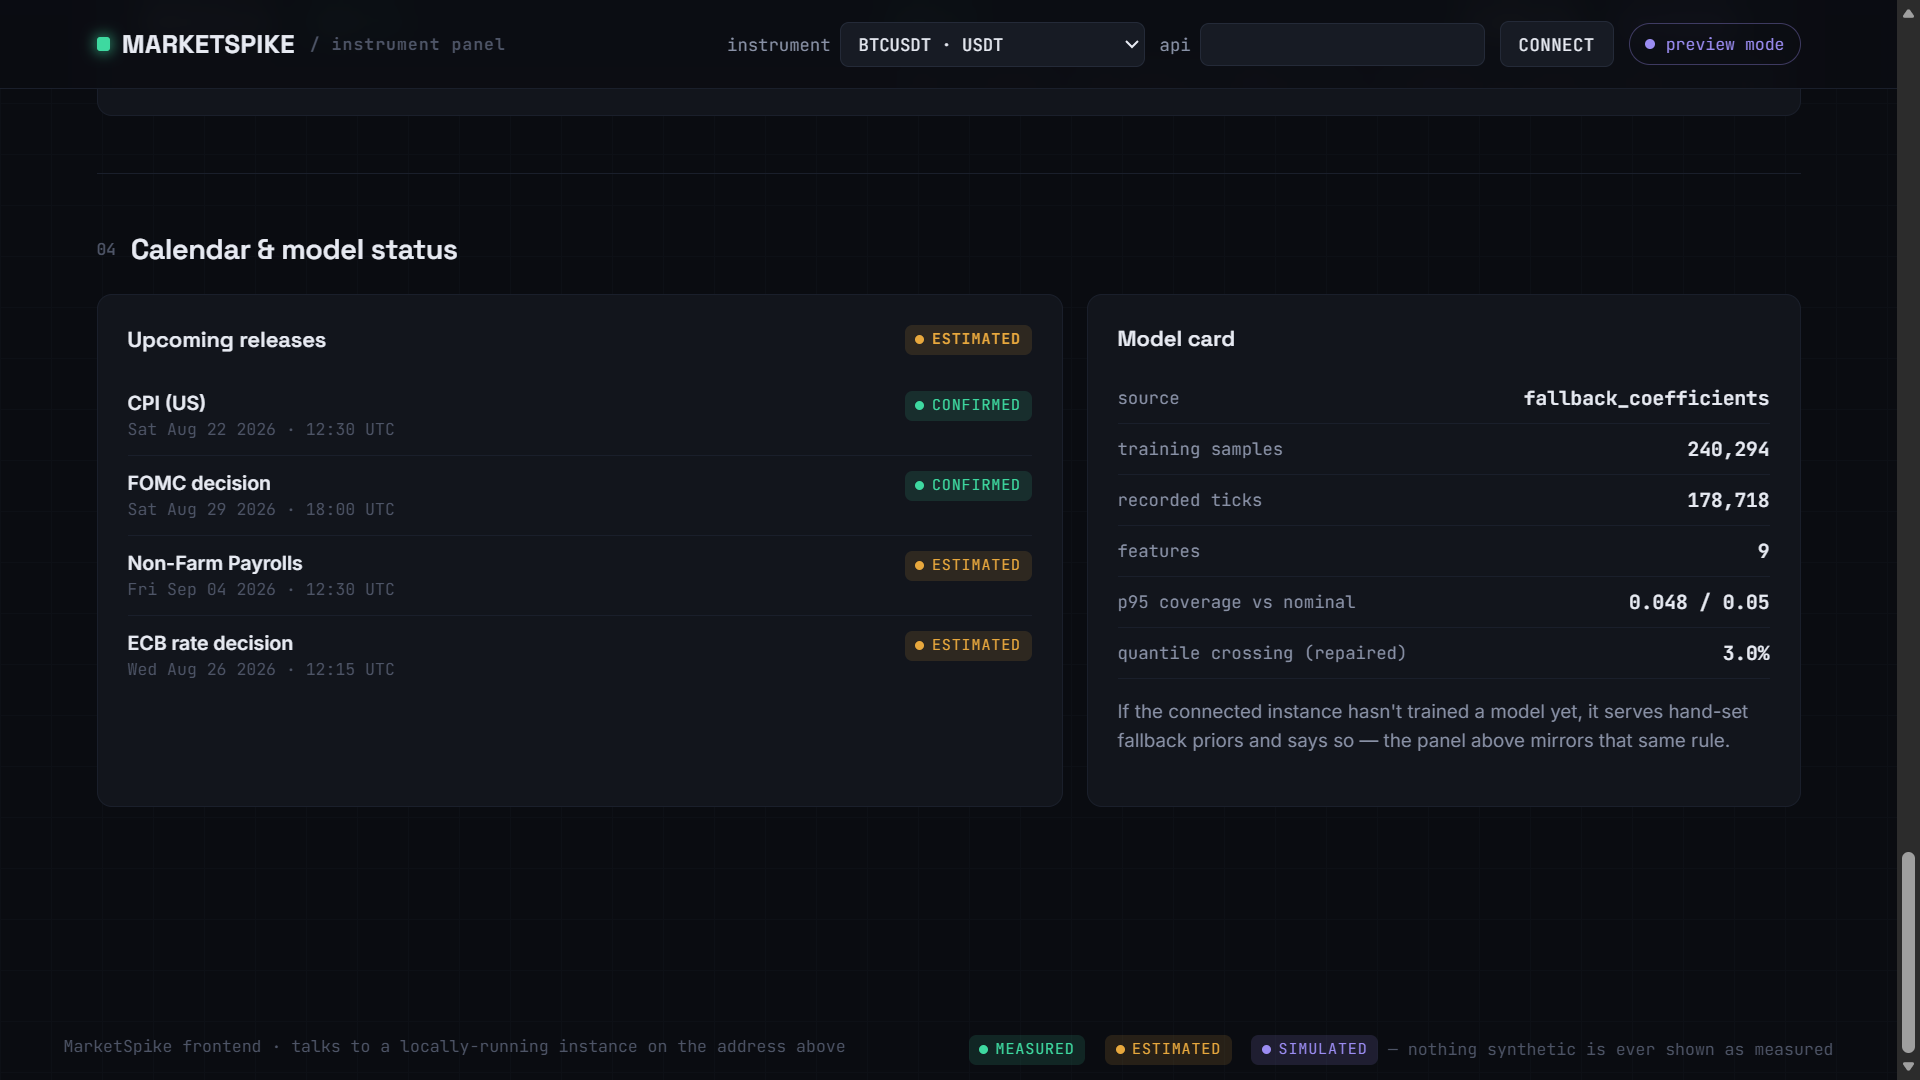
Preview Mode: Transparency label, calender and fallback coefficients
-
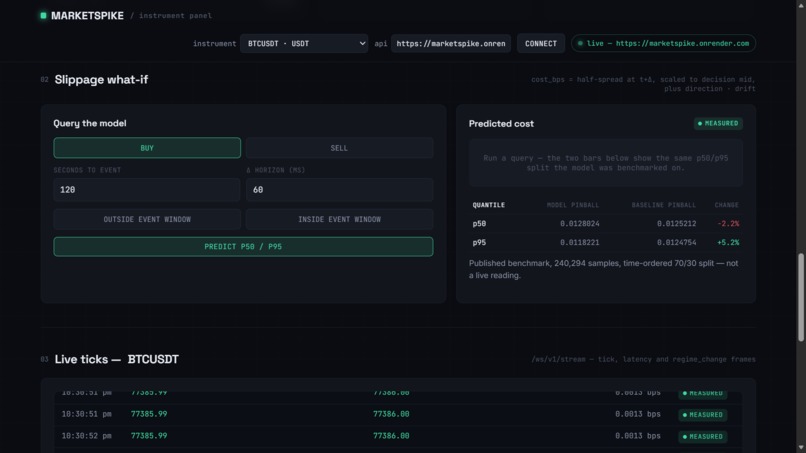
Live Mode
-
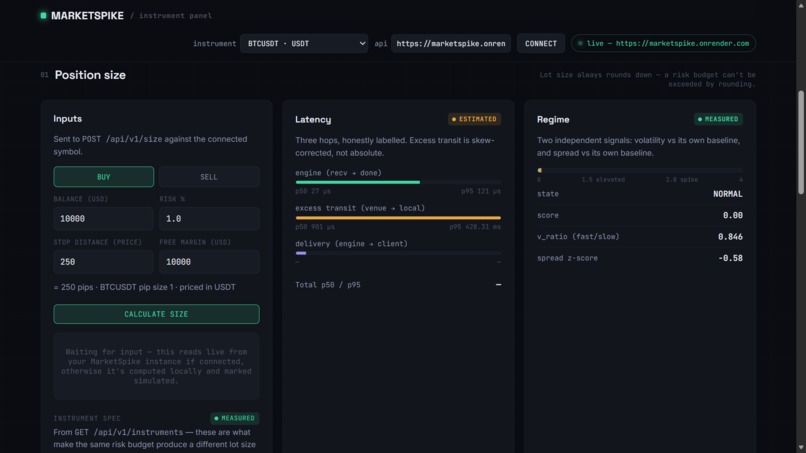
Live Mode
-
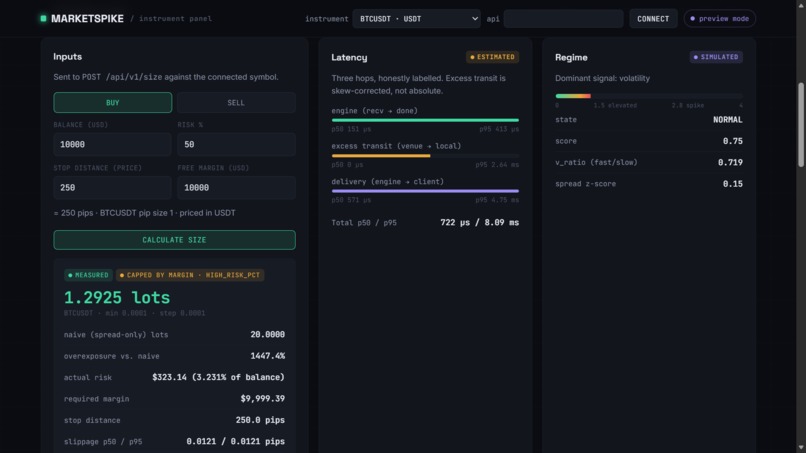
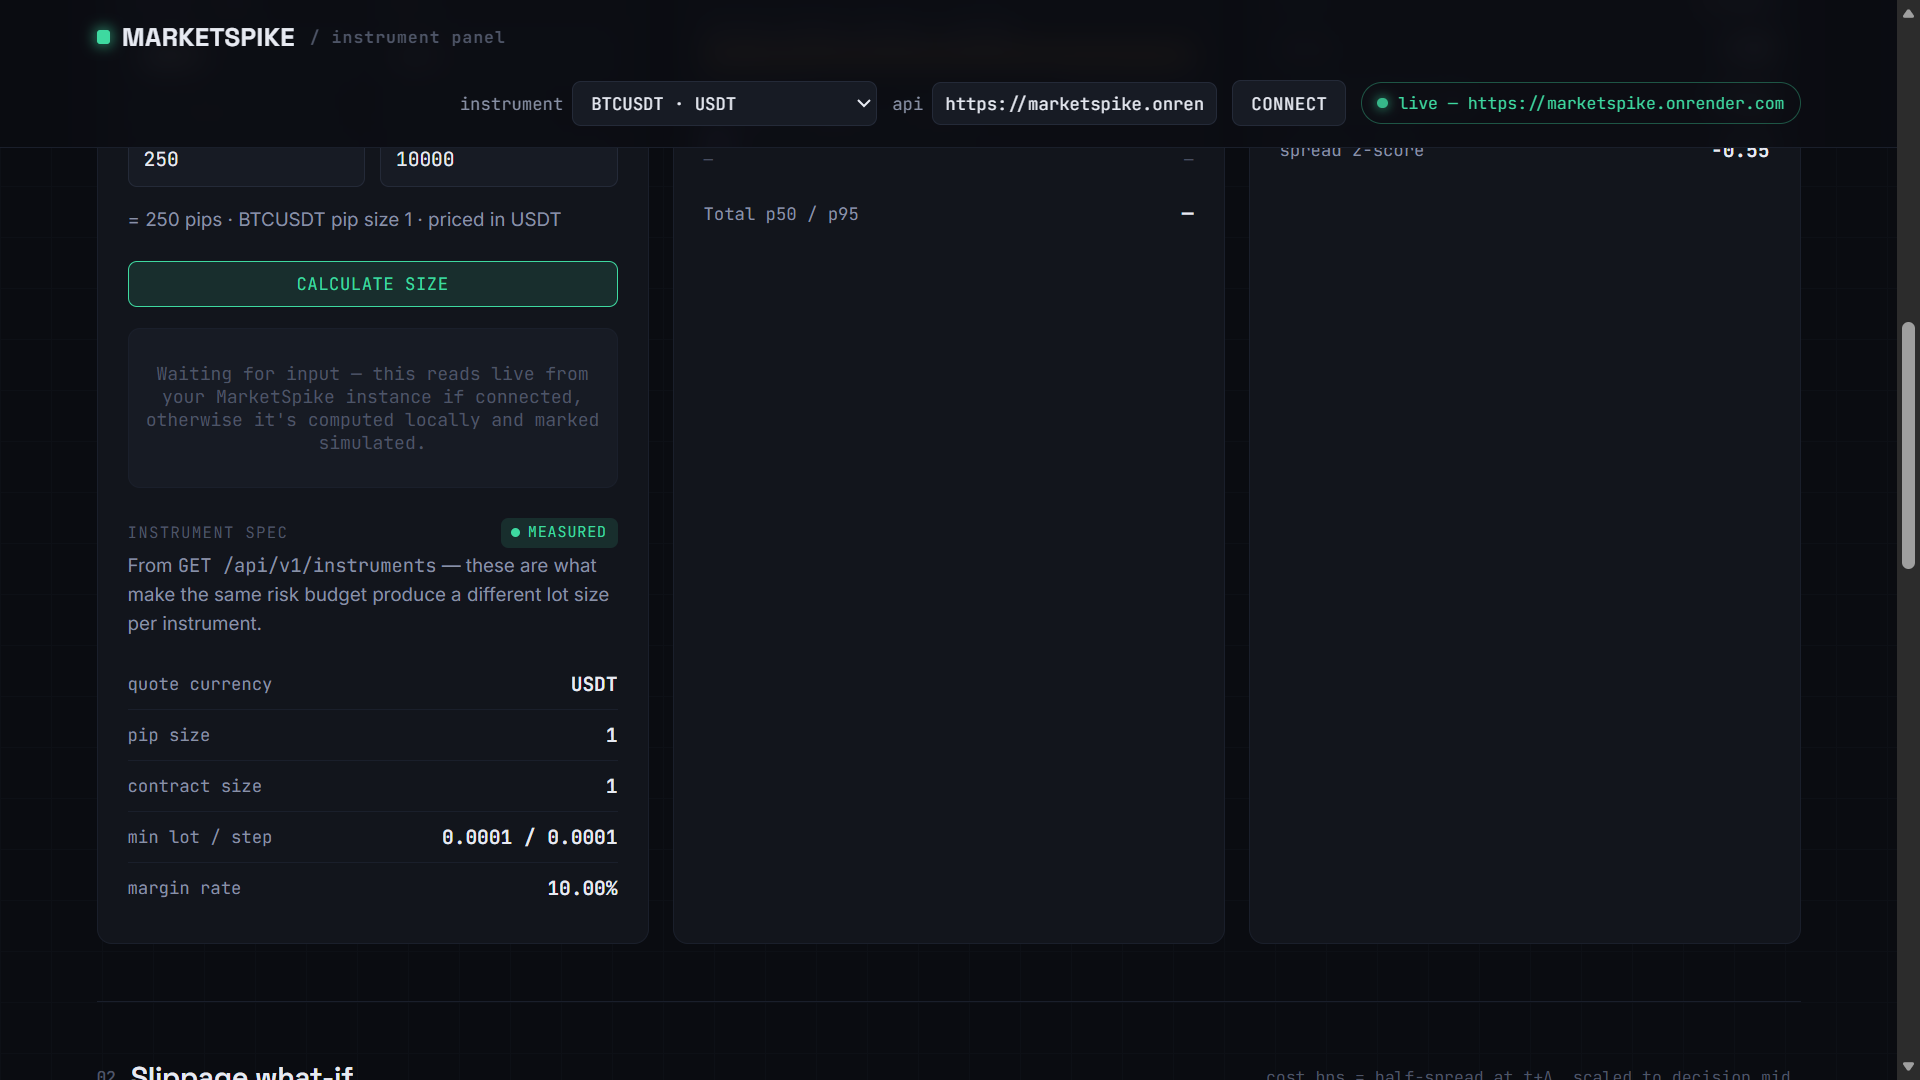
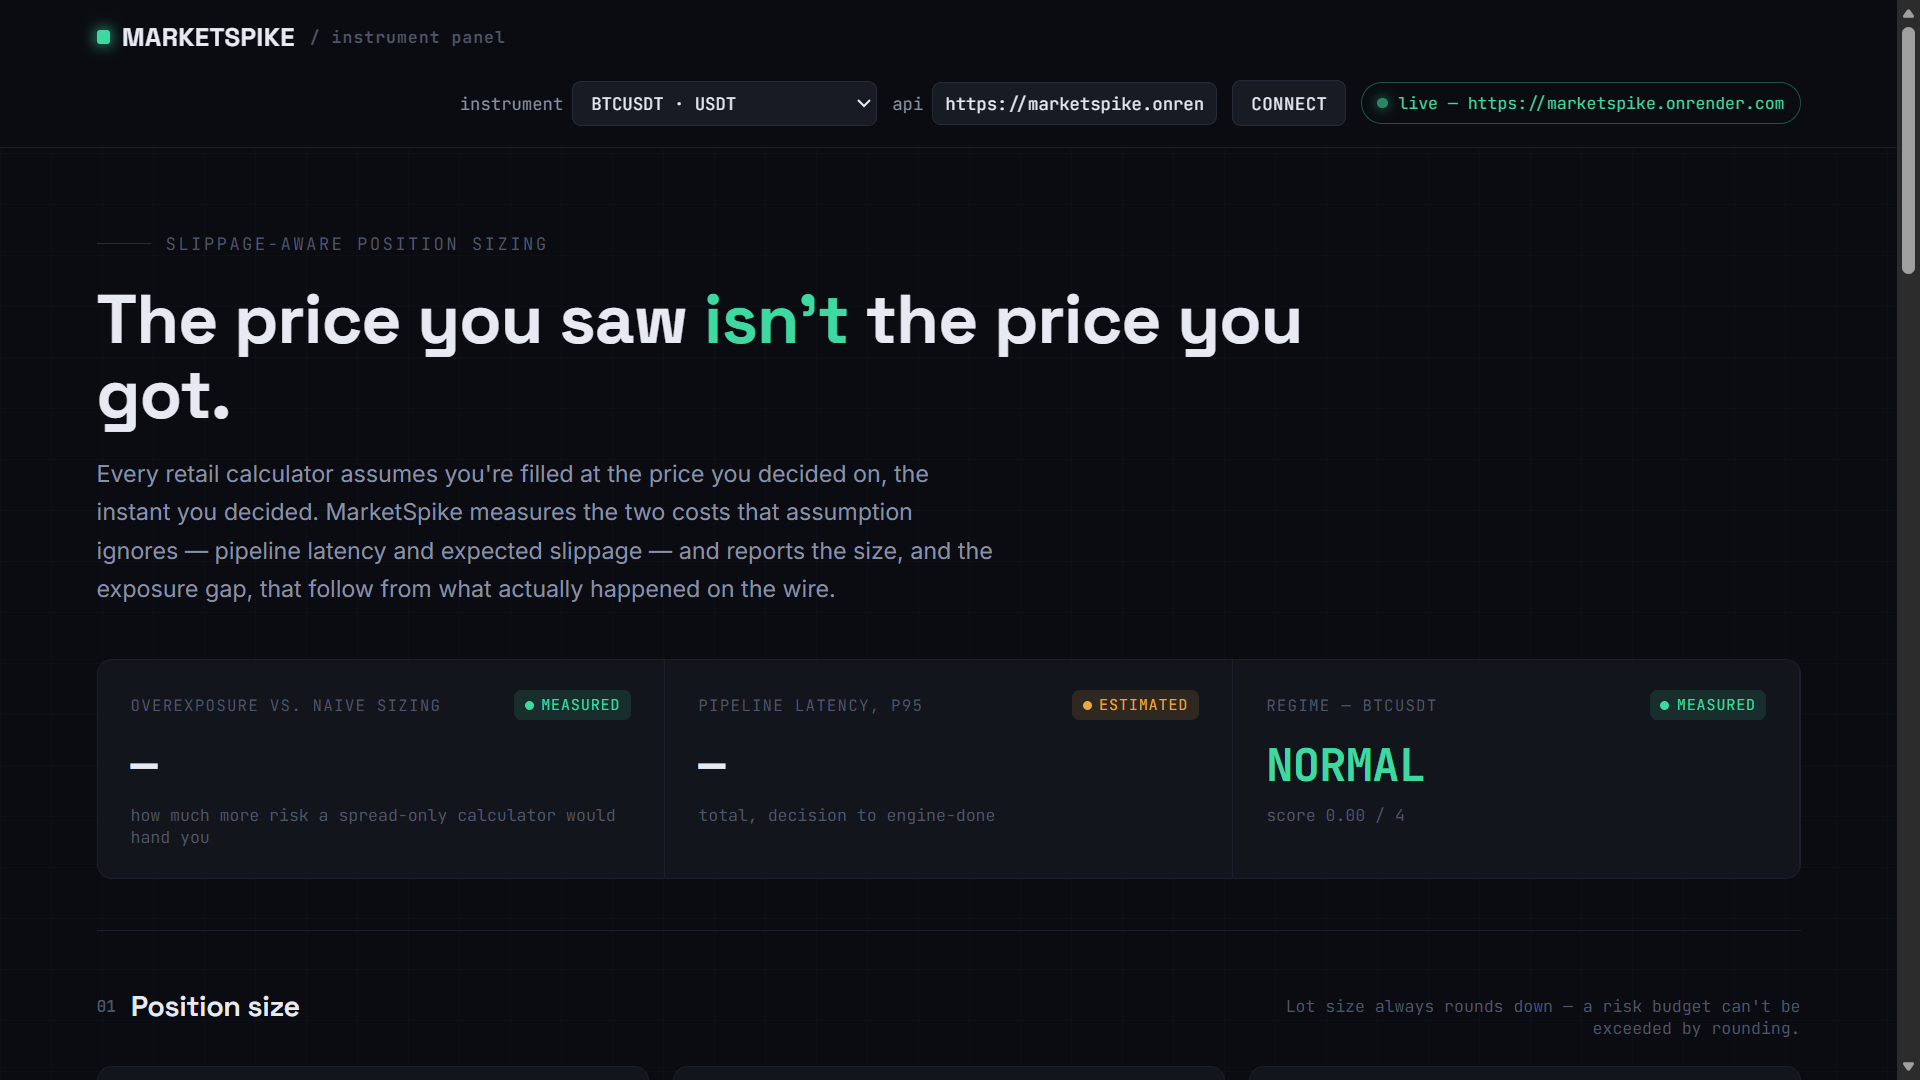
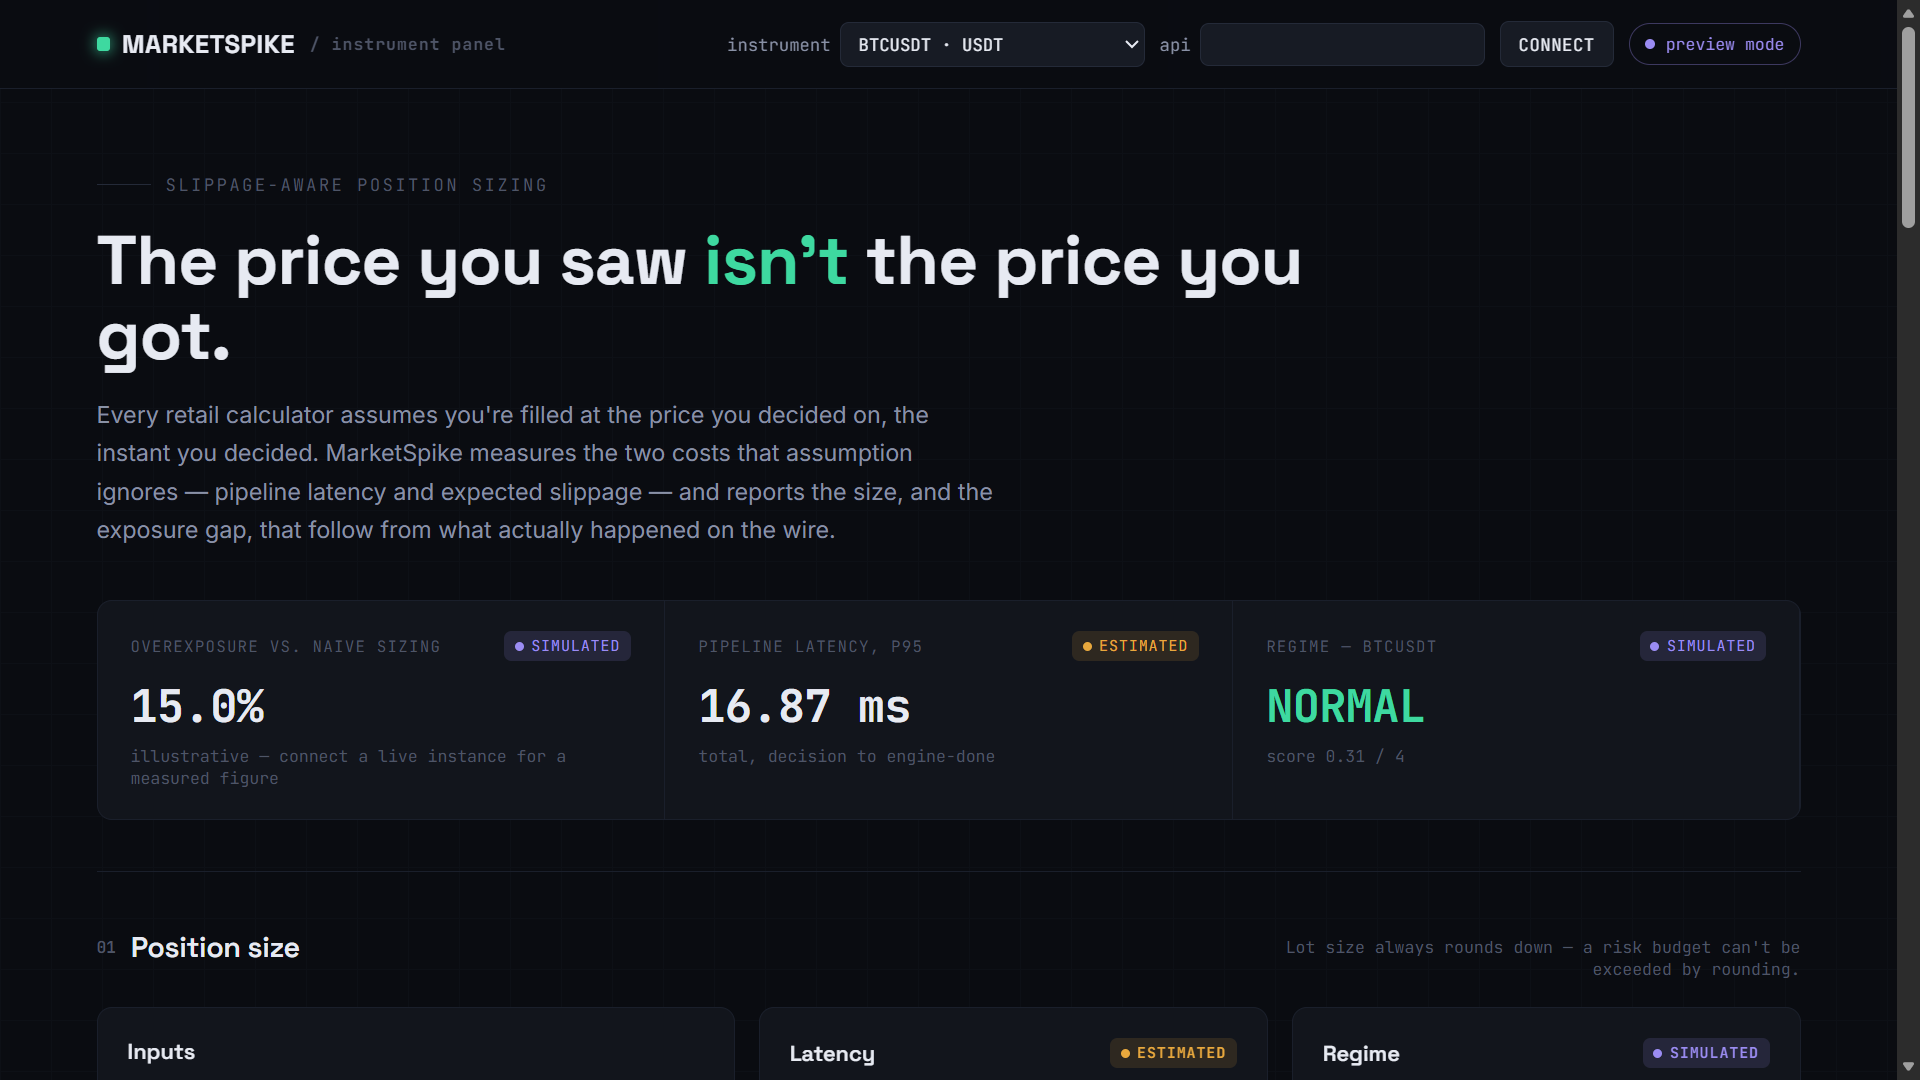
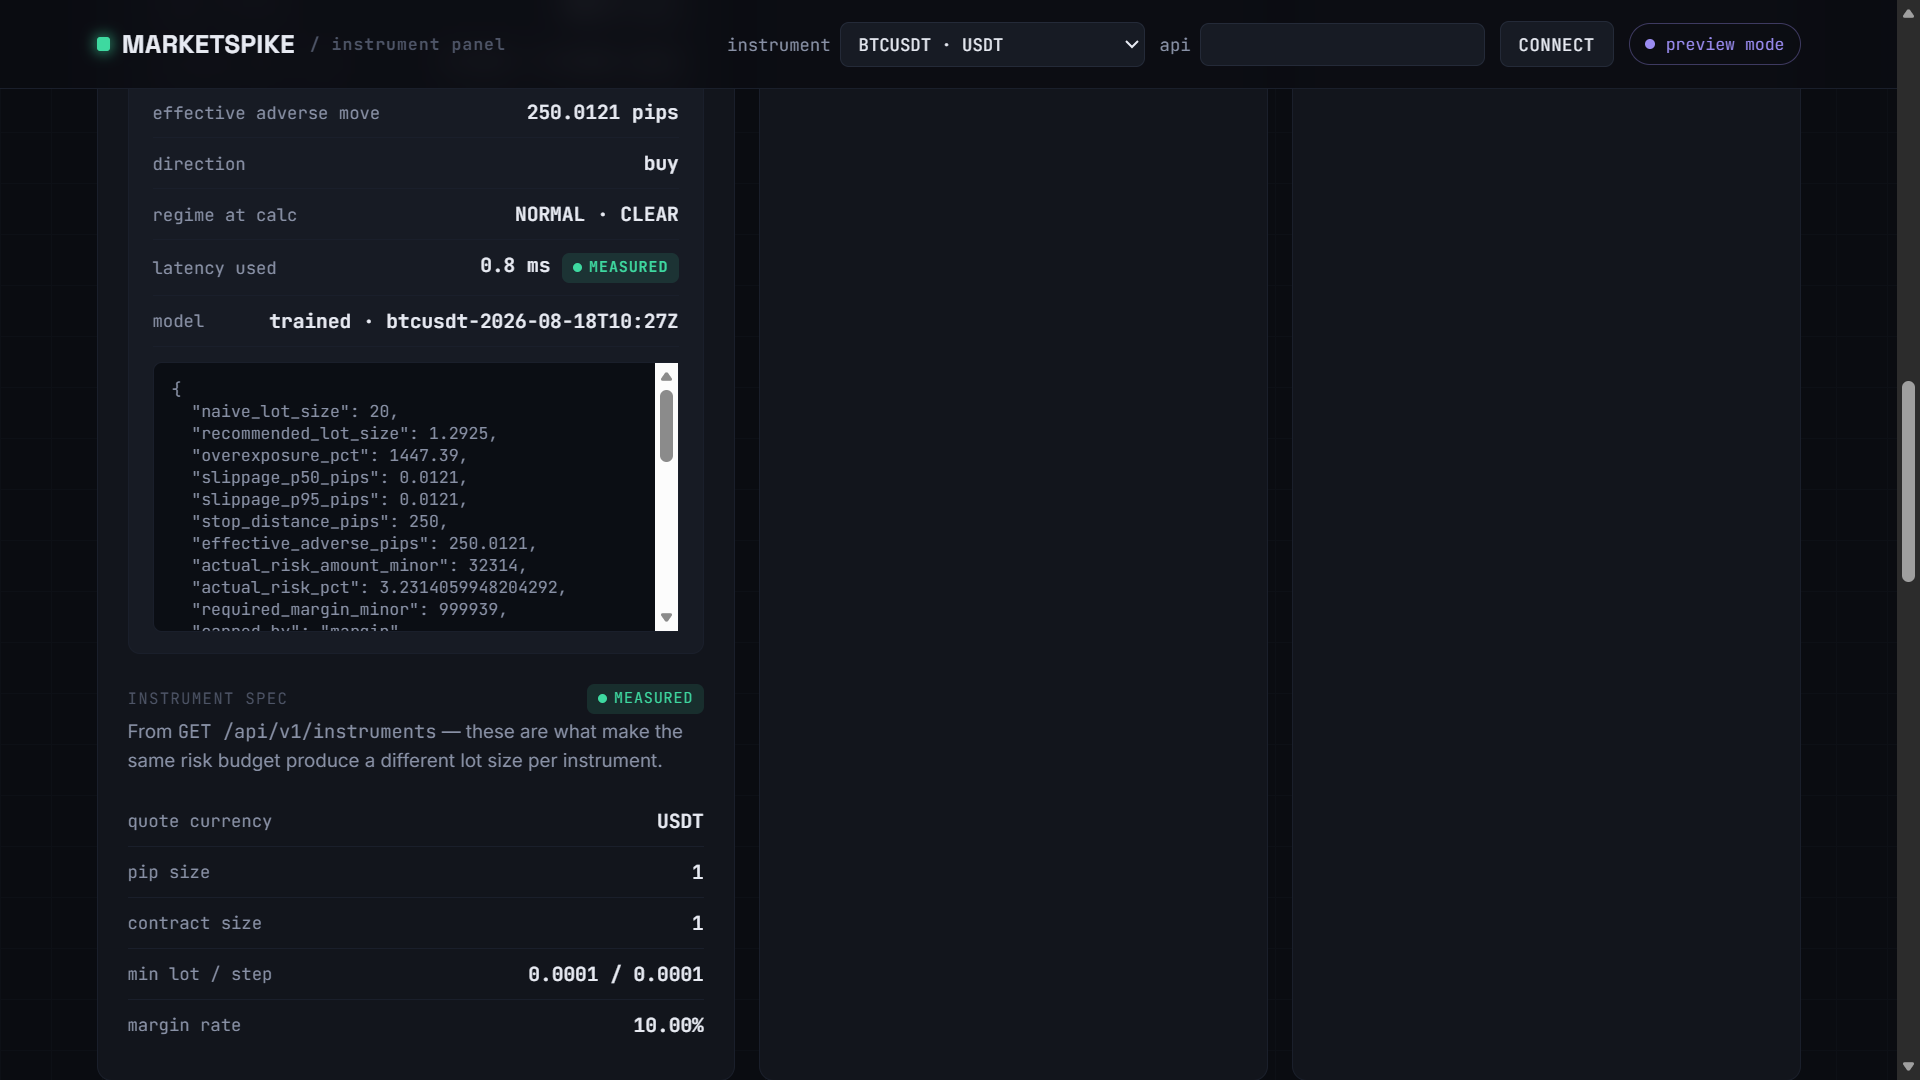
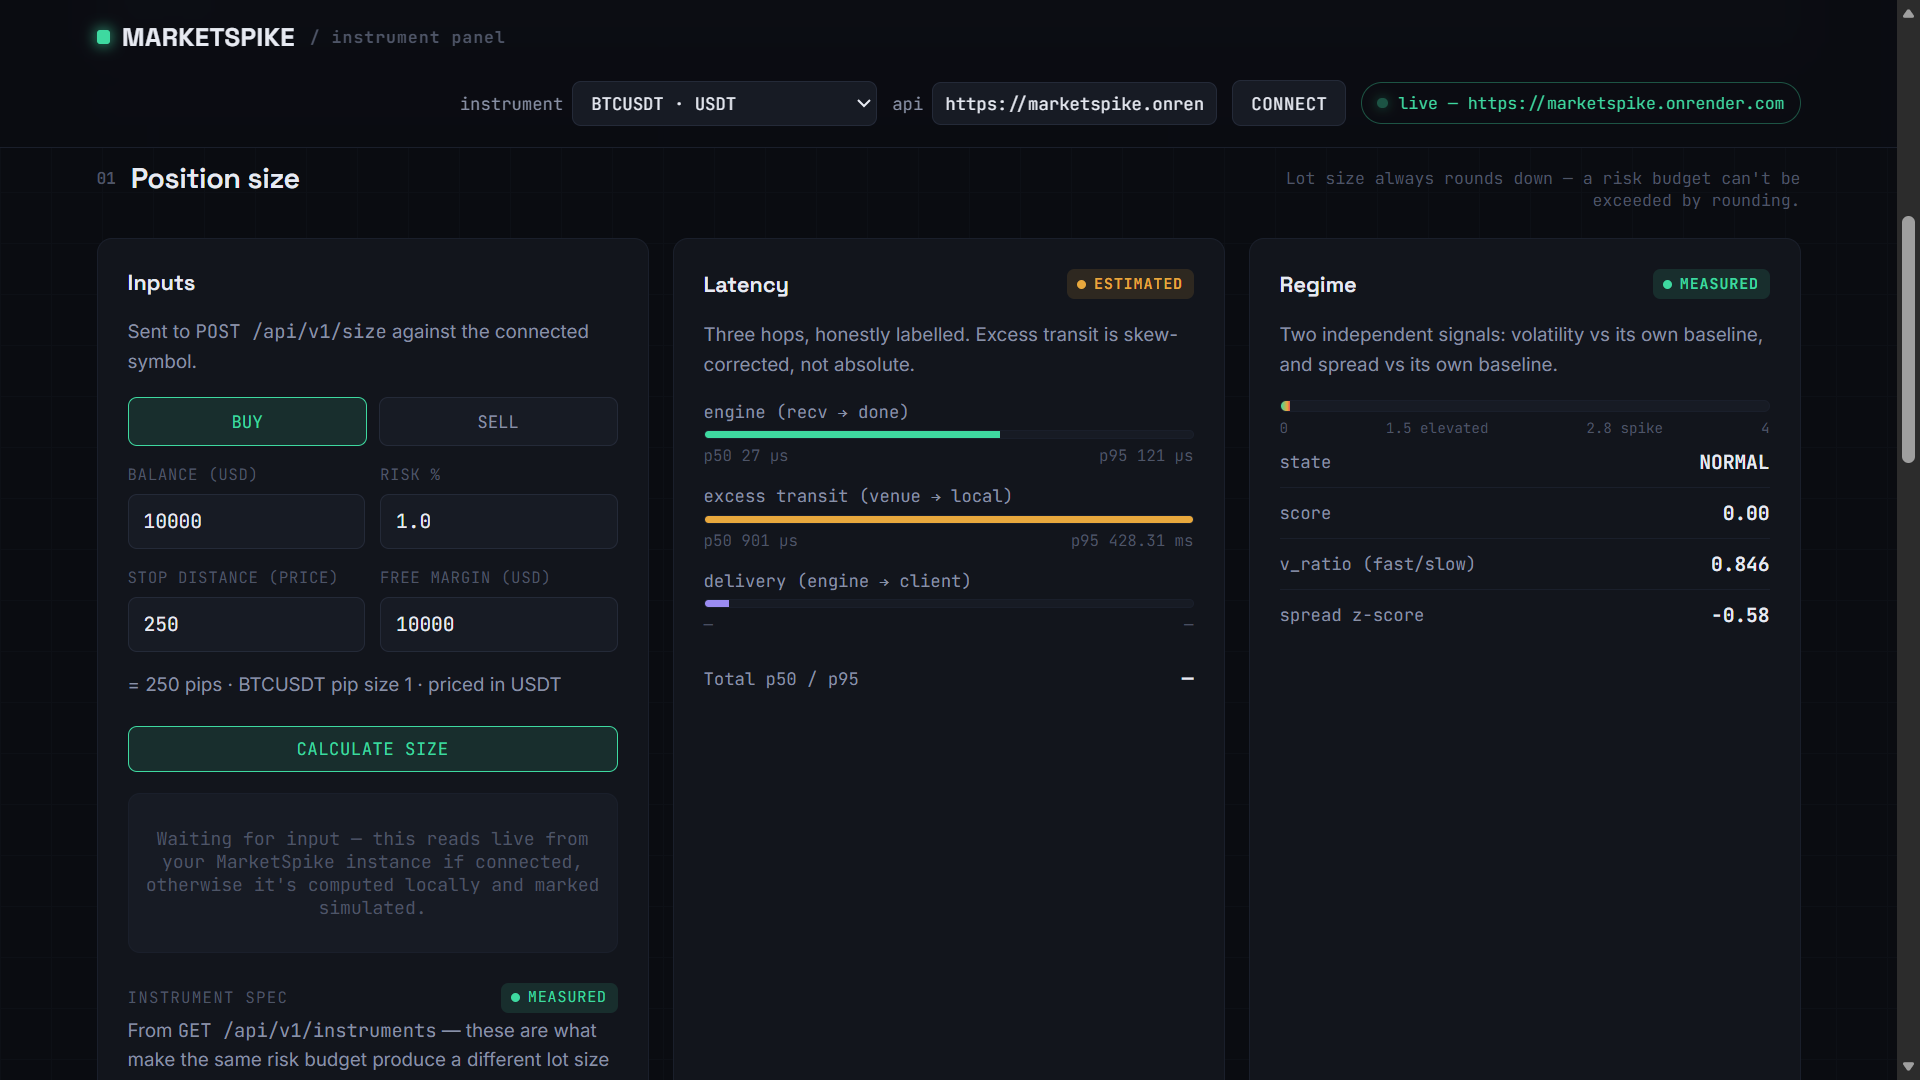
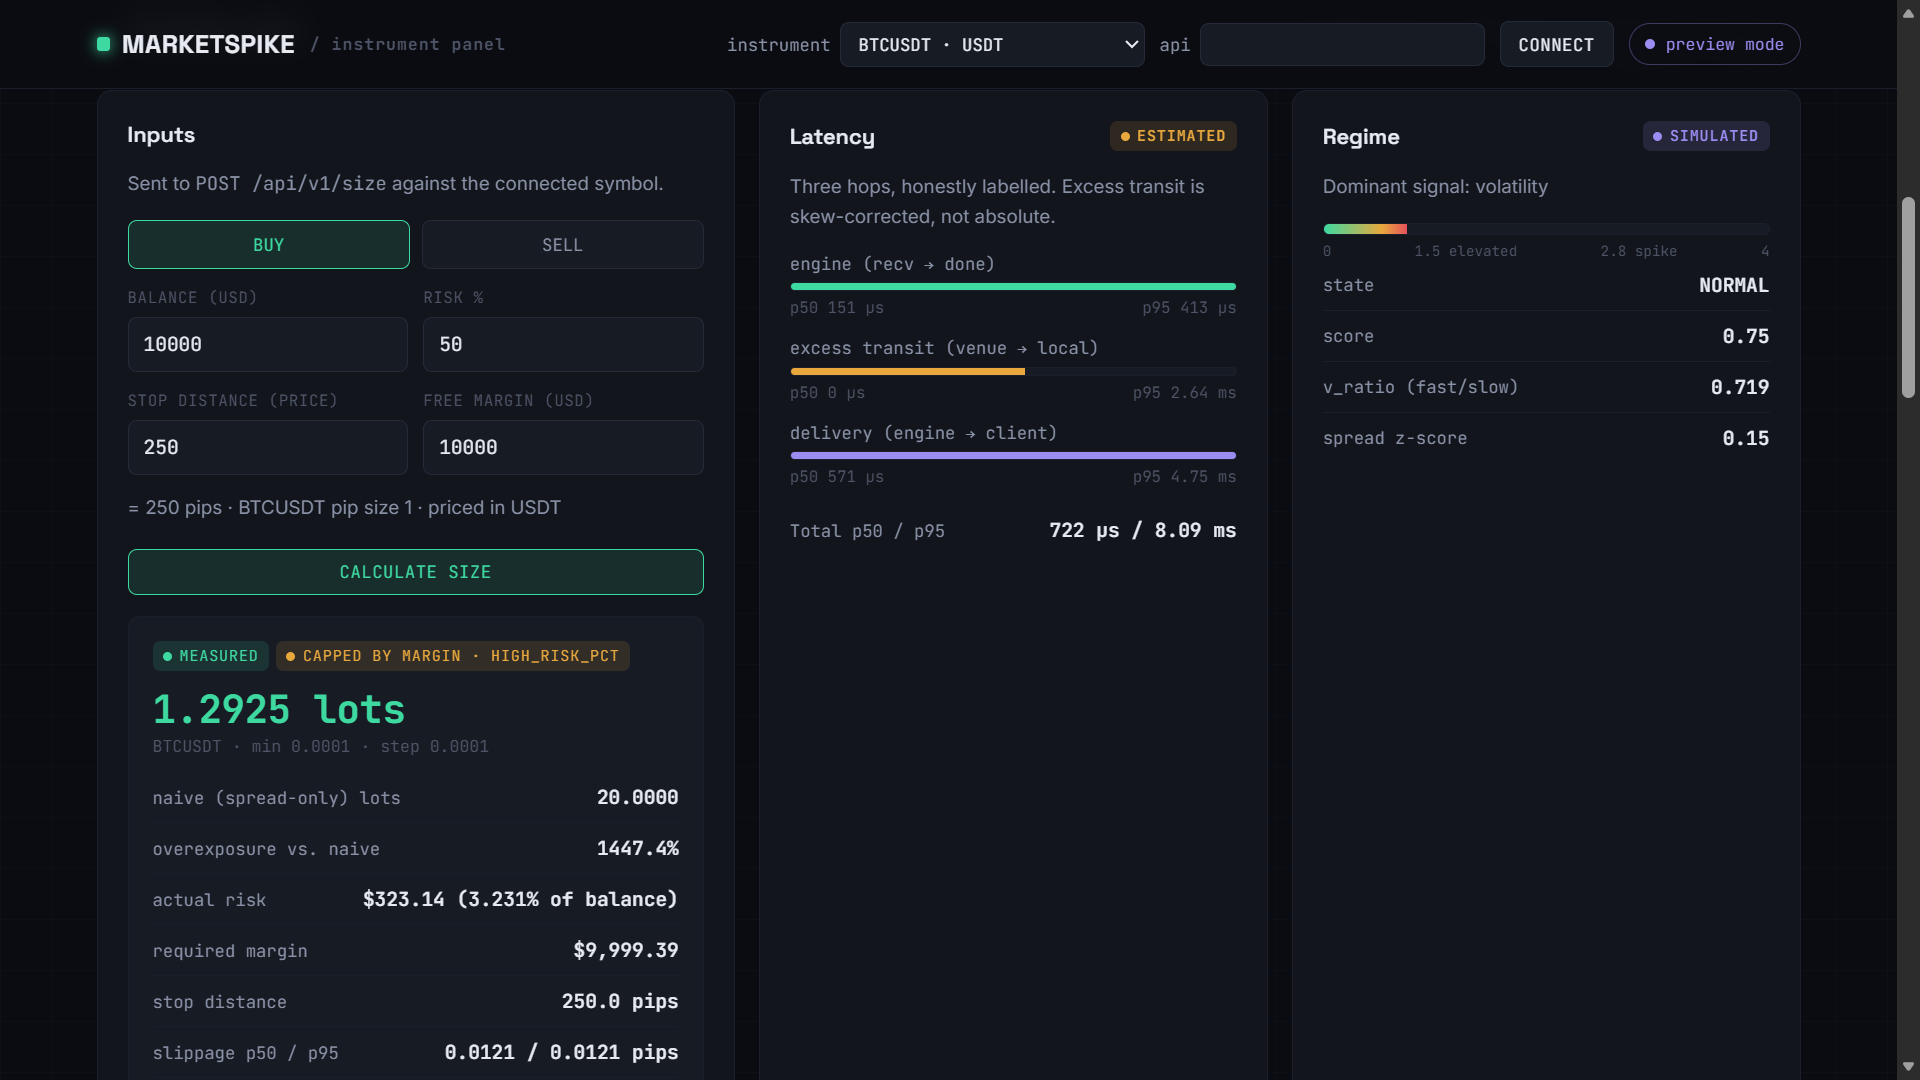
Preview Mode: Position sizing, Regime and markert state, and latency metrics
Inspiration
Every retail position-size calculator out there does the same one-line math: risk amount divided by stop-loss distance. It's the formula in every trading textbook, every YouTube tutorial, every broker's built-in tool. And it has a quiet, unstated assumption baked into it that you get filled at exactly the price you saw, the instant you decided to trade.
That assumption is fine on a calm Tuesday afternoon. It falls apart during NFP, CPI, or an FOMC decision the exact moments when a trader is most likely to actually need a calculator, because that's when position sizing matters most. Spreads widen, latency spikes, and the fill lands somewhere worse than the price the decision was based on. We wanted to build the calculator that admits that, instead of pretending it away.
What it does
MarketSpike is a slippage-aware position-size calculator. Instead of just dividing risk by stop distance, it measures two things that conventional tools ignore the real latency of its own data pipeline, and the expected slippage cost given current market conditions and folds both into the sizing decision.
Concretely, it:
- Streams live tick data from Binance (BTCUSDT).
- Measures its own pipeline latency end-to-end, broken into percentiles rather than an average, because the 95th-percentile tail is what actually costs money.
- Detects the current volatility/spread regime — NORMAL, ELEVATED, or SPIKE in real time.
- Runs a trained slippage model to predict expected cost in basis points for the current moment.
- Returns a corrected position size, and reports overexposure_pct exactly how much more risk a naive calculator would have handed the trader.
All of it is exposed through a REST + WebSocket API, with a live dashboard on top of it.
How we built it
We split the project along a clean seam: Olwethu Dlamini built the backend, I (Lwandile Dlamini) built the frontend.
The backend is a single FastAPI process on one asyncio event loop. Feed adapters normalize Binance messages into a common tick format; a per-symbol engine derives latency, volatility, spread, and regime from that stream; frames fan out over a bus to a WebSocket while a recorder drains ticks to SQLite on a background thread. Offline, a trainer fits a linear quantile regression model nine features, all strictly time-ordered to prevent leakage against recorded ticks, producing a 3 KB model file the live service loads and serves with no ML runtime required.
The frontend is a single self-contained HTML dashboard with no build step. It talks to the backend's documented API contract, renders the live regime, latency, and slippage readings, and lets you run the position-size calculator and the slippage "what-if" predictor directly against the running instance. Every value it displays carries a badge measured, estimated, or simulated mirroring the same honesty principle the backend enforces on its own data: nothing synthetic is ever shown as if it were real. If the dashboard can't reach a backend, it drops into a clearly-labeled simulated preview instead of quietly failing or faking numbers.
Challenges we ran into
- Binance's bookTicker stream carries no venue timestamp. We couldn't measure transit latency off it directly. The fix was subscribing to depth@100ms on the same connection purely for its timestamp field, since transit latency is a property of the connection, not of any individual quote.
- Absolute network transit time is unmeasurable a single sample can't separate clock skew from actual queueing delay. We settled on tracking a rolling minimum of the raw offset as the skew floor, and reporting only the excess above it.
- sklearn.QuantileRegressor didn't scale. It measured at roughly O(n^1.7) fine at 8k samples, 3.5 minutes at 54k, and extrapolating to hours at the sample counts we actually wanted to train on. Switching to batch gradient descent on pinball loss with Polyak–Ruppert averaging fit the full dataset in under a minute, and calibrated better besides.
- BTCUSDT tick data is extremely discrete about 99% of consecutive ticks show zero mid-price change over a 60ms horizon. That produces a large point mass at exactly the half-spread and skews naive coverage metrics; we had to account for that artifact explicitly rather than treat it as a bug.
- Getting the frontend and backend to agree on a contract without constant back-and-forth we worked from a written API spec so both halves could be built in parallel and only need to sync at the edges.
Accomplishments that we're proud of
- 241 passing tests, including mutation-checked ones where a test's failure mode wasn't obvious, we broke the code on purpose, confirmed the test caught it, then restored it.
- The slippage model measurably beats a spread-only baseline exactly where it's supposed to: it ties or slightly loses at the median (where the baseline is definitionally close to optimal), and wins by 5%+ at the 95th percentile the tail that actually costs traders money.
- A frontend and backend built independently against a shared contract that came together cleanly.
- An honesty system the measured / estimated / simulated badges that we carried consistently from the backend's API responses all the way through to every pixel on the dashboard.
What we learned
- Percentiles tell the truth that averages hide. A 1ms median latency with a 72ms p95 is a completely different operating environment than a 1ms median with a 2ms p95, and a mean genuinely cannot tell those apart.
- Being honest about data provenance is a design decision, not an afterthought. Deciding upfront that every number needed a measured/estimated/simulated label shaped both the API and the UI in ways that made the whole system easier to trust and easier to debug.
- Real-time financial data has sharp edges you don't see in a tutorial discrete price ticks, unmeasurable clock skew, exchange APIs with missing fields and a lot of the actual engineering is in handling those honestly rather than smoothing over them.
What's next for MarketSpike
- Capture a genuine volatility spike so the model's per-regime breakdown has more than one populated row.
- Add authentication so the service can be safely deployed beyond localhost.
- Expand beyond BTCUSDT/EURUSD to more asset classes, with real (non-identity) FX conversion.
- Add historical replay controls to the dashboard so past releases can be scrubbed through directly in the UI.
Built With
- asyncio
- binance-api
- css3
- fastapi
- github
- html5
- javascript
- machine-learning
- oanda-api
- pytest
- python
- quantile-regression
- rest-api
- scikit-learn
- sqlite
- websocket


Log in or sign up for Devpost to join the conversation.