Inspiration
The stock market is an interconnected system of businesses creating products, providing services, competing for demand, and relying on capabilities supplied by others. I wanted to make that structure visible.
My background in statistics and data science led me to a question: what could we discover if we organized the market around what companies actually offer and what they are likely to need?
A company's offerings reveal how it contributes to the economy. Its estimated needs suggest where other businesses could support it. Across the market, those two perspectives create a foundation for investigating competition, potential opportunity, and interconnected effects.
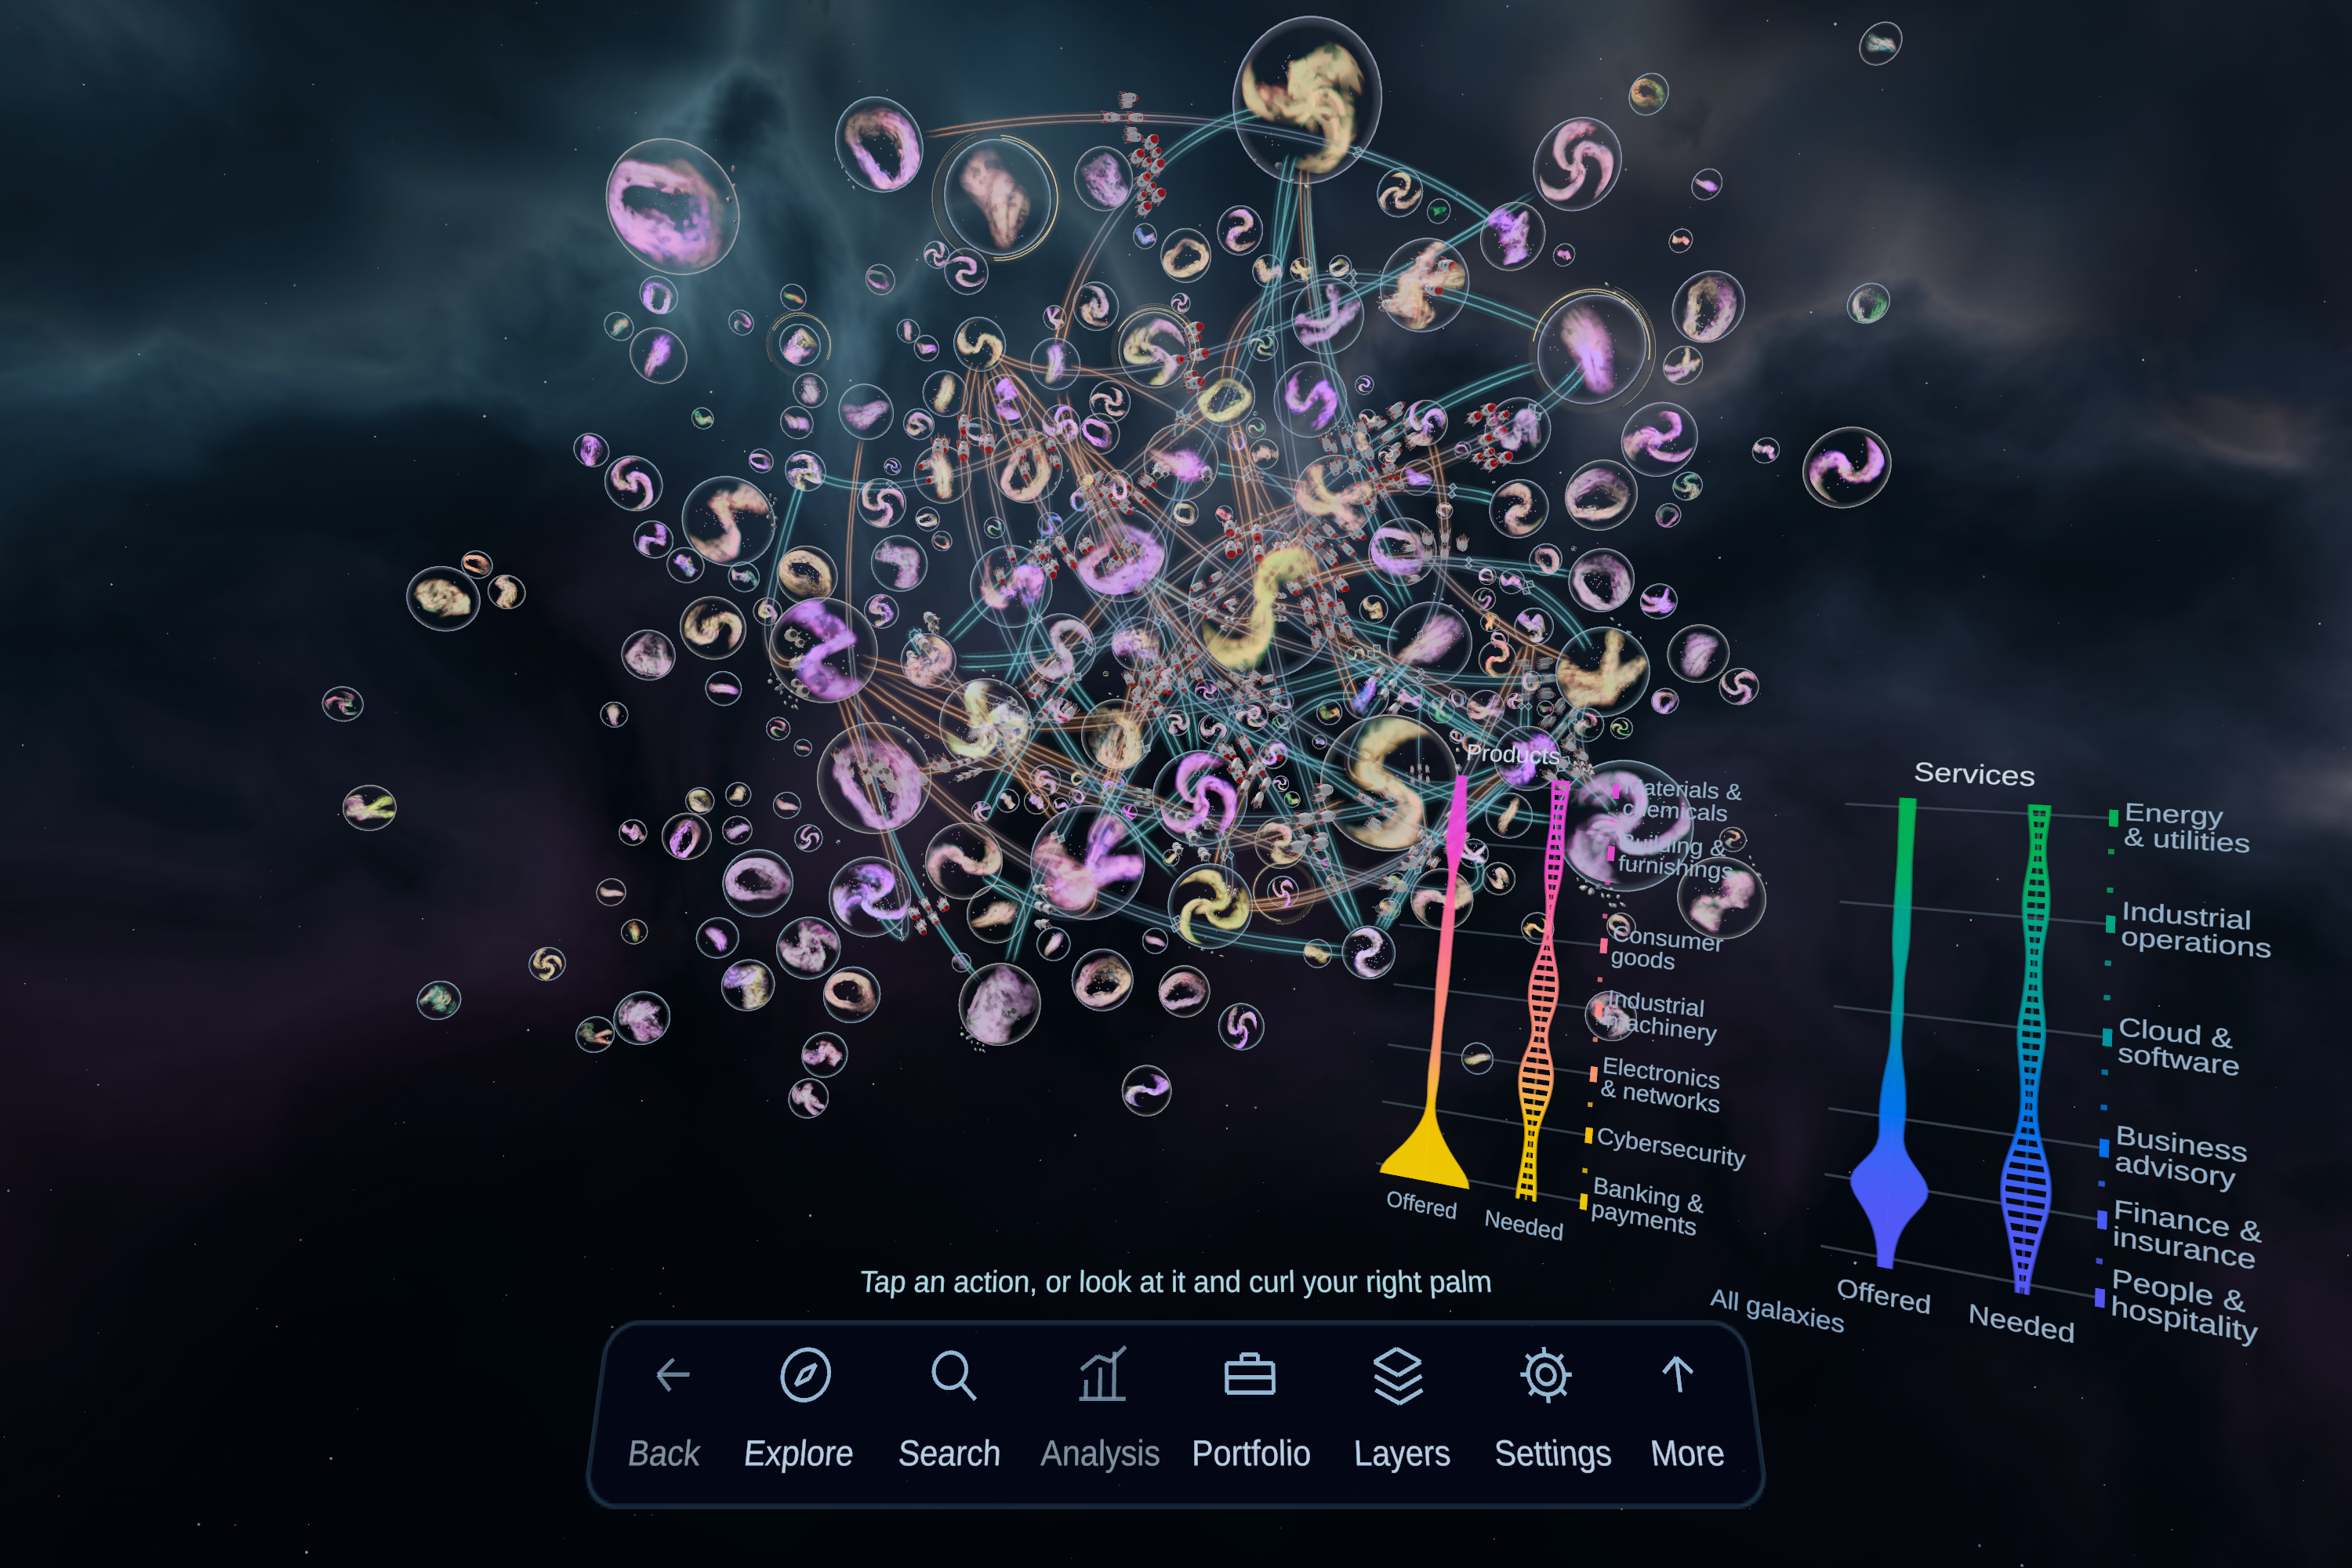
That became the core of MarketScout. I built an analytical pipeline that extracts company product and service offerings, estimates operational needs, and uses similarities between offerings to cluster businesses into galaxies. The resulting universe gives those relationships a spatial form.
My vision is to make the entire stock market an environment people can explore with their hands: move into a cluster, examine its capabilities, follow a potential exchange into another part of the market, and investigate the companies behind it.
The galaxies emerge from the analysis. Exploring the universe becomes a way to explore the structure of the market itself.
What it does
MarketScout combines company capability analysis, business clustering, potential exchange mapping, and financial research in a hands-first experience for Meta Quest.
Organizes companies by what they offer
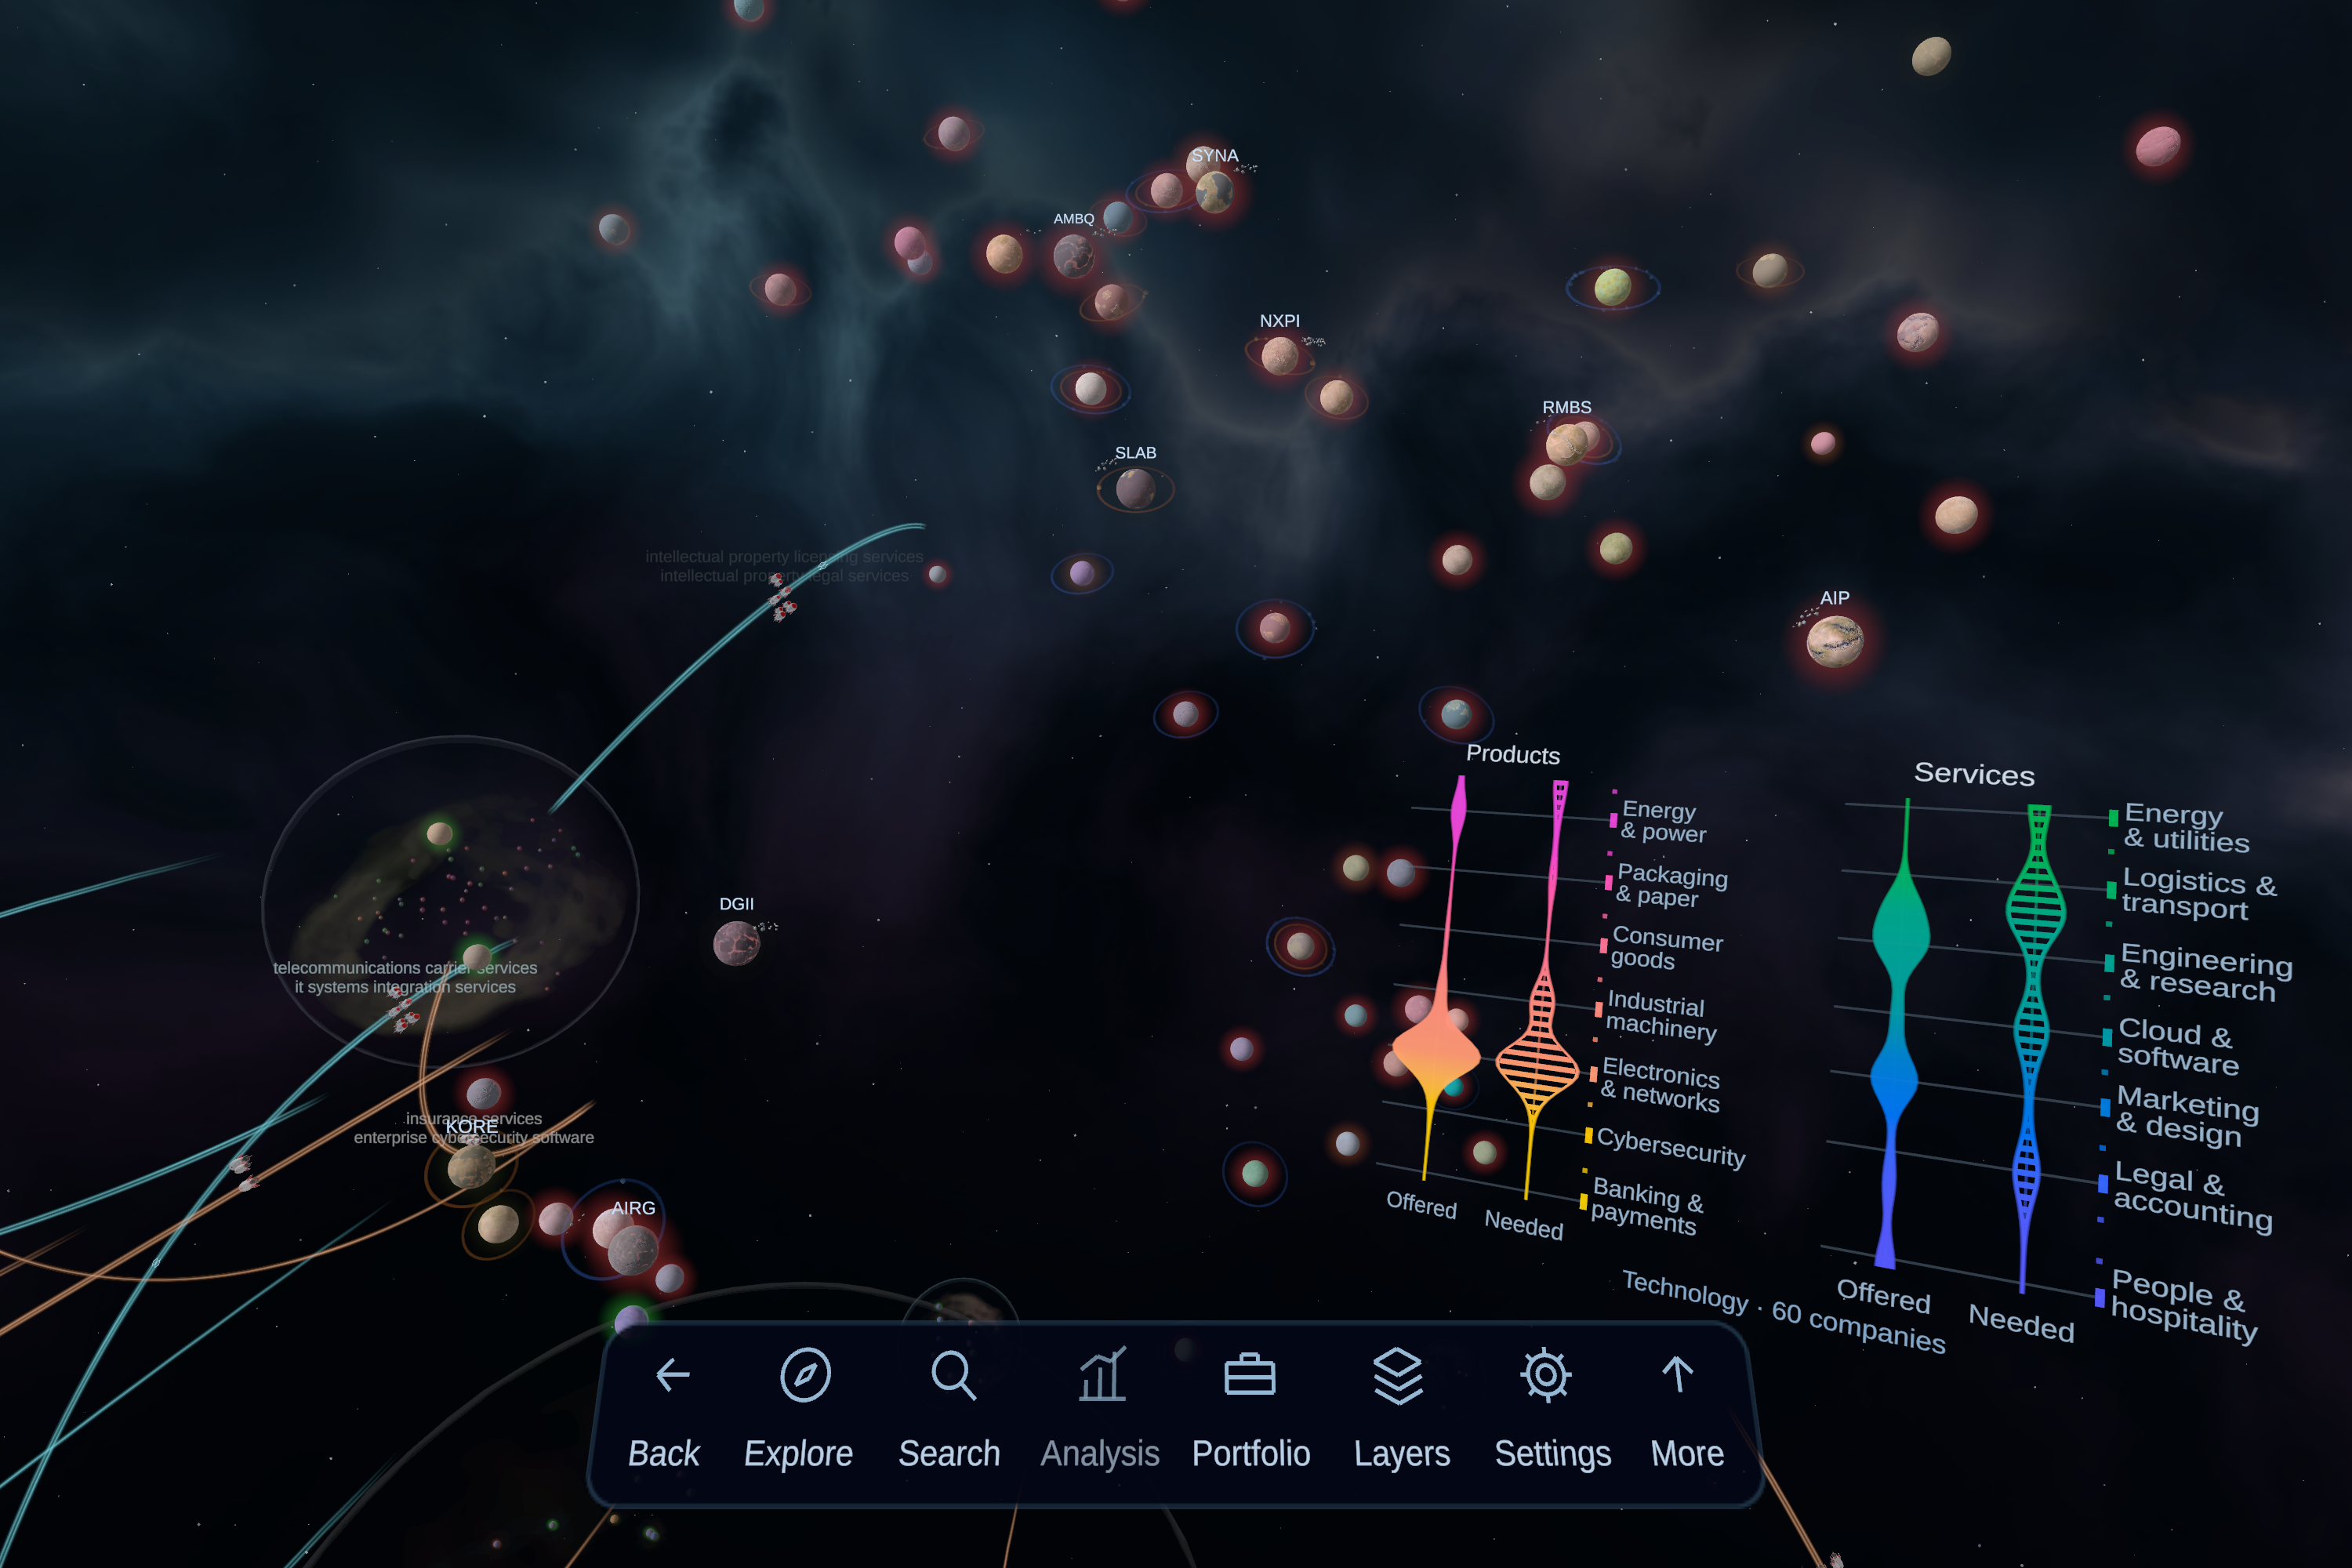
The analysis extracts and standardizes the products and services companies provide. Semantic similarity between those offerings creates a network of related businesses, and graph-based clustering organizes that network into galaxies.
This gives users a way to investigate business relationships at the level of actual capabilities. A company can be understood through the products and services it shares with its neighbors, with connections that can span familiar industry classifications.
Reveals crowded capabilities and potential opportunity
Estimated product and service needs add another dimension to the analysis. Users can examine where similar offerings are concentrated, where particular needs appear across businesses, and where those needs have relatively few matching providers in the represented data.
That creates a way to investigate potential market saturation, concentrations of estimated need, and possible gaps worth pursuing. A research session can begin with a capability or a need, then develop into an investigation of the companies and business groups involved.
For example, a researcher could begin with a cluster whose companies are estimated to need a specialized service, follow a compatible trade lane to another galaxy, inspect the potential providers, and compare their financial profiles. The network provides a path from a market pattern to the businesses that warrant closer investigation.
Makes potential exchange visible through Import/Export trade lanes
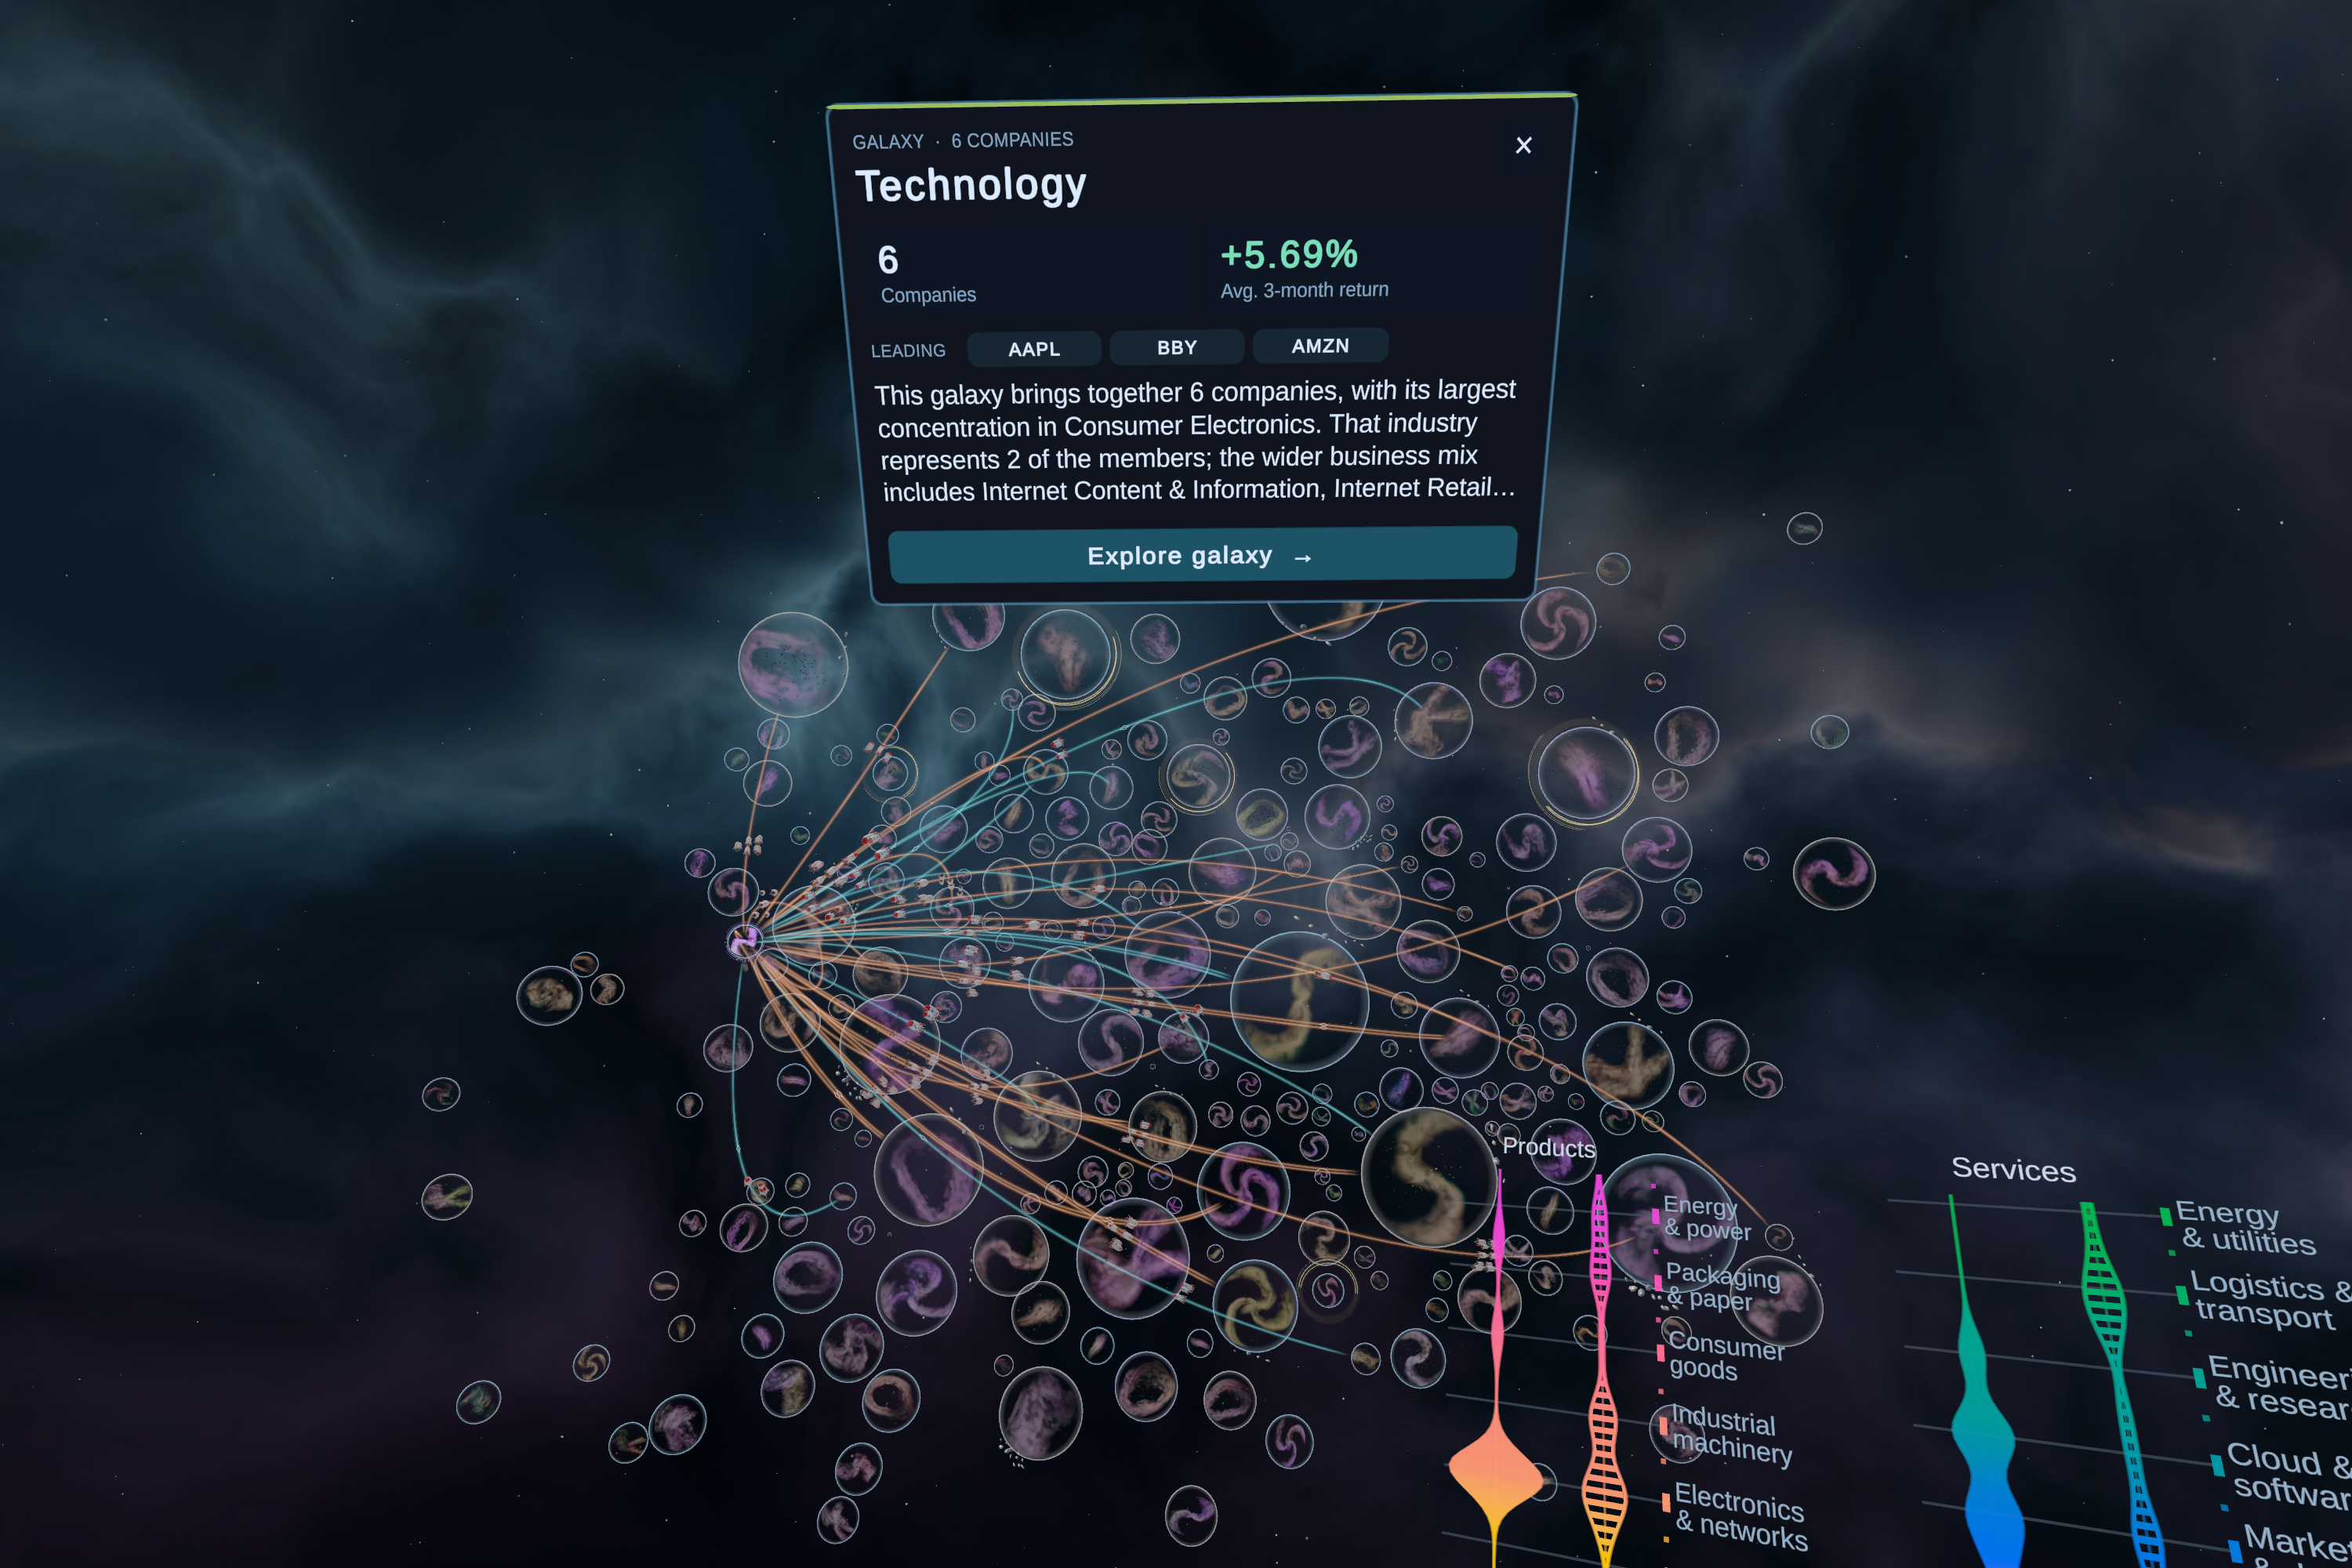
Import/Export trade lanes connect galaxies whose companies have compatible offerings and estimated needs.
A route leads from a group with a relevant product or service toward a group containing companies estimated to need it. Ships and cargo labels give that connection a visible direction and identify the capabilities behind it. Users can inspect the matching companies and categories that support the route.
The lanes represent potential exchanges between business groups. They make it possible to explore where a galaxy's capabilities could be useful elsewhere and which parts of the market could help address its needs.
Investigates interrelated company behavior
The broader MarketScout research engine also examines how companies' returns relate over time. It screens historical lead-lag relationships, estimates directional influence using models constrained by the capability network, and analyzes model-based spillovers among companies.
These methods provide another route for investigating interconnectedness: whether information about one business may help explain or anticipate movements in another. Bringing these results into dedicated Quest views is a planned extension of the current experience.
Connects the network to financial research
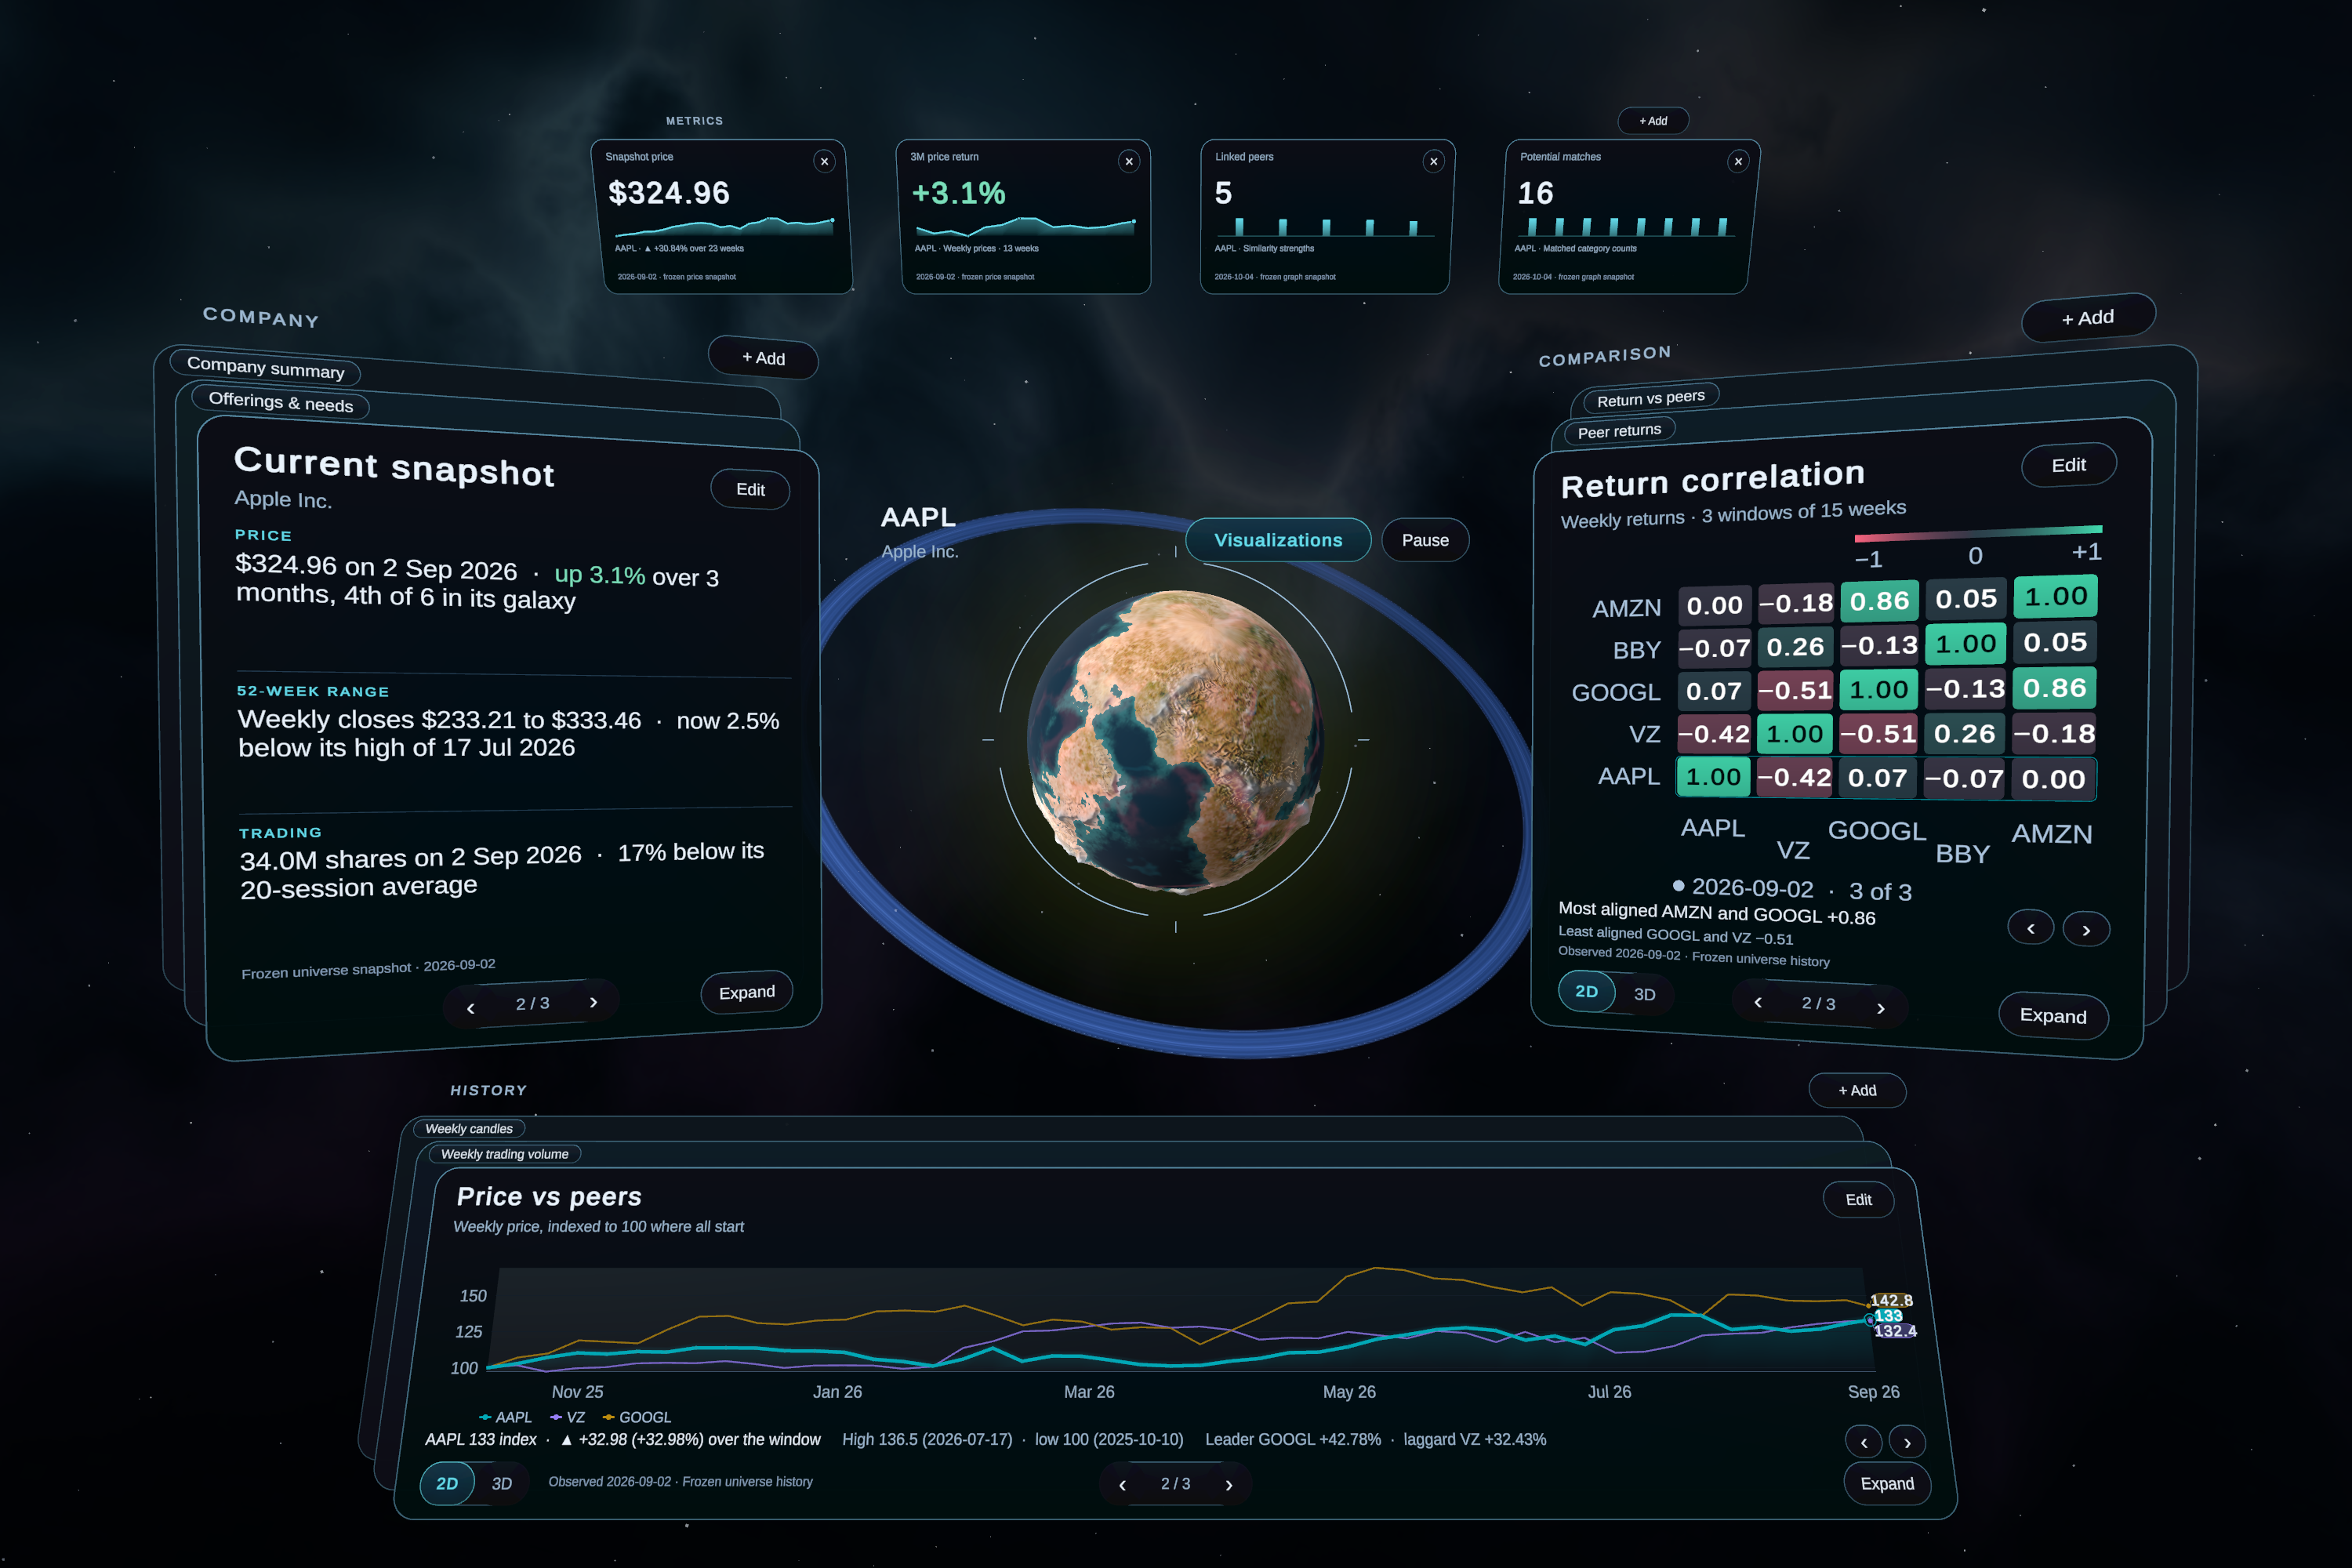
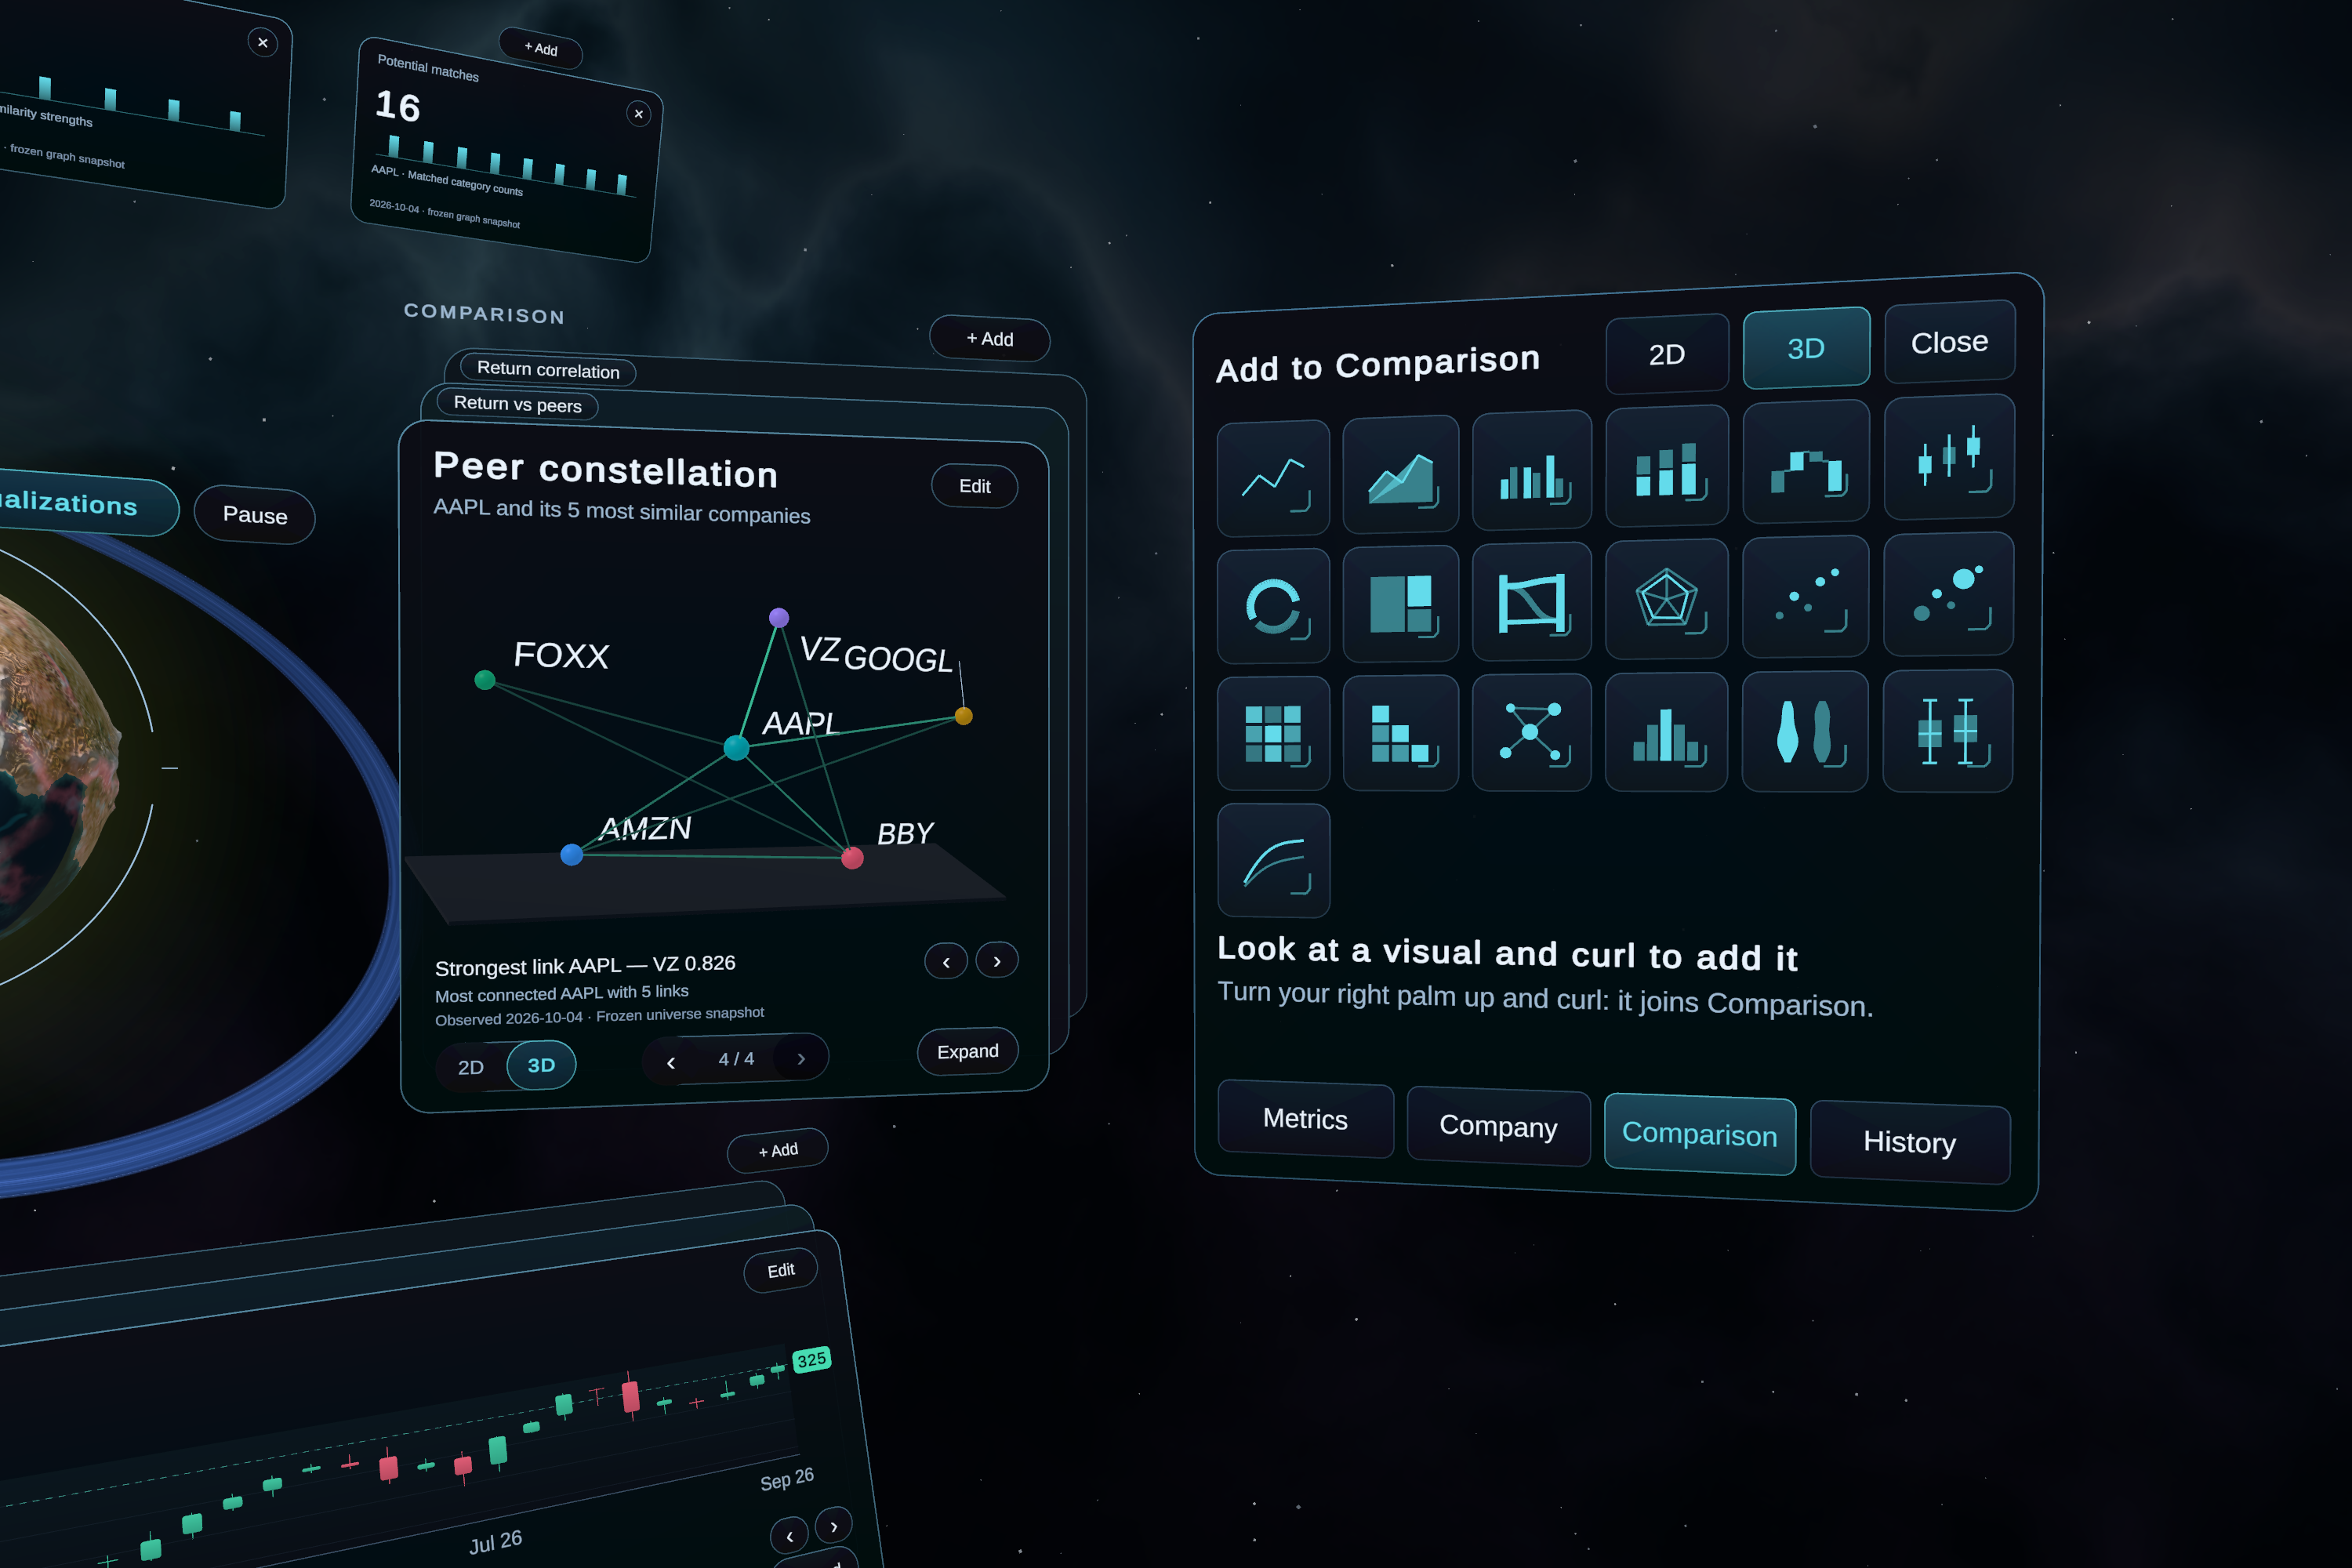
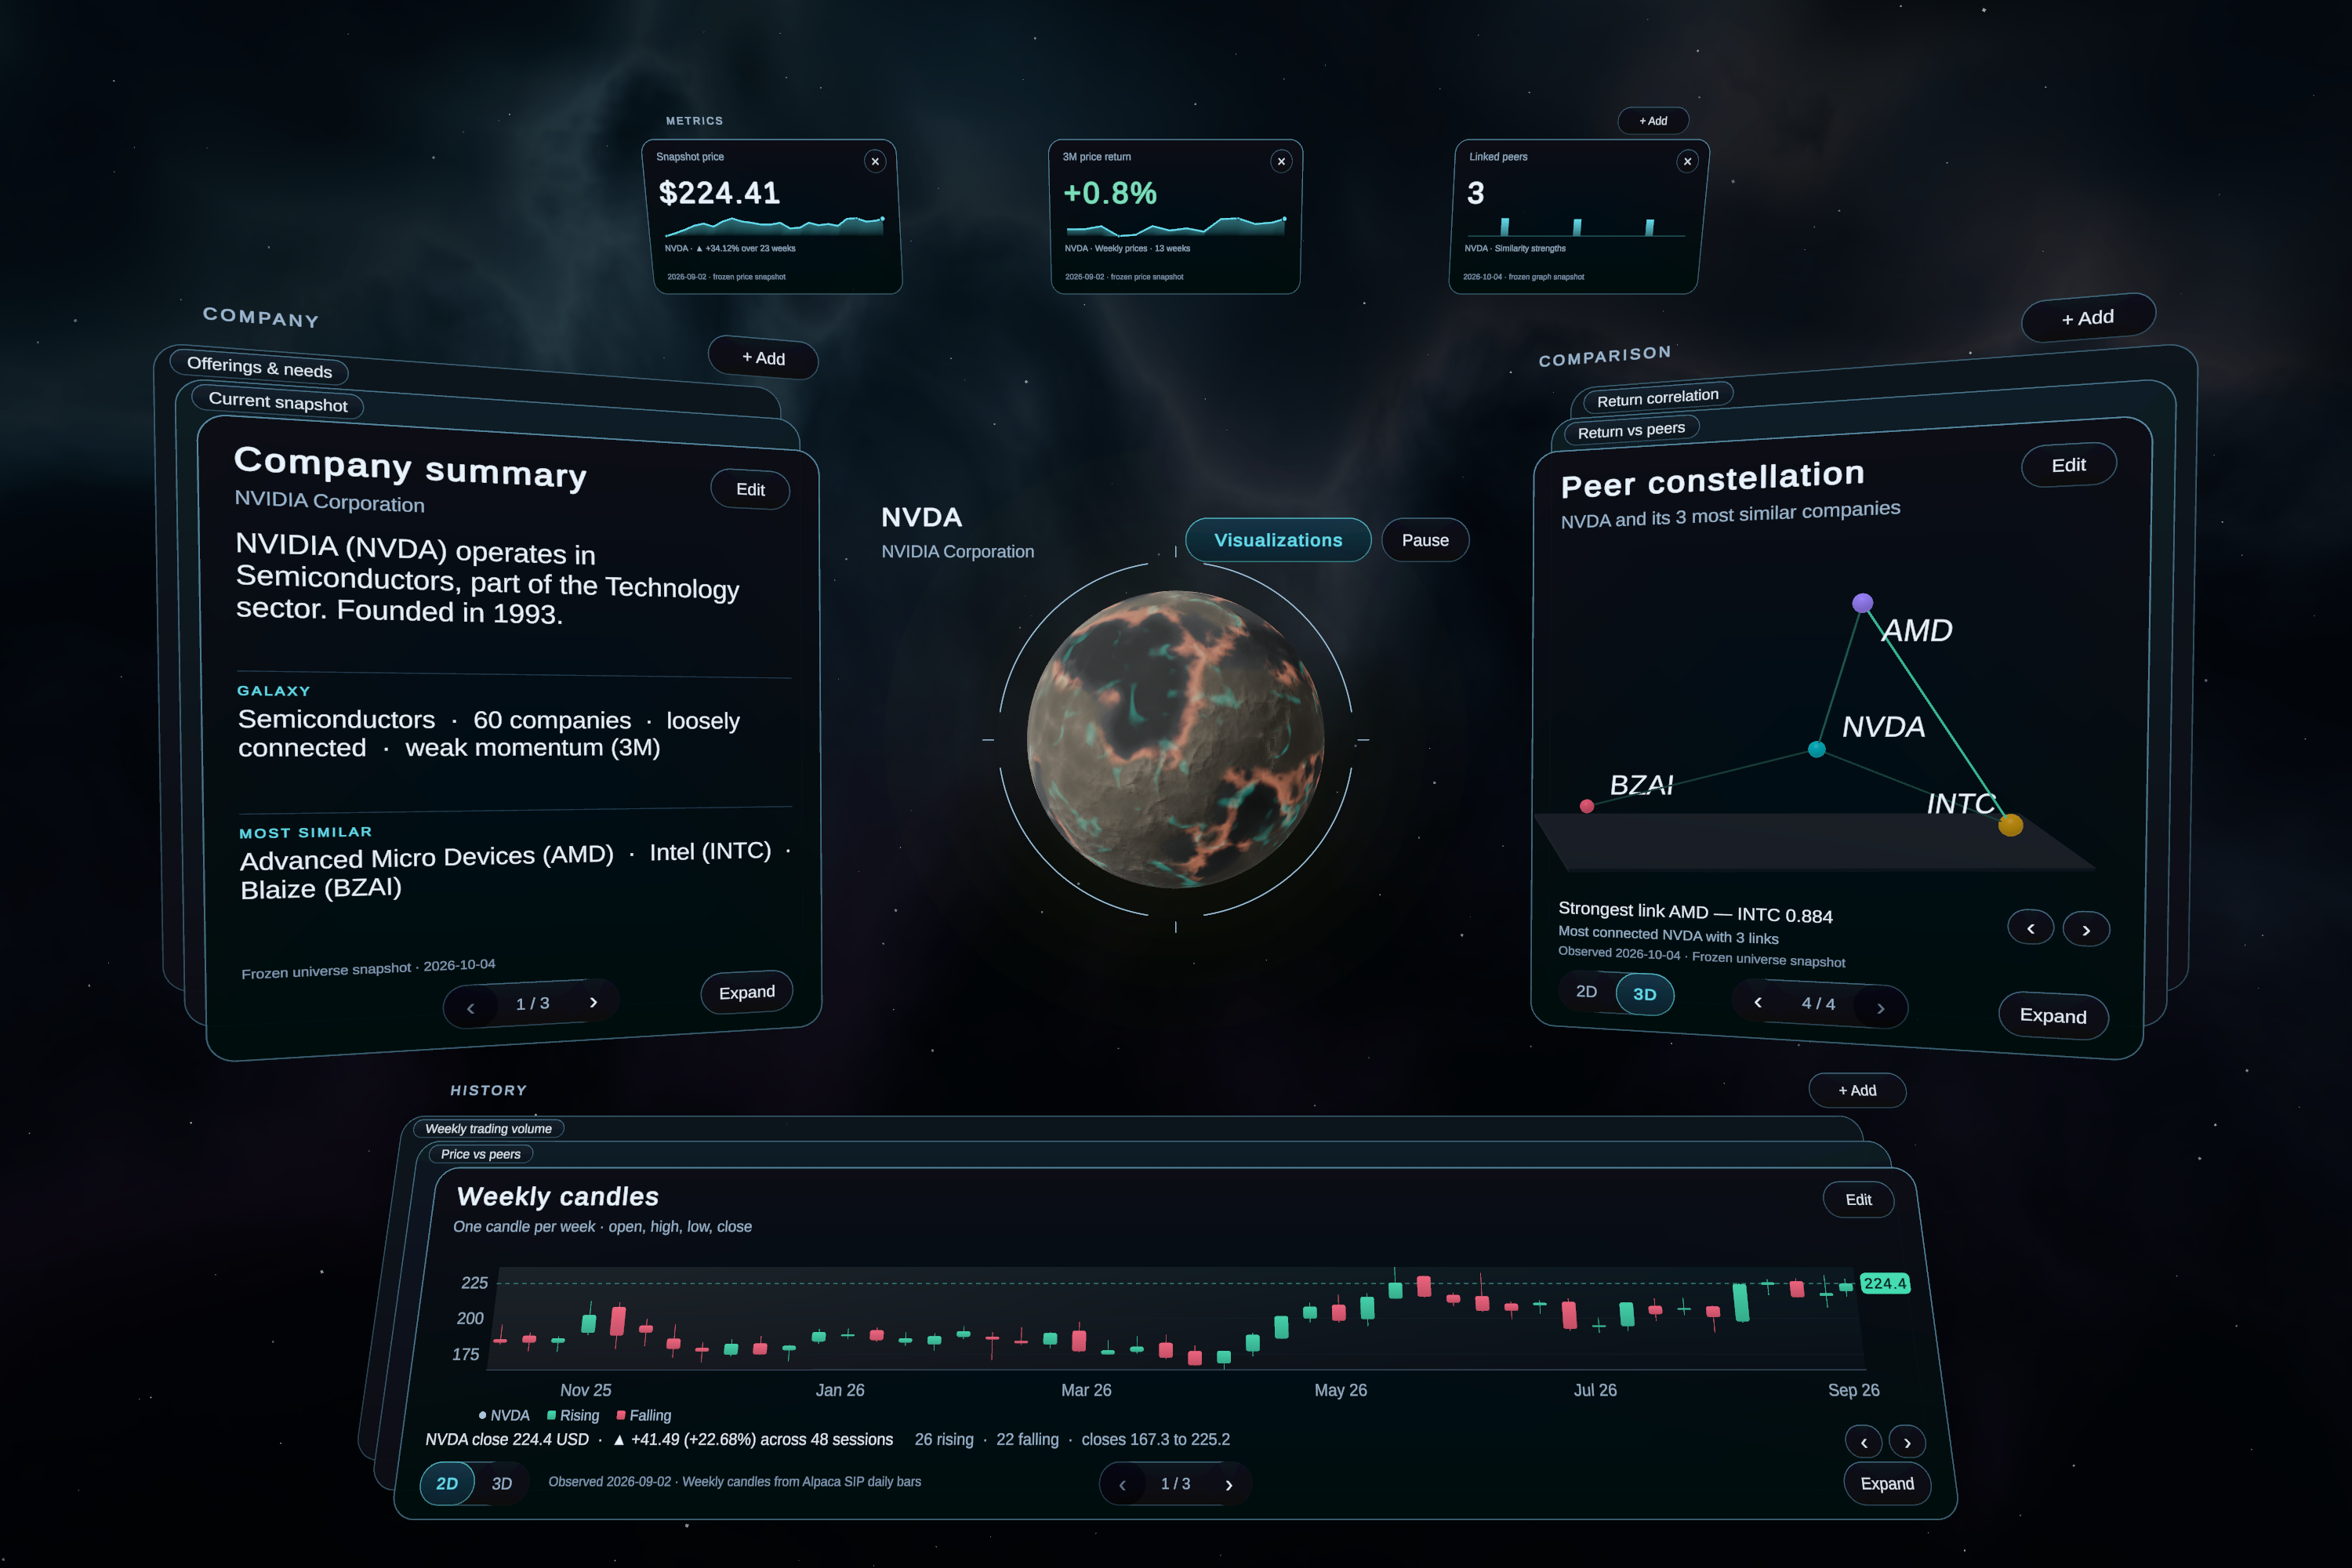
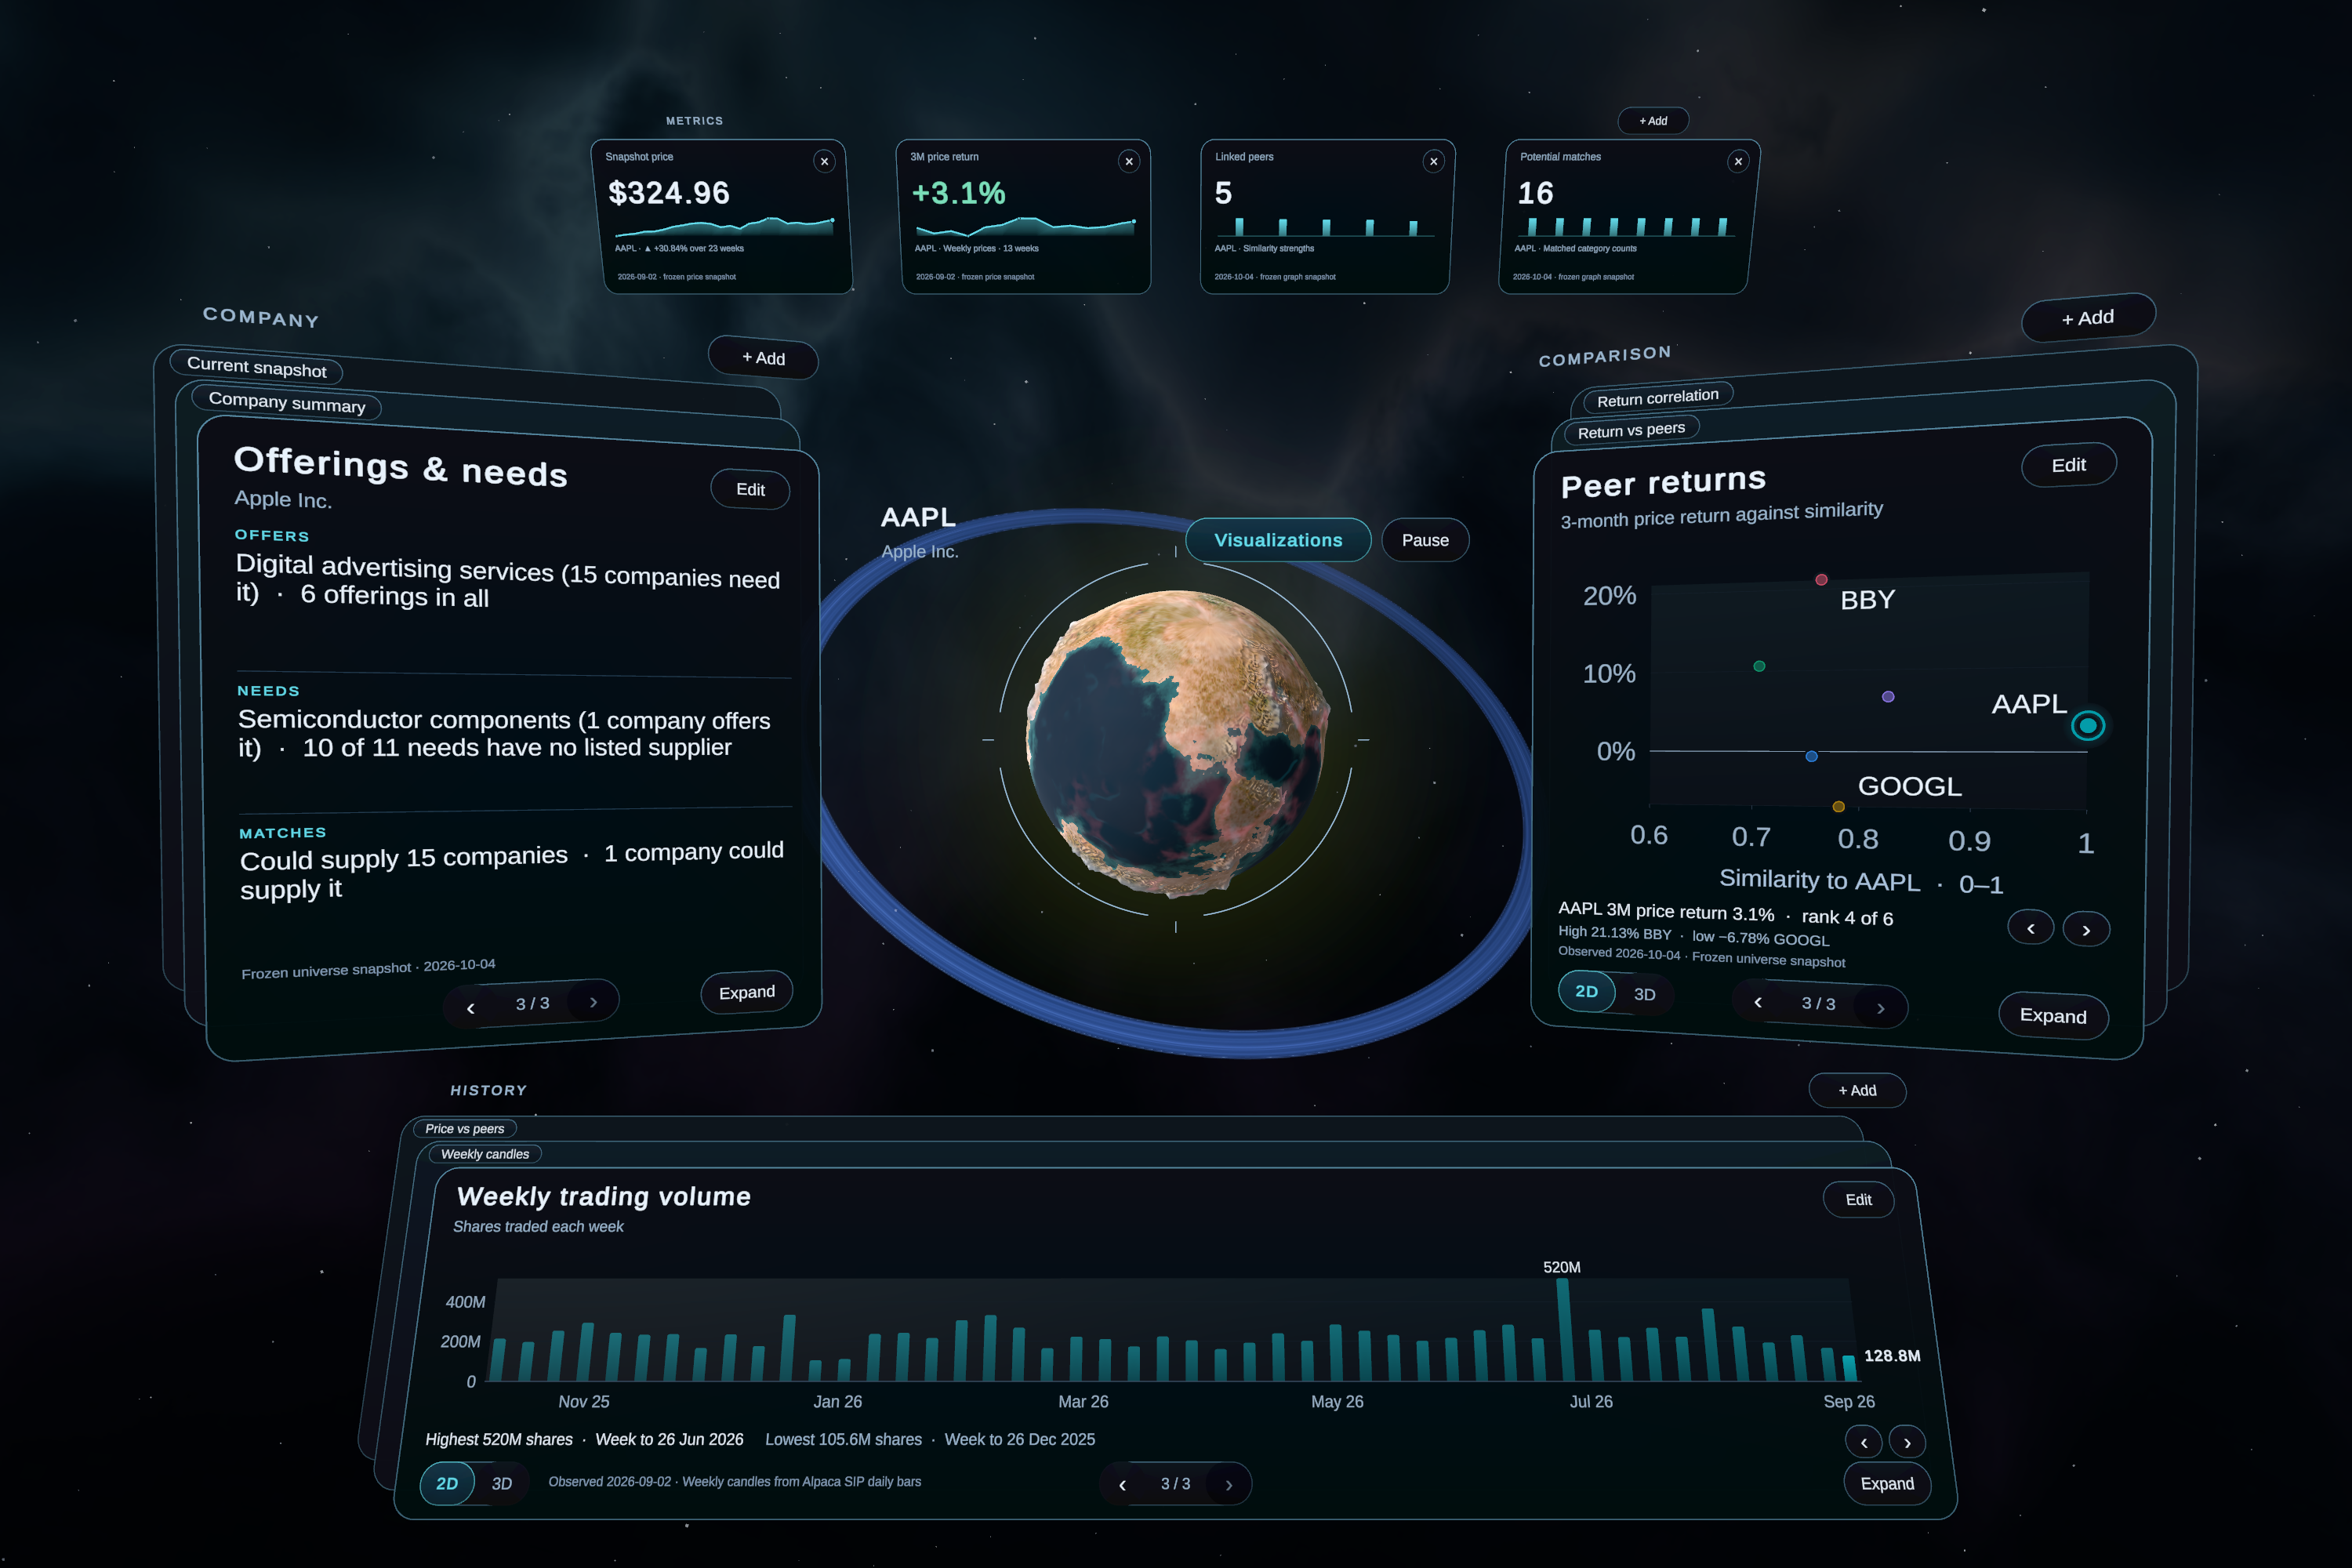
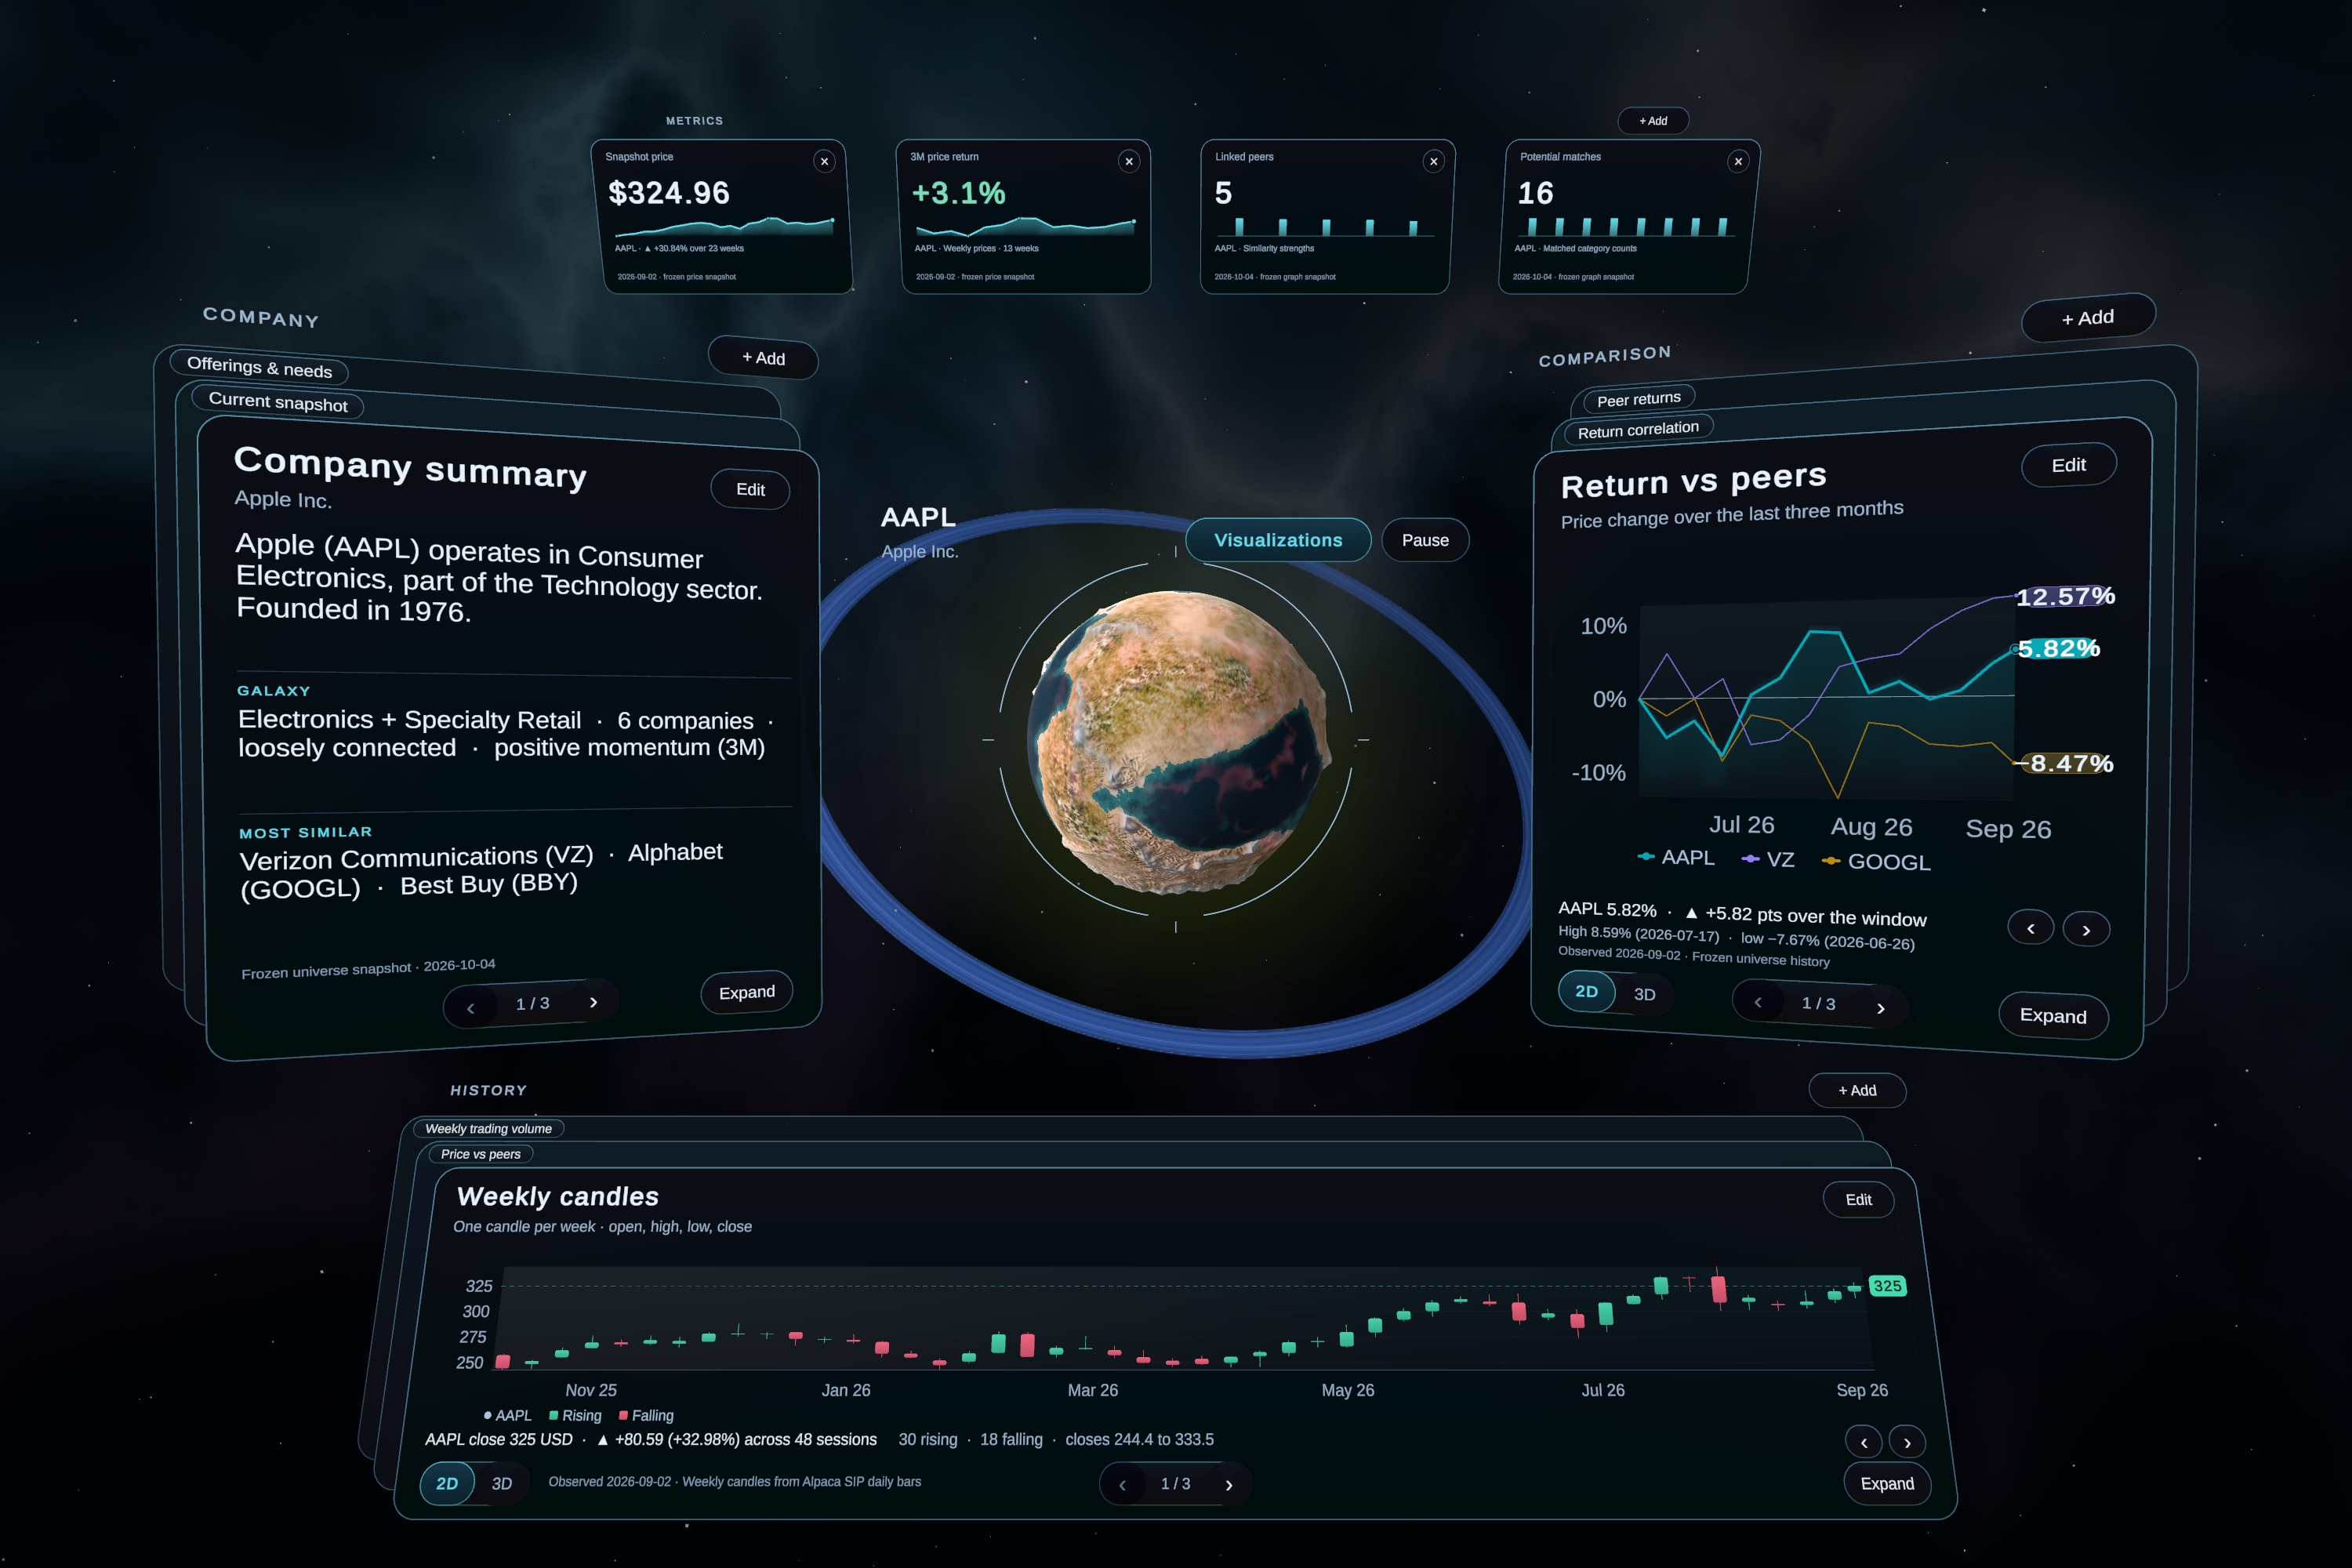
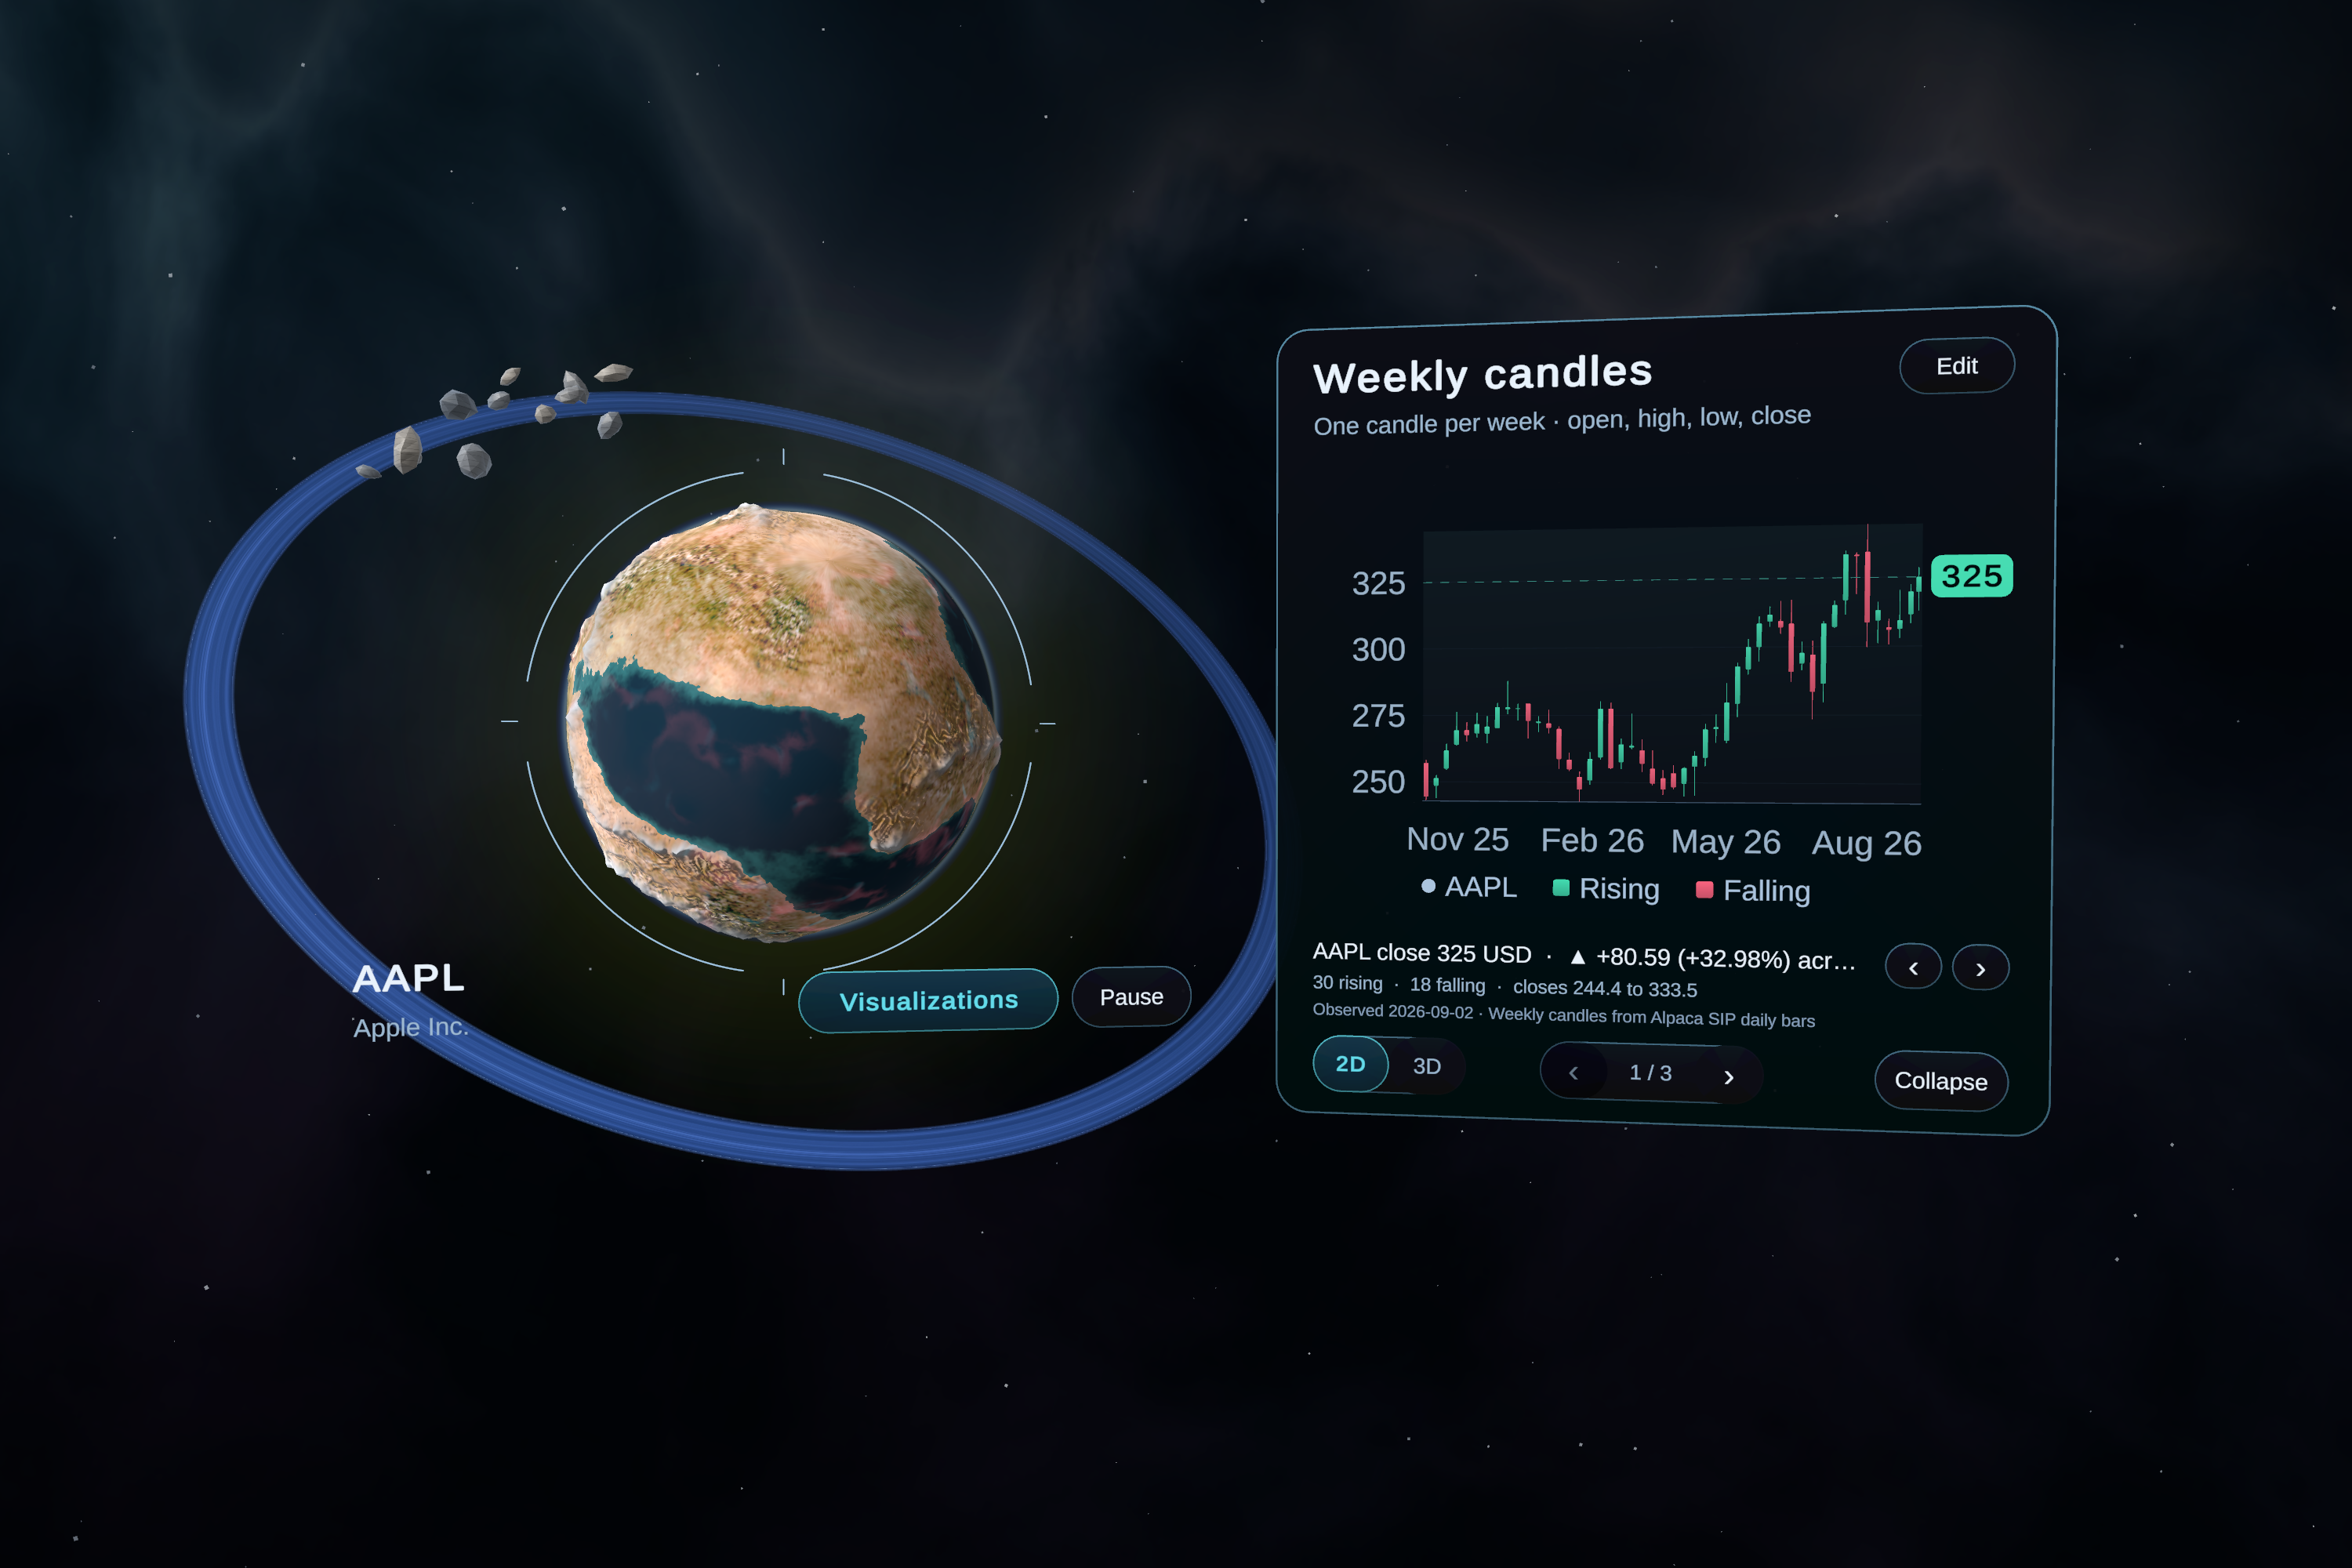
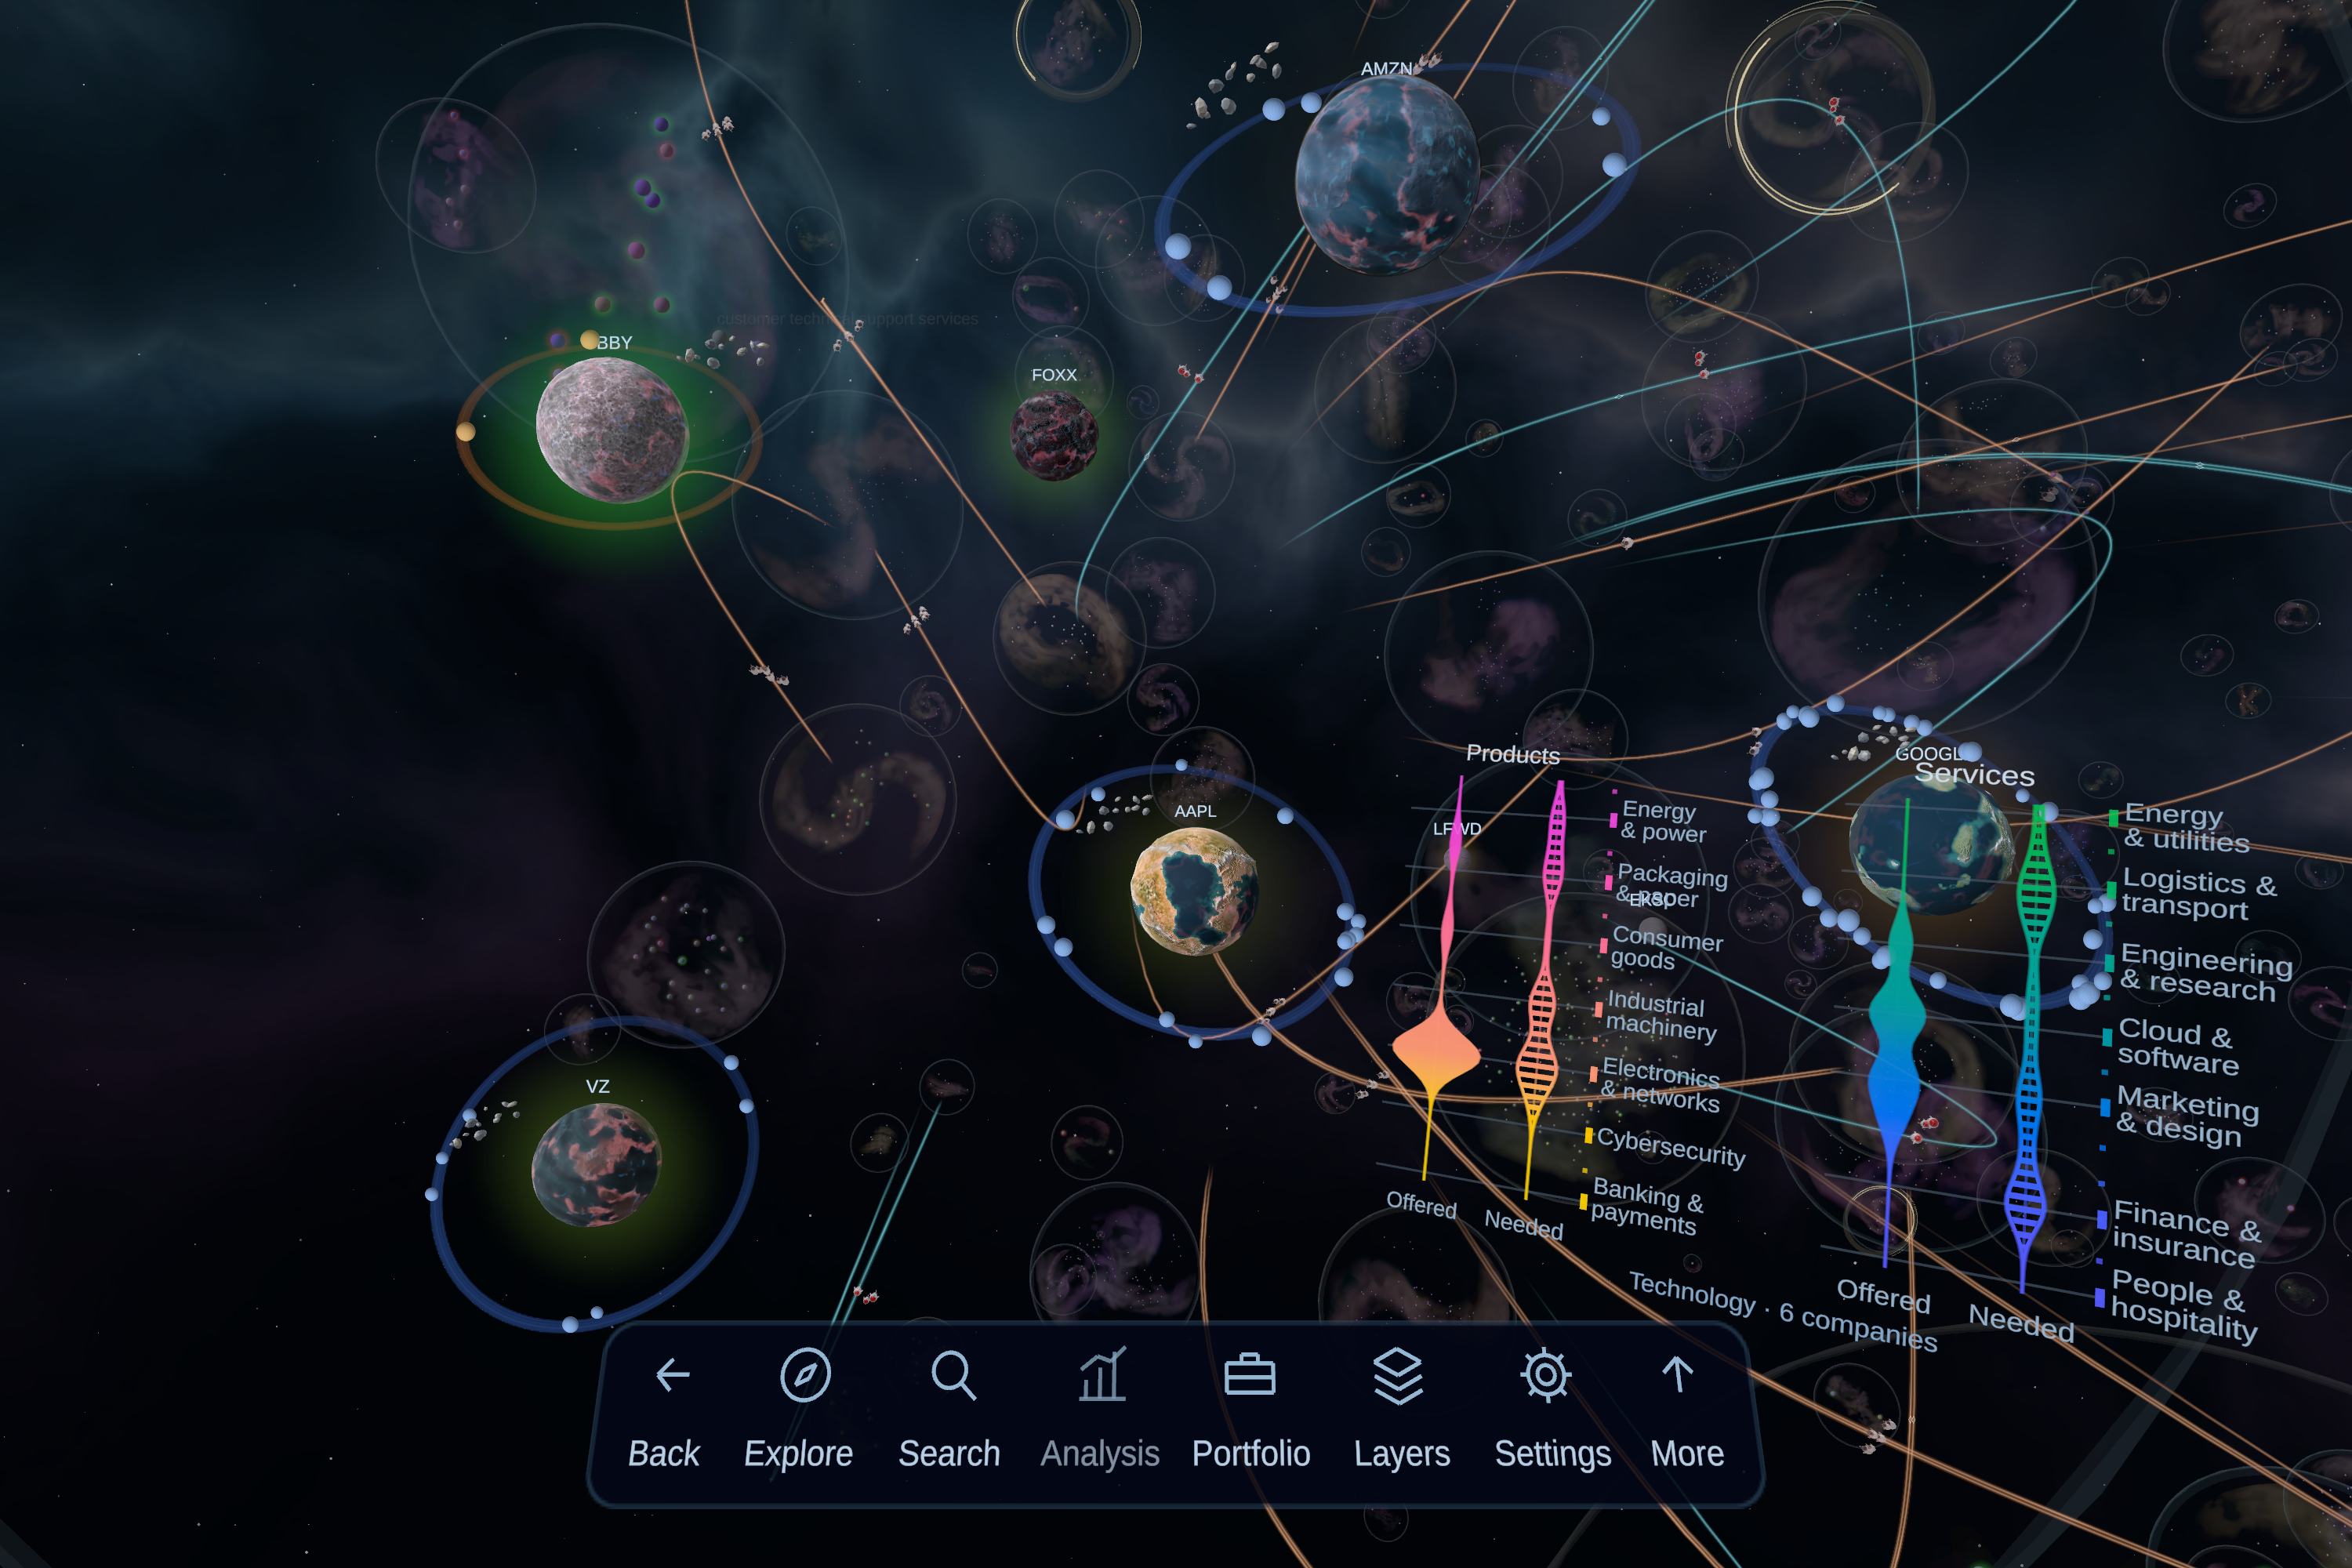
Users can bring a galaxy closer, select a company, and move into its dashboards, then return to the network context that led them there. Company information, historical prices, peer comparisons, and financial metrics help investigate the businesses behind a network pattern.
Where supported filing data is available, planetary characteristics add financial context: growth and cash flow influence the planet family, liquidity shapes ocean coverage, and operating profitability raises mountain ranges or cuts trenches.
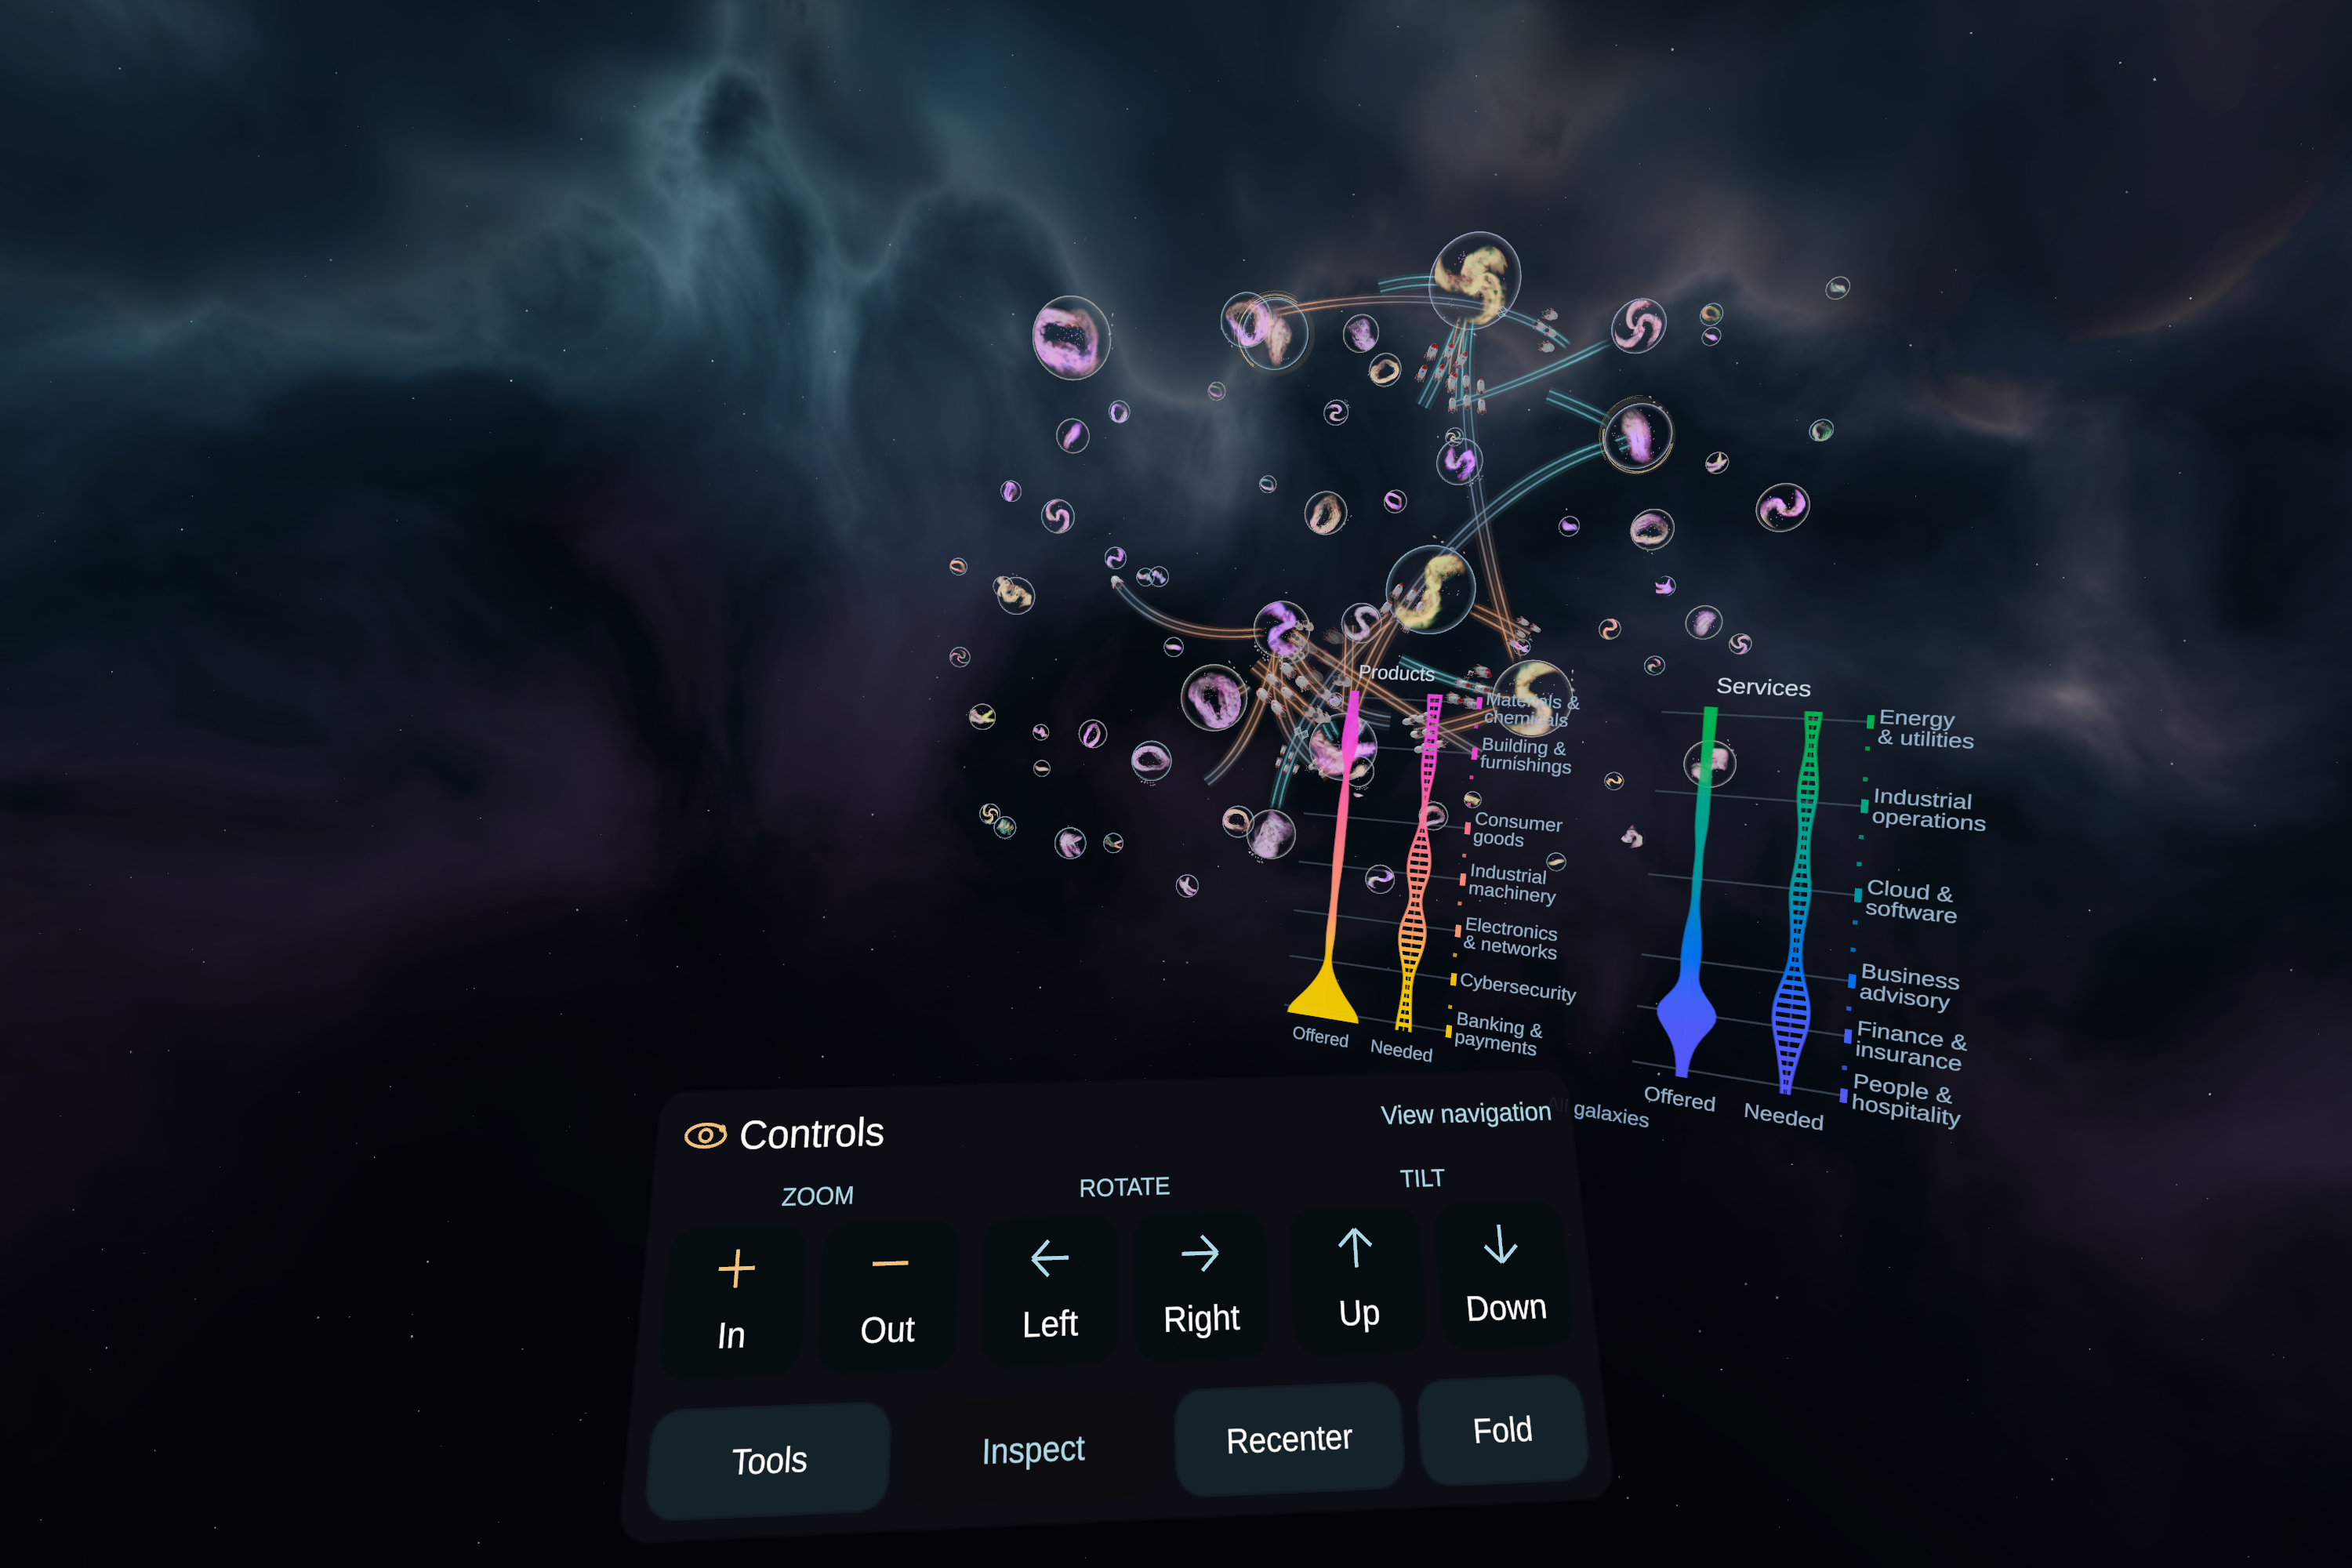
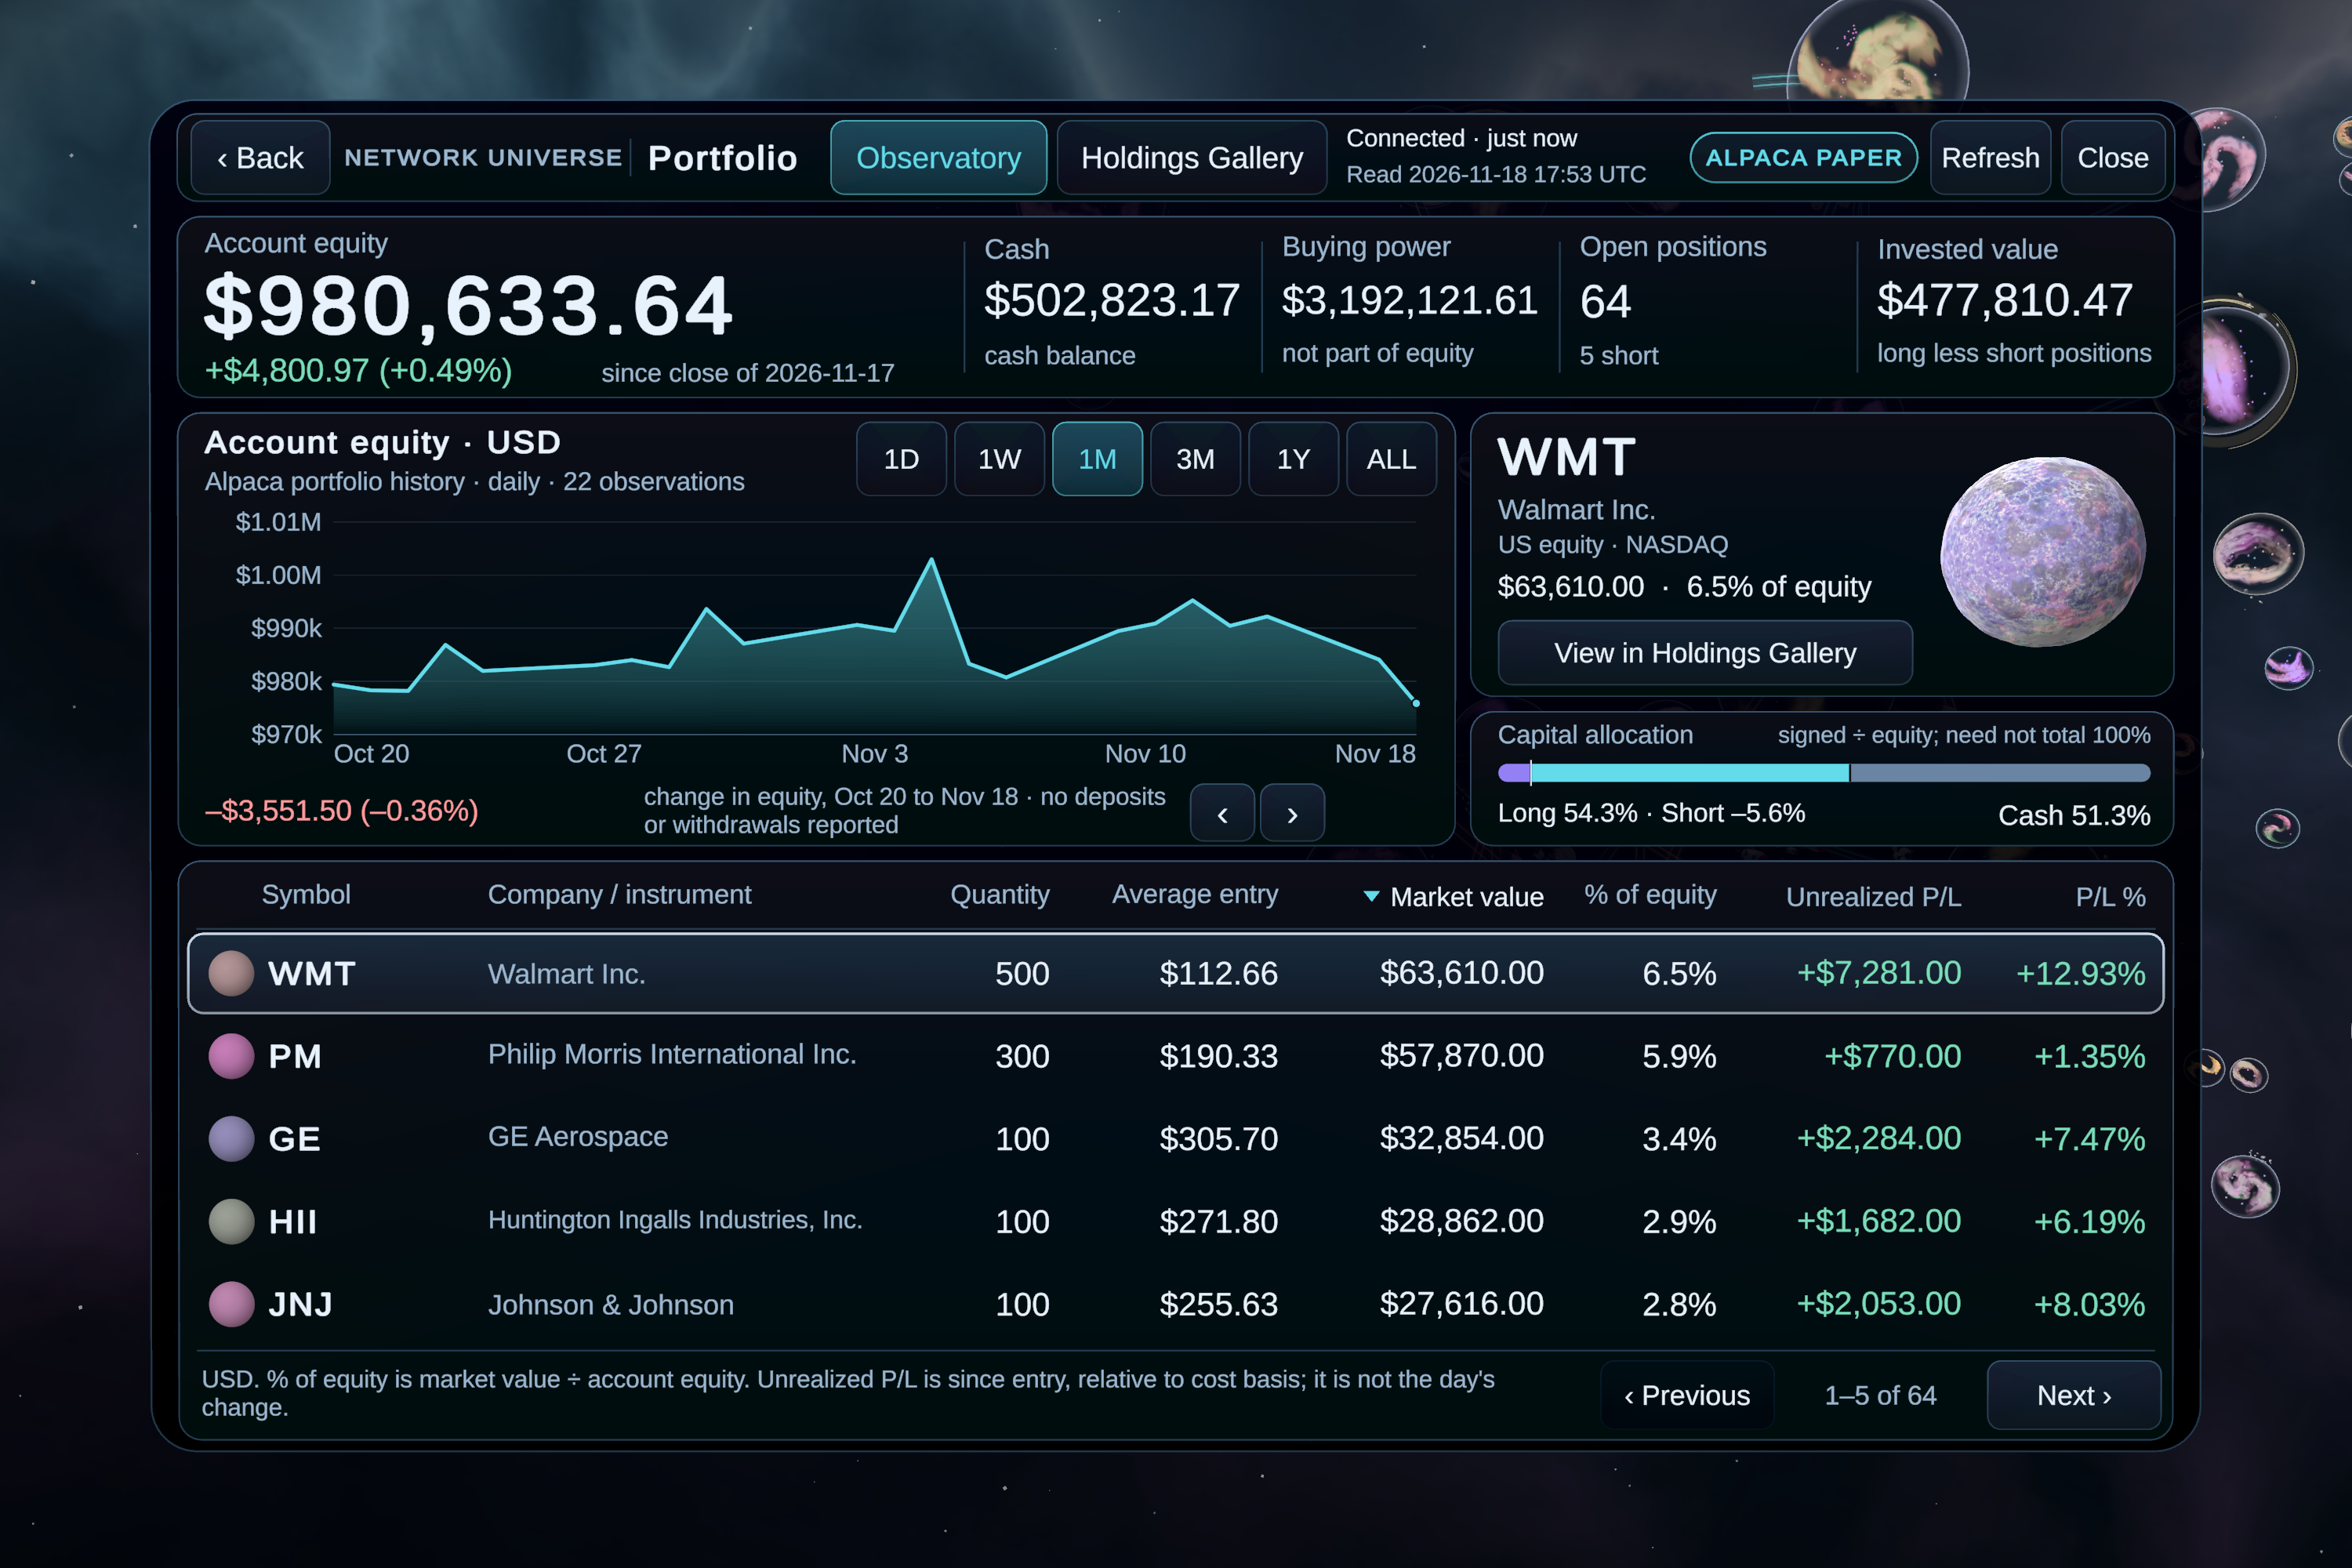
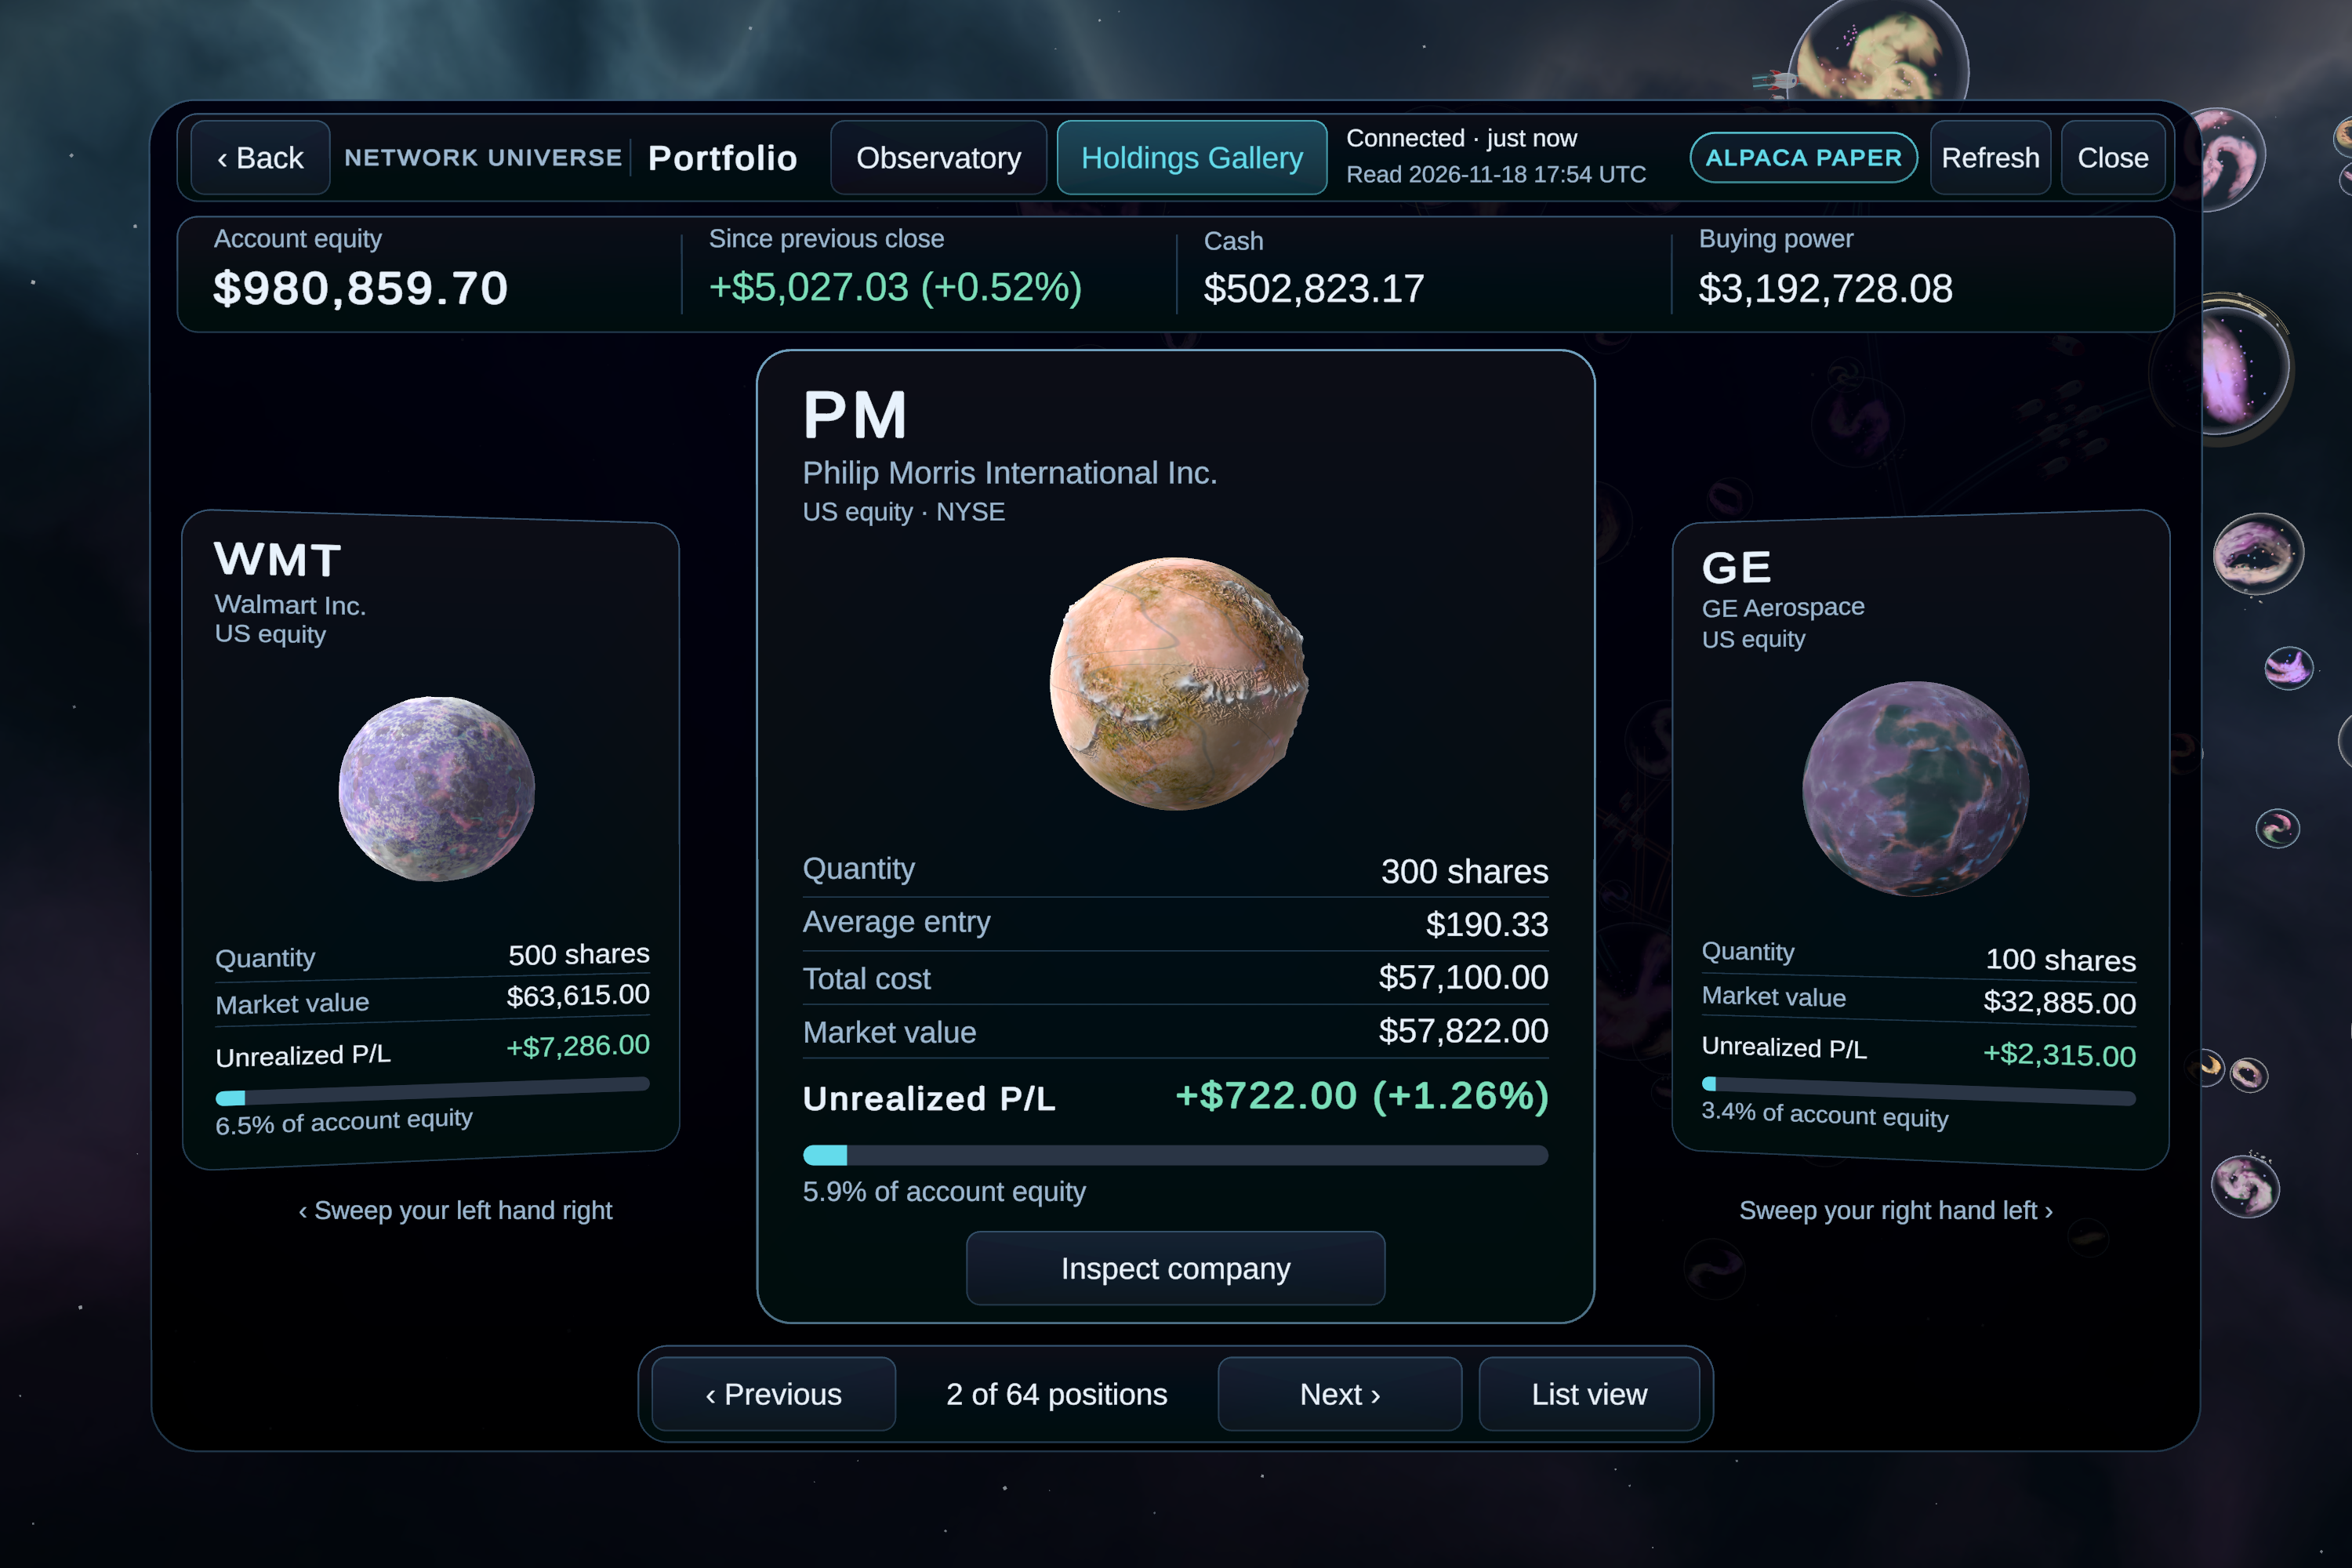
A read-only Alpaca paper portfolio links supported holdings back to their company planets and analysis. Hand gestures control scale, orientation, selection, and navigation from a seated position.
MarketScout's distinctive contribution is the connected workflow: start with the structure of business capabilities and needs, follow a potential relationship, and investigate the companies and financial evidence behind it.
How we built it
The analytical foundation came first.
In the upstream MarketScout system, I used Python tooling and language-model-assisted extraction to turn company website content and business summaries into structured profiles. Those profiles separate products offered, services offered, products needed, and services needed. Standardizing the language makes companies comparable even when they describe similar capabilities differently.
I used semantic embeddings of company offerings to construct a similarity graph, then graph-based community detection to identify business clusters. Estimated needs form a separate layer: matching product categories to product needs, and service categories to service needs, generates potential provider-and-recipient connections.
The upstream research engine extends the analysis with ElasticNet models constrained by the capability graph, alongside vector autoregression and variance decomposition. These methods produce statistical estimates of directional relationships and spillovers that can be evaluated across time and market conditions.
The Quest application brings the capability network and company research into Unity and C#. I packaged the analytical results into a validated, dated dataset, preserving company identities, cluster memberships, categories, and relationships. This gives the standalone viewer a stable analytical foundation. Extending the VR experience to expose more of the upstream influence and spillover analysis is a major next step.
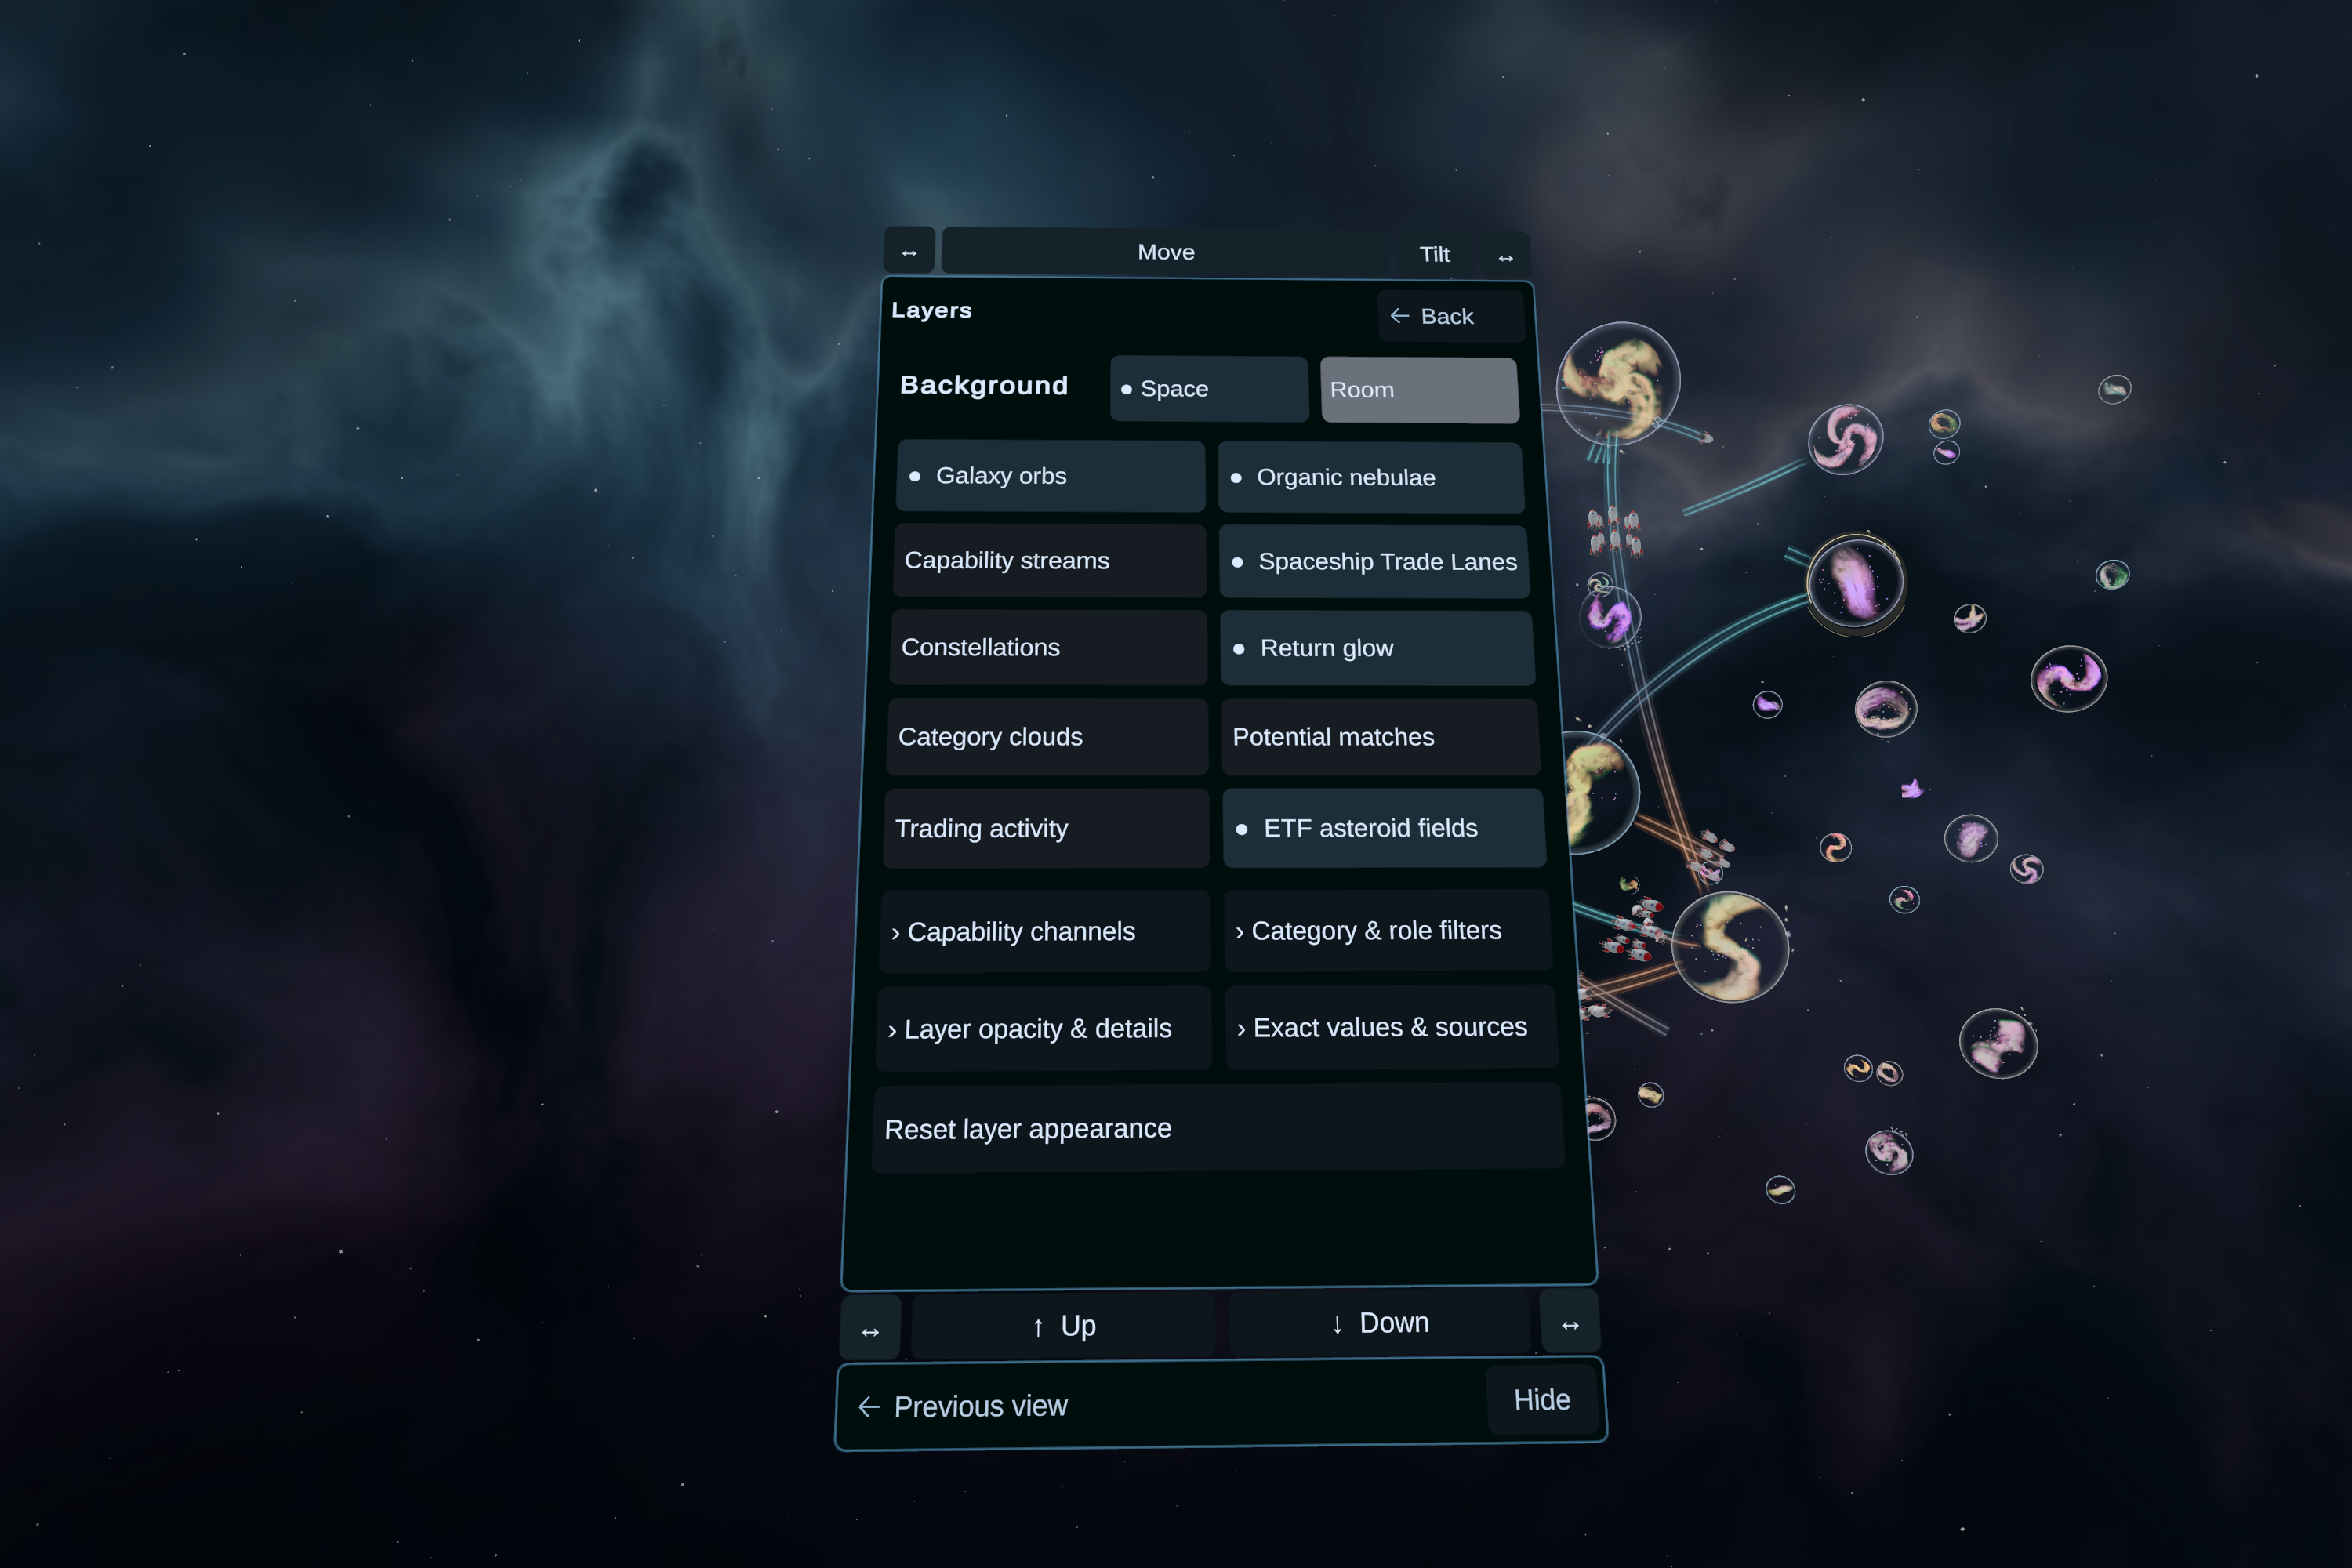
Custom rendering and interaction systems translate the data into galaxies, planets, capability layers, trade lanes, and dashboards. Meta Quest hand tracking and OpenXR support navigation, while Space Graphics Planets, Space Graphics Toolkit, Shapes, and All In 1 VFX contribute to the visual foundation.
Throughout development, I used source control, screenshots, and headset recordings to refine how the analysis, visual presentation, and interaction worked together.
Challenges we ran into
The first major challenge was turning inconsistent descriptions of businesses into meaningful comparisons.
Companies use different terminology, brand names, levels of detail, and marketing language. A useful network depends on recognizing comparable capabilities while retaining distinctions that matter. The quality of the resulting galaxies begins with the quality of those company profiles.
Estimated needs introduced another challenge. An inferred operational requirement has a different evidential basis from an extracted offering. Keeping that distinction visible is essential when examining potential opportunity. Missing information also needs to remain recognizable so that a gap in the dataset does not silently become a claim about the economy.
The network itself created a visual challenge. Showing relationships across the market can quickly become overwhelming. I had to balance the wider structure with focused inspection, preserve the direction and meaning of connections, and keep supporting evidence accessible as visual detail changed.
Hand interaction demanded repeated refinement. Users need to manipulate the universe deliberately, select the intended company, and then lower their hands to read and think. Accidental activation, unclear feedback, panel placement, and text readability all affected whether the analytical experience was usable.
These challenges reinforced a common requirement: every layer, from extraction to a gesture in the headset, has to preserve the user's understanding of what they are investigating.
Accomplishments that we're proud of
I am most proud of building a market representation whose structure comes from the capabilities of the businesses within it.
Company extraction, semantic similarity, clustering, and estimated-need matching now connect into a research workflow. Galaxies give the capability network an understandable form, while Import/Export trade lanes turn potential relationships between business groups into something users can follow and inspect.
That opens several complementary directions for discovery: competitive overlap, concentrations of need, potential providers, and connections between otherwise distant parts of the market. The upstream temporal and influence analyses add another foundation for investigating how related companies behave over time.
I am also proud of connecting that broad view to individual company research. A user can begin with a pattern across galaxies and move toward the company, category, and financial information behind it.
Bringing this into a hands-first Meta Quest experience required data science, financial analysis, visual design, and interaction engineering to develop together. The result expresses the central idea of MarketScout: understanding a business includes understanding the network around it.
What we learned
I learned that "related companies" can mean several different things. Businesses may resemble one another through their offerings, complement one another through potential exchange, or show statistical relationships over time. Keeping those relationships distinct is essential to making the universe useful for research.
The VR work taught me that exploration needs both movement and stillness. Spatial interaction helps users follow a relationship, but a research workspace also has to let them stop, compare evidence, and think.
The most important lesson is that analytical depth and visual clarity have to advance together. Every new model or visualization should help someone ask a better question, inspect its evidence, or understand an answer more clearly.
What's next for MarketScout
The next phase will deepen the analytical model and develop original VR/AR visualizations that make its relationships, opportunities, and uncertainties easier to investigate.
Strengthen analysis of saturation, needs, and opportunity
I want to research how offering concentration, estimated needs, provider coverage, financial capacity, and evidence quality can support more meaningful measures of competitive intensity and potential market gaps.
That includes evaluating need estimates against additional evidence, expanding company coverage, improving category consistency, and studying how clusters change over time.
The goal is to move from identifying a promising pattern to explaining why it matters: which companies contribute to it, how reliable the evidence is, what alternative explanations exist, and what additional information could confirm or challenge the opportunity.
Deepen analysis of interrelated company effects
I will build on the existing lead-lag, influence, and spillover analyses to investigate shared exposure, directional relationships, and the ways changes in one part of the market may affect related businesses.
Research will focus on evaluating those relationships across time, separating common market forces from company-specific signals, and testing whether the capability network improves forecasting and scenario analysis.
I also want to develop scenarios around changes in business needs, competition, and financial conditions. The ambition is to help users investigate both the companies directly involved and the wider groups that may share exposure, with assumptions and uncertainty available for inspection.
Create entirely new visualizations for VR and AR
I want to develop custom visual forms around the distinctive properties of spatial computing: depth, perspective, scale, direct manipulation, and persistent spatial context.
Research directions include:
- Capability and need landscapes: coordinated views that let users explore concentrations of offerings alongside estimated needs, then trace each pattern to its contributing companies.
- Interactive trade corridors: routes that can be isolated and expanded to compare potential providers, receiving companies, category coverage, and alternative connections.
- Influence and spillover views: temporal representations that distinguish business similarity from estimated financial influence and let users inspect direction, lag, strength, and uncertainty.
- Spatial scenario comparisons: a baseline market structure held in place while alternative assumptions and outcomes are pulled into the surrounding space for comparison.
- Portfolio and options analysis: visualizations that connect holdings to shared business exposures and let users explore modeled outcomes across price, time, and volatility.
- AR research workspaces: company groups, routes, and comparison views anchored around a real desk, preserving context as an investigation develops.
I will evaluate these designs against clear conventional charts and network views, measuring comprehension, comparison accuracy, interpretation errors, task completion, and comfort. The aim is to establish where spatial interaction provides a meaningful analytical advantage.
Refine the frontend and research experience
I will continue improving the transition from market discovery to company inspection: clearer visual hierarchy, better labels and legends, more readable dashboards, predictable hand interactions, and easier navigation between related evidence.
Onboarding, accessibility, performance, and the ability to return to a previous research context will remain central. The experience should support a sustained investigation as well as an engaging first encounter.
Connect research with equities and options trading
A further stage is to connect the Quest research experience with equities and options trading, beginning with paper-trading execution.
Users should be able to develop an idea from the network, investigate the companies involved, evaluate portfolio exposure and alternative outcomes, and review an order within the same research context.
Options workflows will need clear contract details, strategy structure, modeled payoffs, and sensitivity to changing conditions. Real-account execution would follow through a separate integration with deliberate order review and confirmation.
My ambition is for MarketScout to become a spatial research platform for understanding how the market fits together: what companies provide, what they may need, where opportunity could exist, and how their relationships shape the questions we should ask next.
