-
-
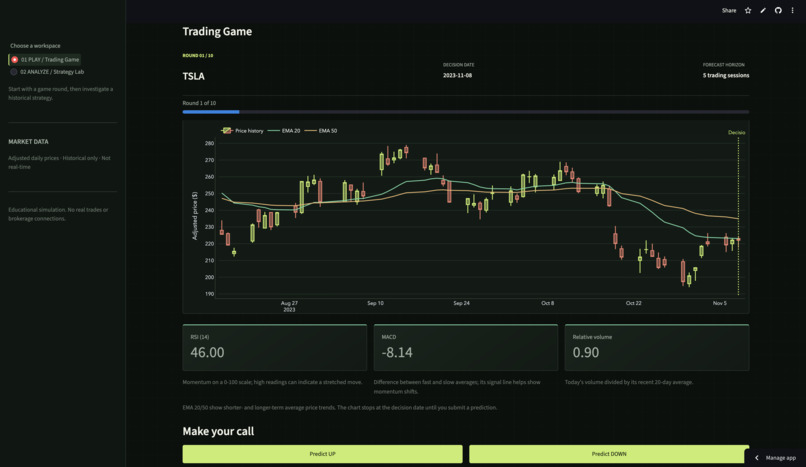
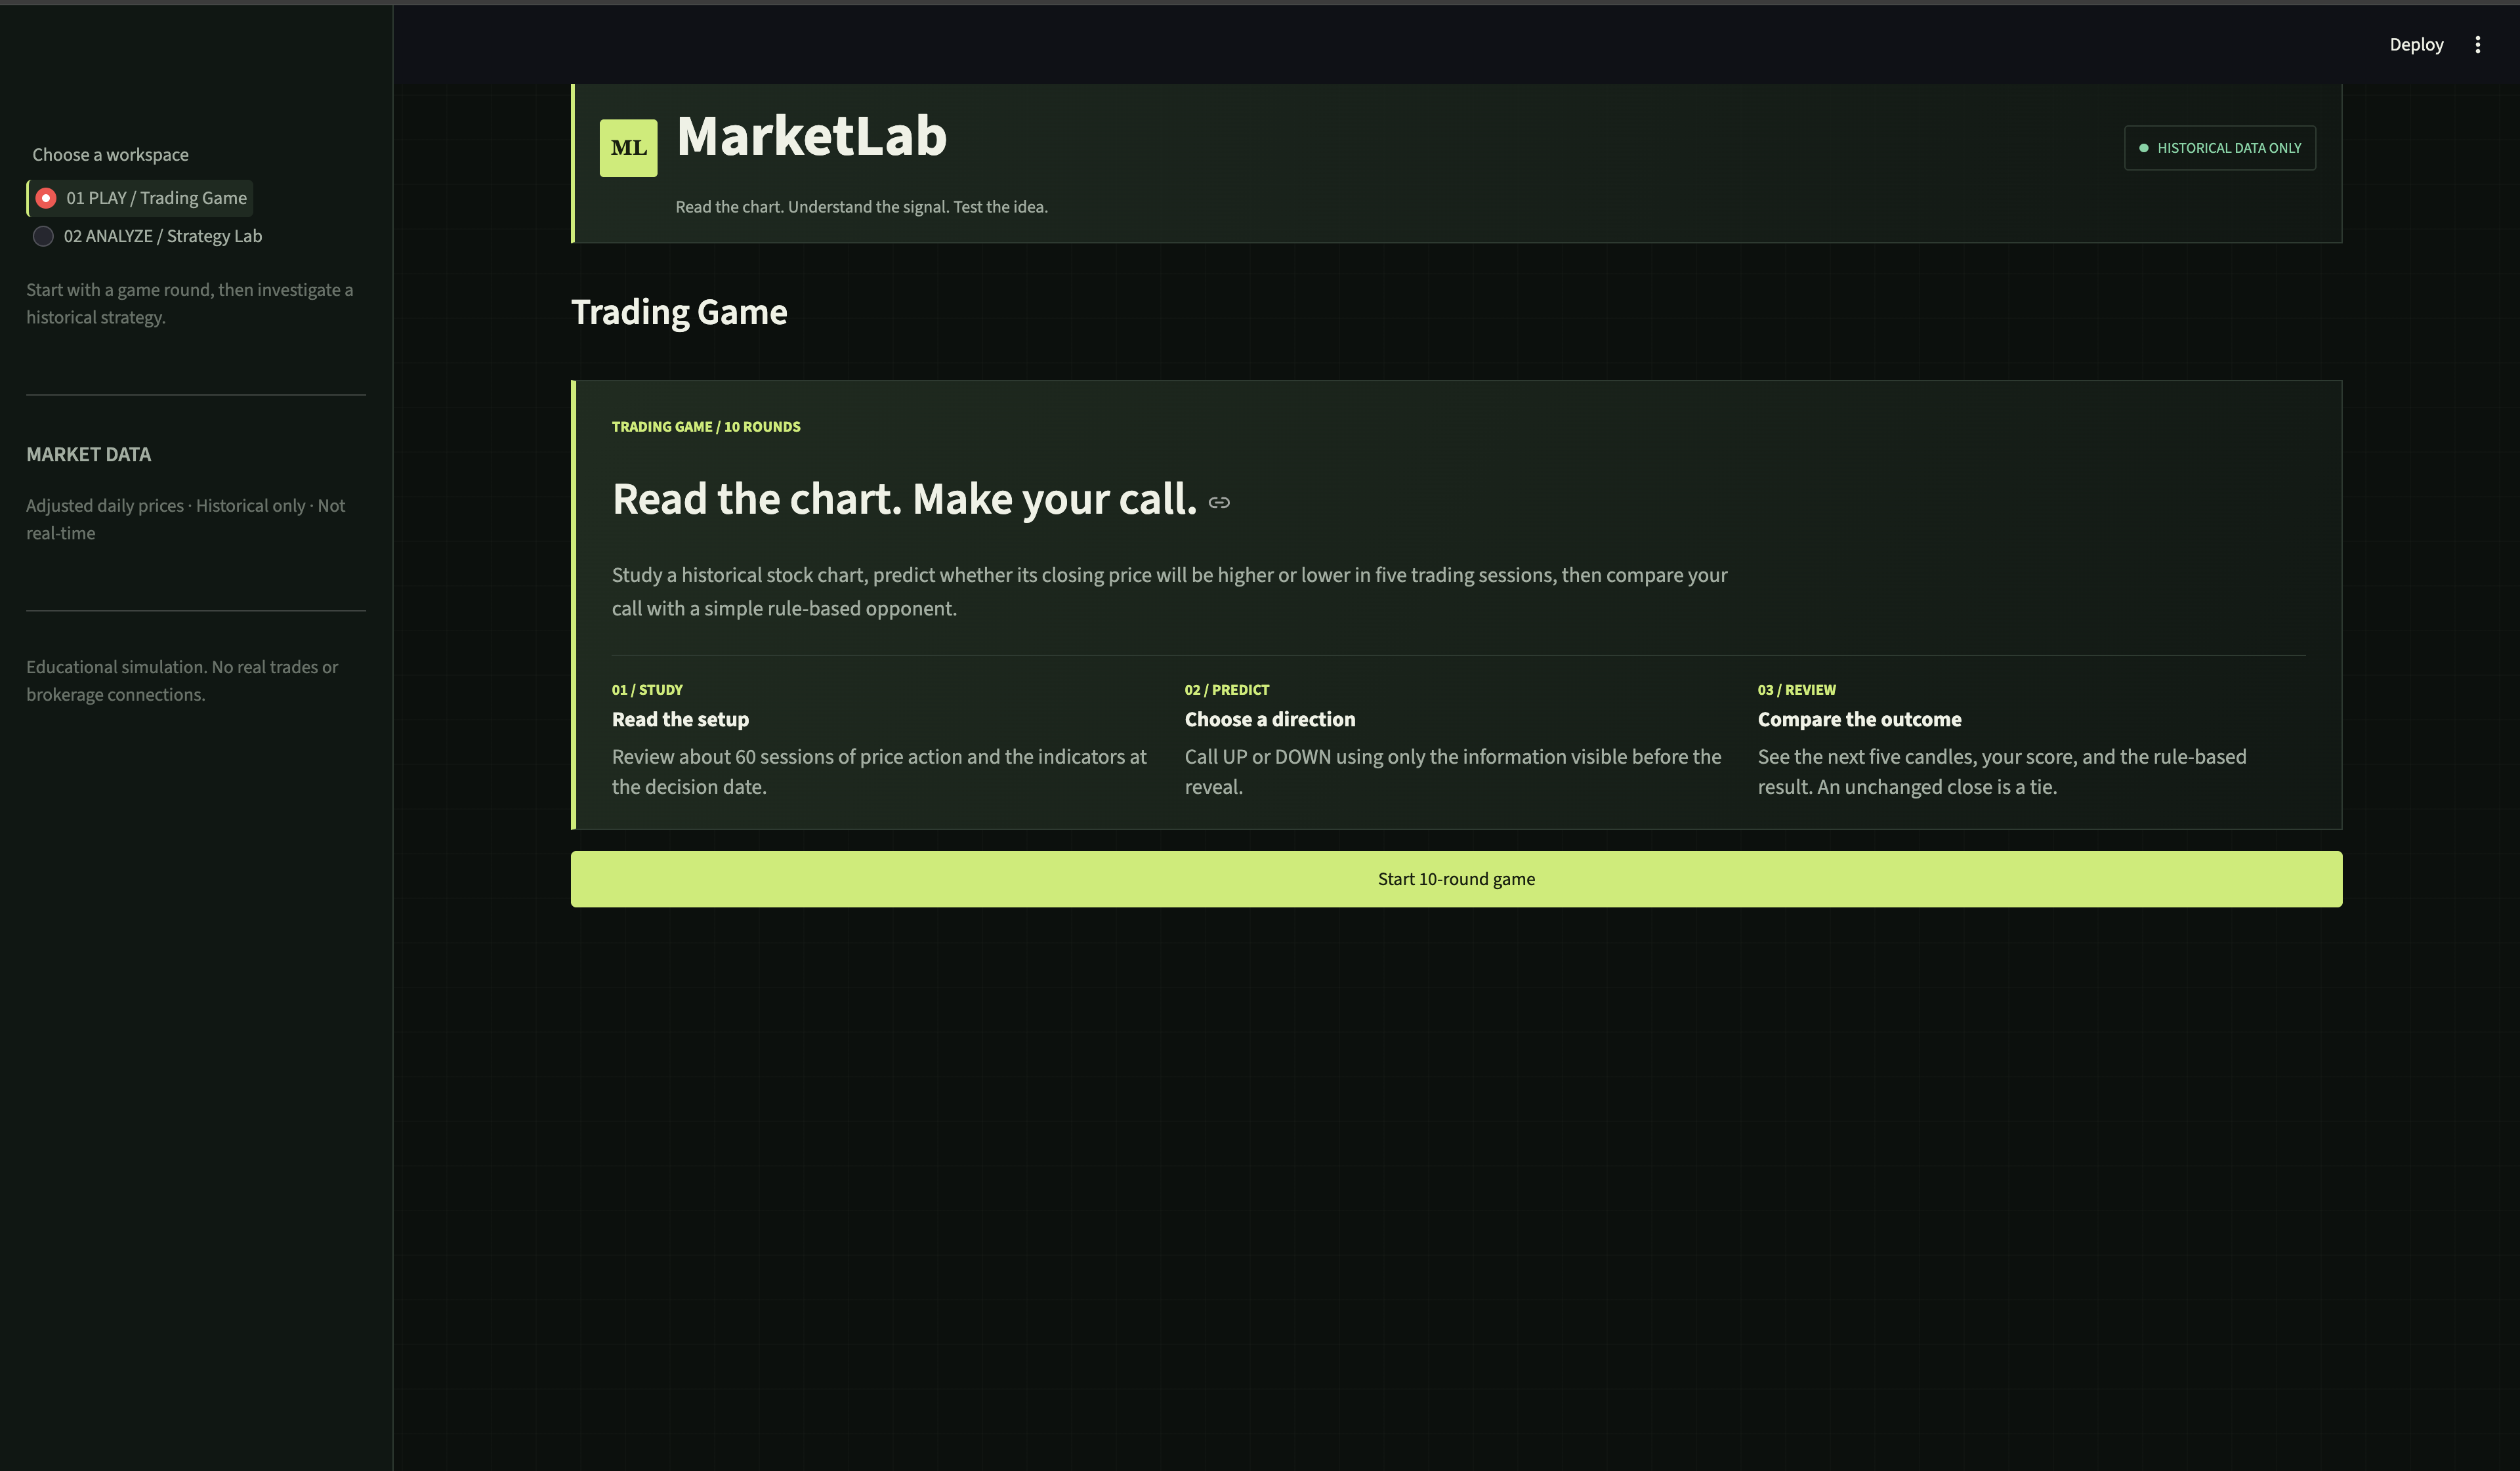
Trading Game
-
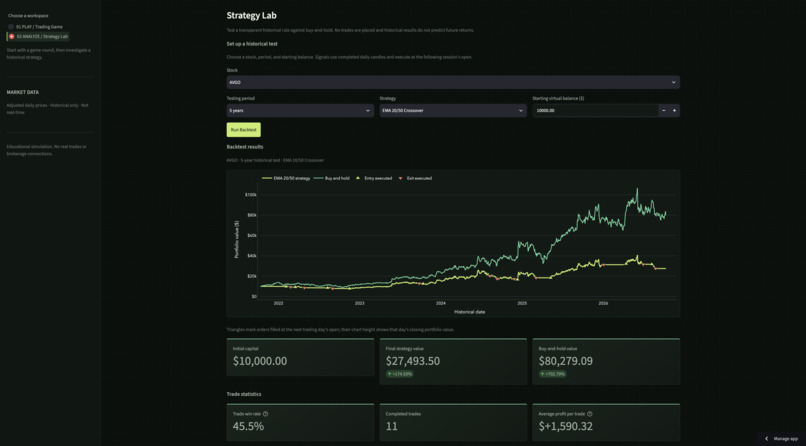
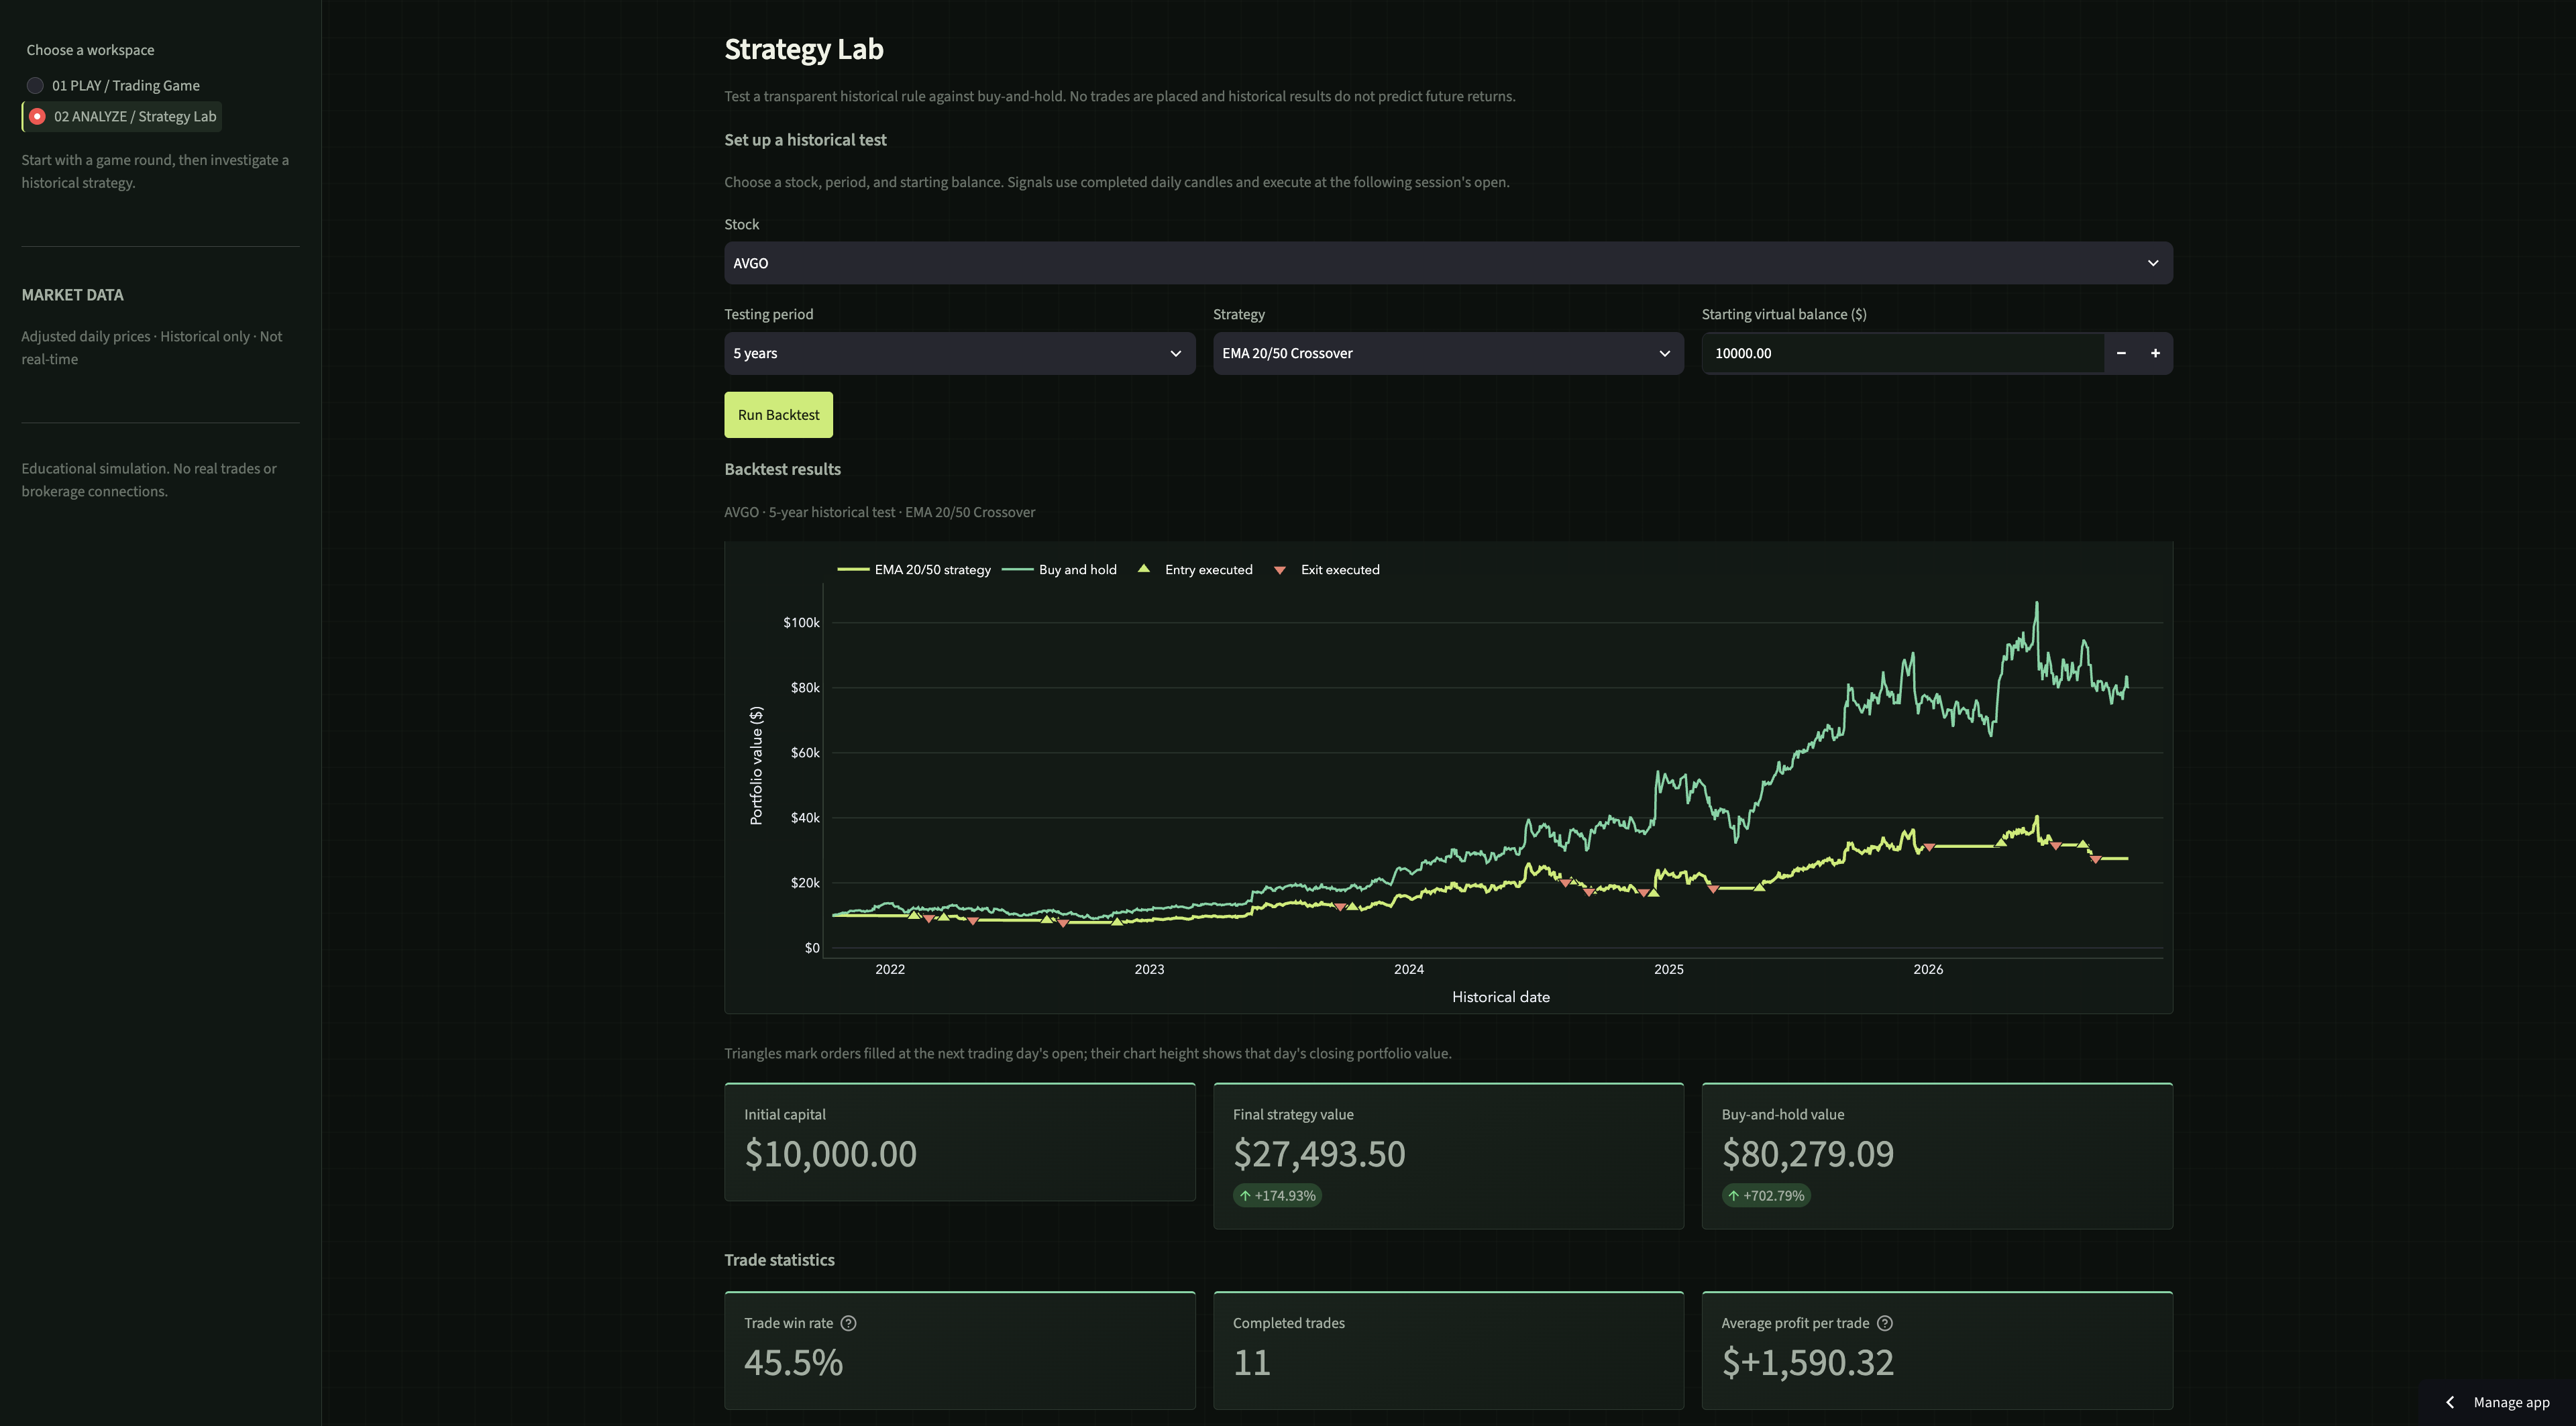
Strategy Lab where backtesting occurs
-
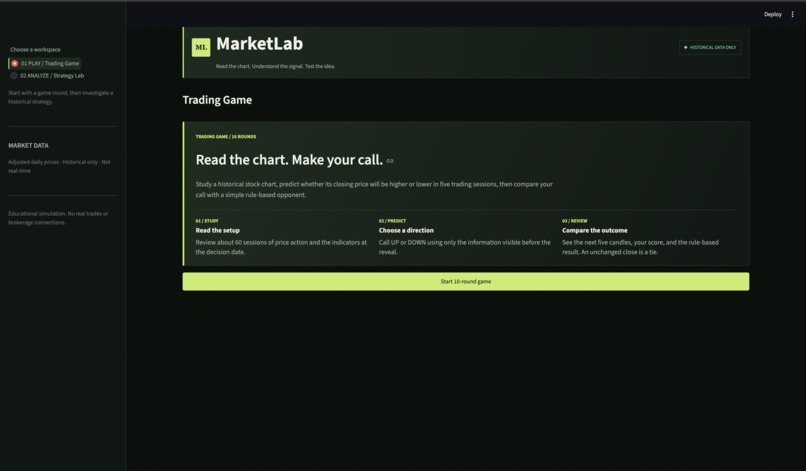
Main Dashbaord
Inspiration
I've been interested in trading and investing for a while, and one thing I've noticed is how difficult it can be for beginners to get started. There are so many indicators, strategies, and concepts to learn, and it's hard to know what actually works without putting real money at risk.
That's where the idea for MarketLab came from. I wanted to create a platform where people could practice making trading decisions, test strategies, and learn from their mistakes without risking real money.
What it does
MarketLab is an interactive trading simulator built around two features:
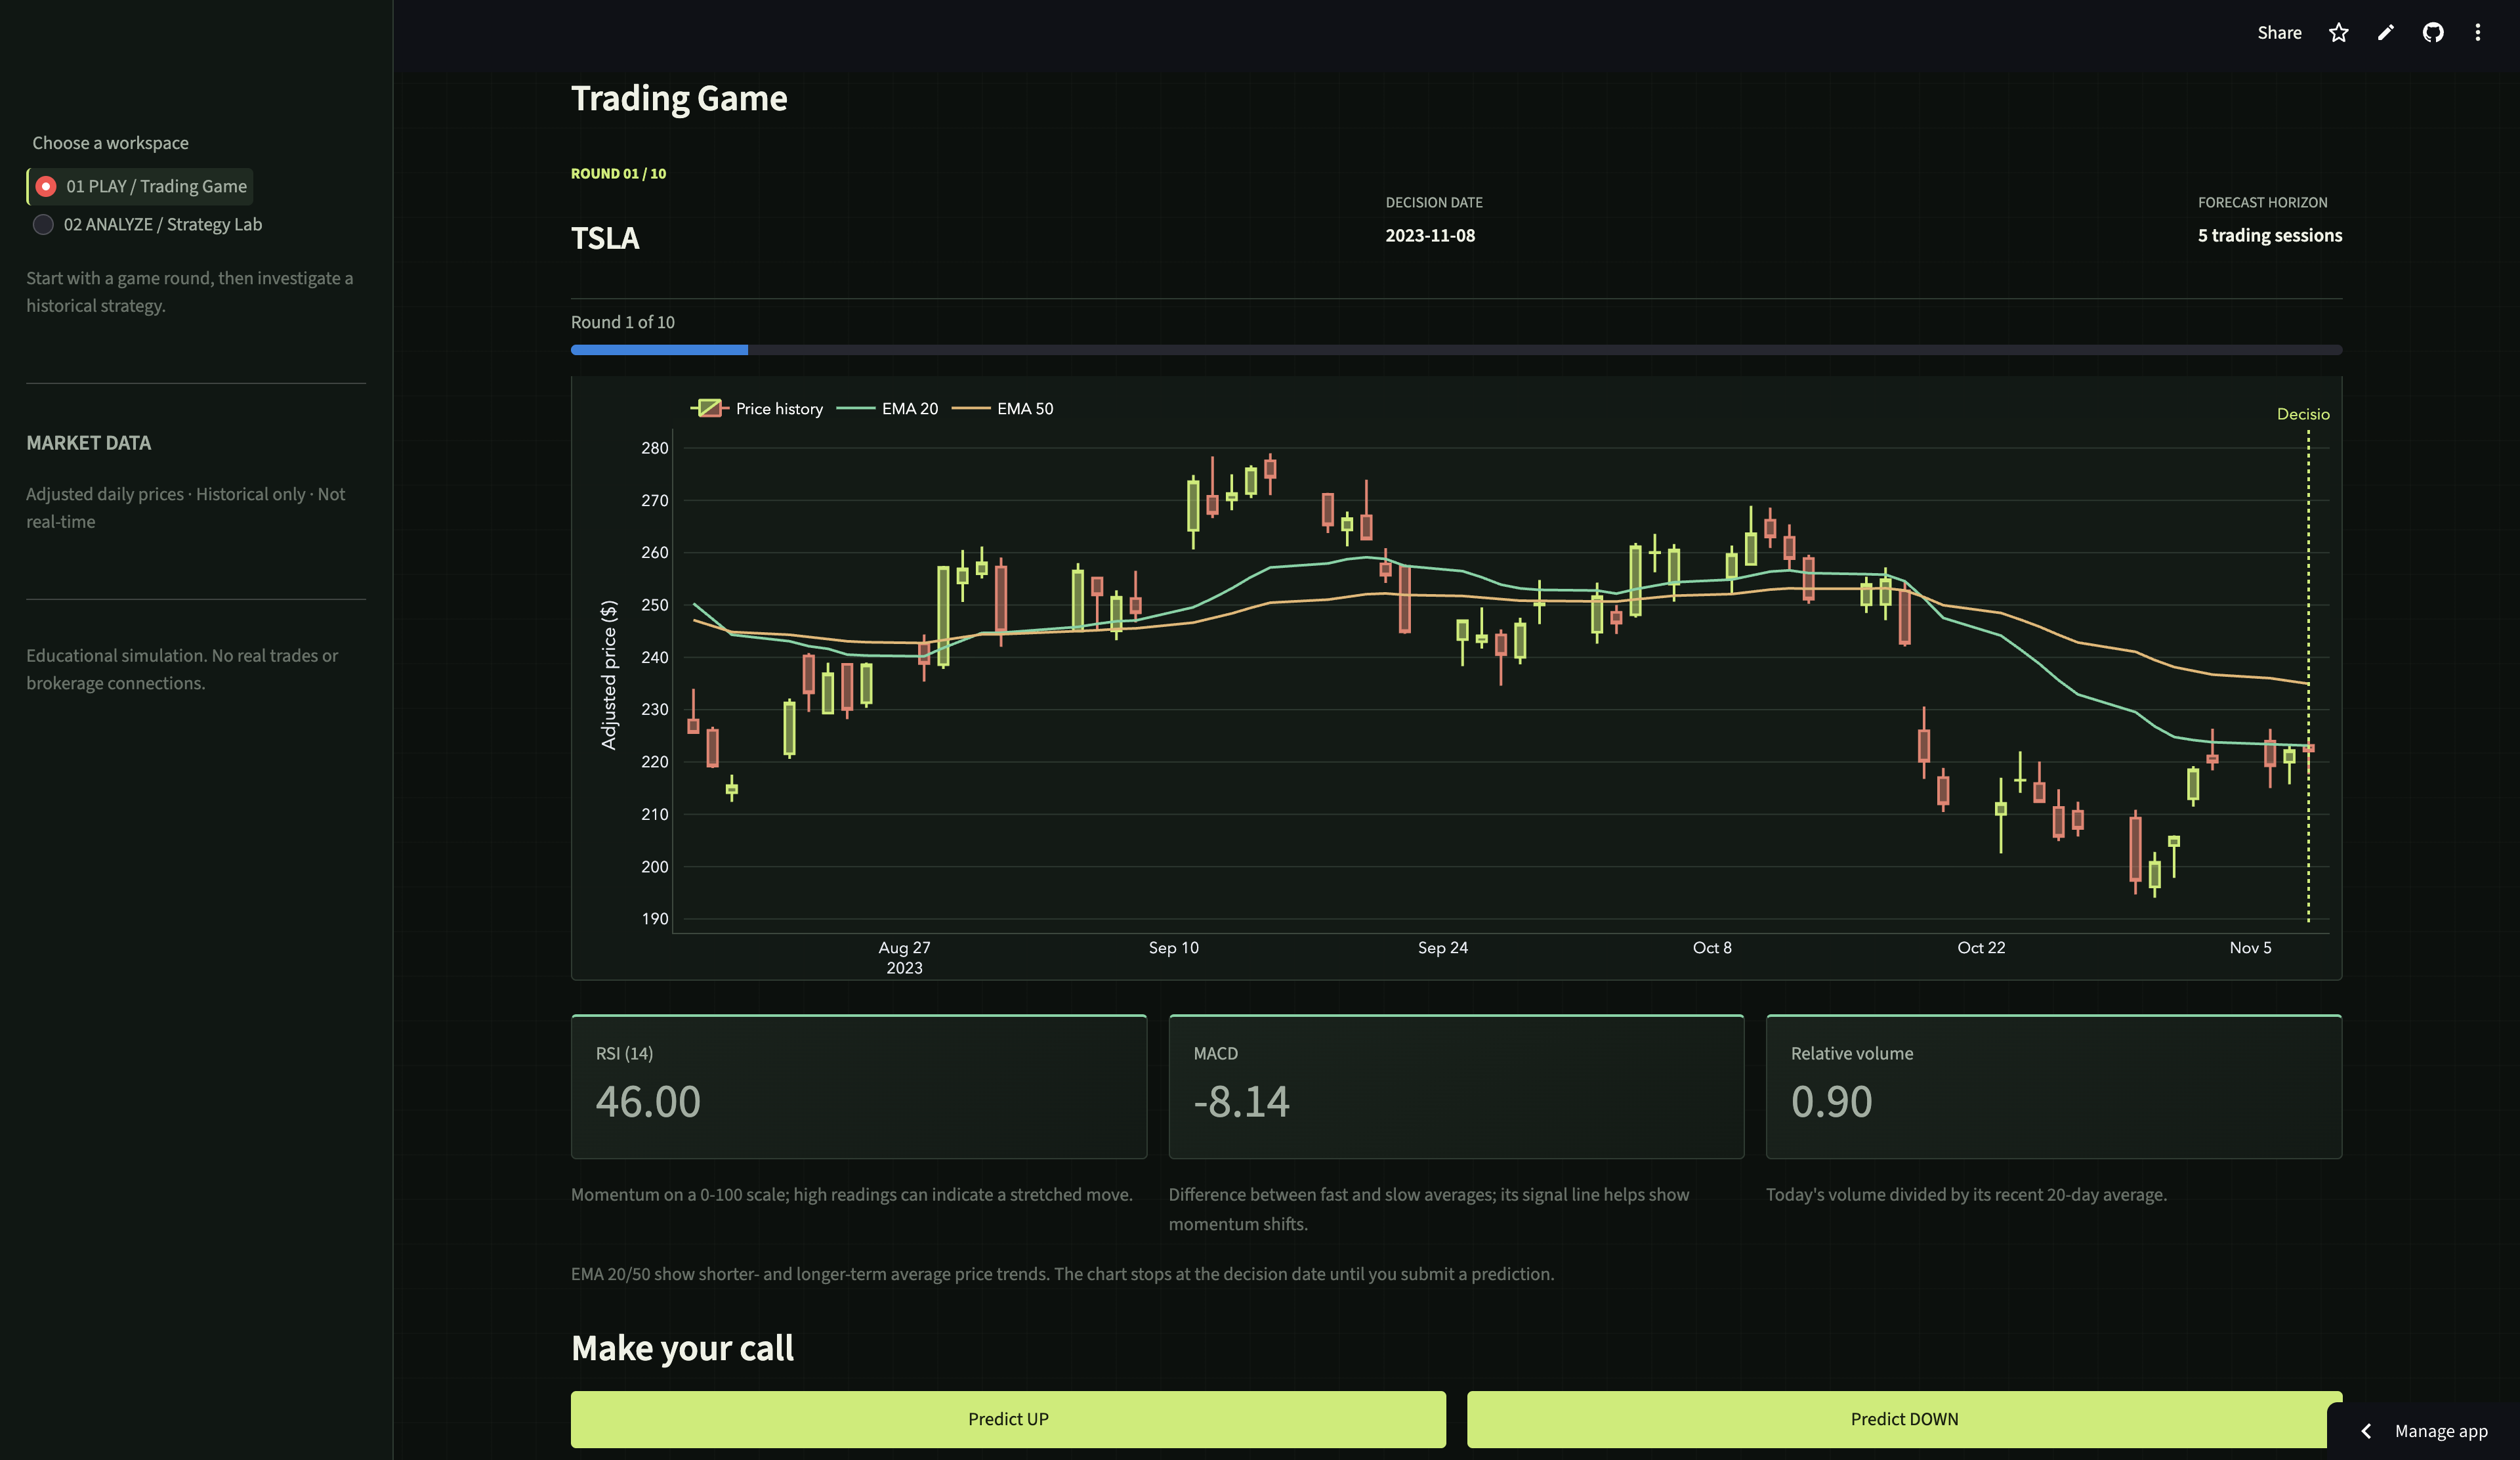
- Trading Game. Players are shown 60 trading days of real historical stock data, with the next five days hidden. They analyze the chart, predict whether the stock will move up or down, and then reveal what actually happened.
- Computer opponent. Players compete against a rule-based opponent that uses EMA and RSI indicators to make predictions. The game tracks scores and winning streaks across rounds.
- Strategy Lab. Users can select a stock, historical testing period, and starting capital to backtest an EMA crossover trading strategy.
- Automated trade simulation. The backtester identifies buy and sell signals, simulates trades using virtual capital, and tracks cash, shares, and portfolio value.
- Performance comparison. Users can see total returns, completed trades, win rate, maximum drawdown, and how the strategy performed compared to buying and holding the same stock.
The goal isn't to tell users what stocks to buy. It's to help them understand market behavior and evaluate trading strategies using historical data.
How I built it
I built MarketLab primarily using Python and Streamlit.
I chose Python because it's a language I'm currently learning and wanted to get more experience with. Streamlit made sense because it allowed me to build an interactive web application without having to learn an entirely separate frontend framework.
For the stock data, I used yfinance to retrieve historical prices and pandas to organize and clean the data.
I used TA-Lib to calculate technical indicators such as EMA, RSI, and MACD. These indicators are used throughout the project to analyze stock movements and generate trading signals.
For the charts, I used Plotly, which allowed me to create interactive candlestick charts and display the results of the backtesting strategy.
I separated the project into multiple Python files to keep everything organized. For example, stock_data.py handles historical data, indicators.py calculates technical indicators, and backtest.py handles the trading simulation.
I also used Codex throughout development to help with implementation, debugging, and understanding parts of the code I wasn't familiar with. I used custom CSS to improve the appearance of the Streamlit interface.
Challenges I ran into
Look-ahead bias. EMA crossover signals depend on closing prices, so executing a trade at the same day's closing price would assume the strategy knew the final price before the session ended. The backtester instead generates signals from completed candles and executes trades at the following trading day's opening price.
Streamlit's execution model. Streamlit reruns the application when users interact with widgets. This creates problems for a game that needs to remember the current round, predictions, scores, and streaks. I used
st.session_stateto preserve game data across reruns and around_scoredflag to prevent the same round from being scored multiple times.Historical data consistency. Stock data needs to be in a consistent format before calculating indicators. The data pipeline handles missing values, normalizes column names, converts prices into numeric values, removes timezone information, and sorts records chronologically.
Portfolio accounting. Generating buy and sell signals is only part of backtesting. The simulation also needs to manage available cash, share purchases, open positions, and portfolio equity. Each trading day, portfolio value is calculated using the remaining cash plus the market value of shares held.
Hiding future market data. Since the Trading Game uses historical prices, the outcome is already present in the dataset. I used pandas
.ilocslicing to limit the chart to the previous 60 trading sessions before a prediction, then reveal the next five sessions after the player submits their answer.Repeated data requests. Streamlit's rerun behavior could lead to unnecessary downloads of the same historical stock data. I used
st.cache_datawith a one-hour expiration to reuse downloaded data and reduce repeated requests to yfinance.
I worked through these problems by reading documentation, watching tutorials, breaking the project into smaller parts, and using Codex to help implement and debug features.
Accomplishments that I am proud of
I'm most proud of being able to turn an idea into a working application during my first hackathon.
As a freshman working alone, I wasn't sure how much I would be able to accomplish within the time limit.
I originally started with the idea of making a simple stock prediction game, but eventually I decided to expand it to include a Strategy Lab where users could test an actual trading strategy.
I'm also proud that the application uses real historical stock data rather than randomly generated prices.
Being able to combine my interest in trading with a coding language I'm learning made the project much more enjoyable to work on.
What I learned
Financial data processing. I gained experience using pandas to clean and manipulate historical stock data, handle missing values, normalize data types, and prepare datasets for technical indicator calculations.
Streamlit development. I learned how to build an interactive Python application using Streamlit, including navigation, widgets, charts, caching, and
st.session_stateto preserve information across reruns.Planning and project structure. I learned how much work goes into turning an idea into a complete application. Writing individual functions is one thing, but designing how data moves between different modules, integrating features, and testing everything together requires much more planning than I initially expected.
Overall, I learned a lot about the development process and got a better idea of what I want to improve as a programmer.
What's next for MarketLab
There are several things I'd like to add to MarketLab after the hackathon.
The first is expanding the application beyond its current selection of stocks. Eventually, I'd like to build a stock screener that can search through a much larger selection of the market and identify stocks that meet certain technical conditions.
I'd also like to improve the Strategy Lab by allowing users to create their own strategies instead of only testing EMA crossovers. For example, users could combine RSI, MACD, moving averages, and volume indicators to create different trading rules.
Another feature I'd like to add is a section with beginner-friendly lessons explaining trading concepts and how different indicators work.
For now, MarketLab is still an early project, but I plan to keep working on it and improving my programming skills along the way. Eventually, it can turn into a full fledged website where people can use it to learn and trade.


Log in or sign up for Devpost to join the conversation.