-
-
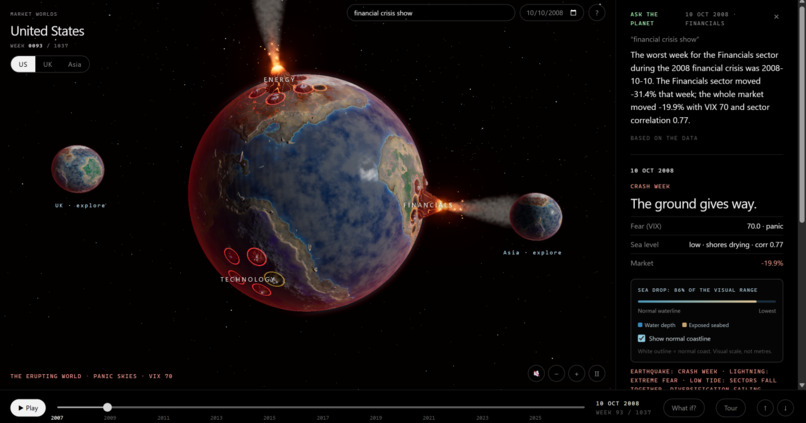
Final version of Market World
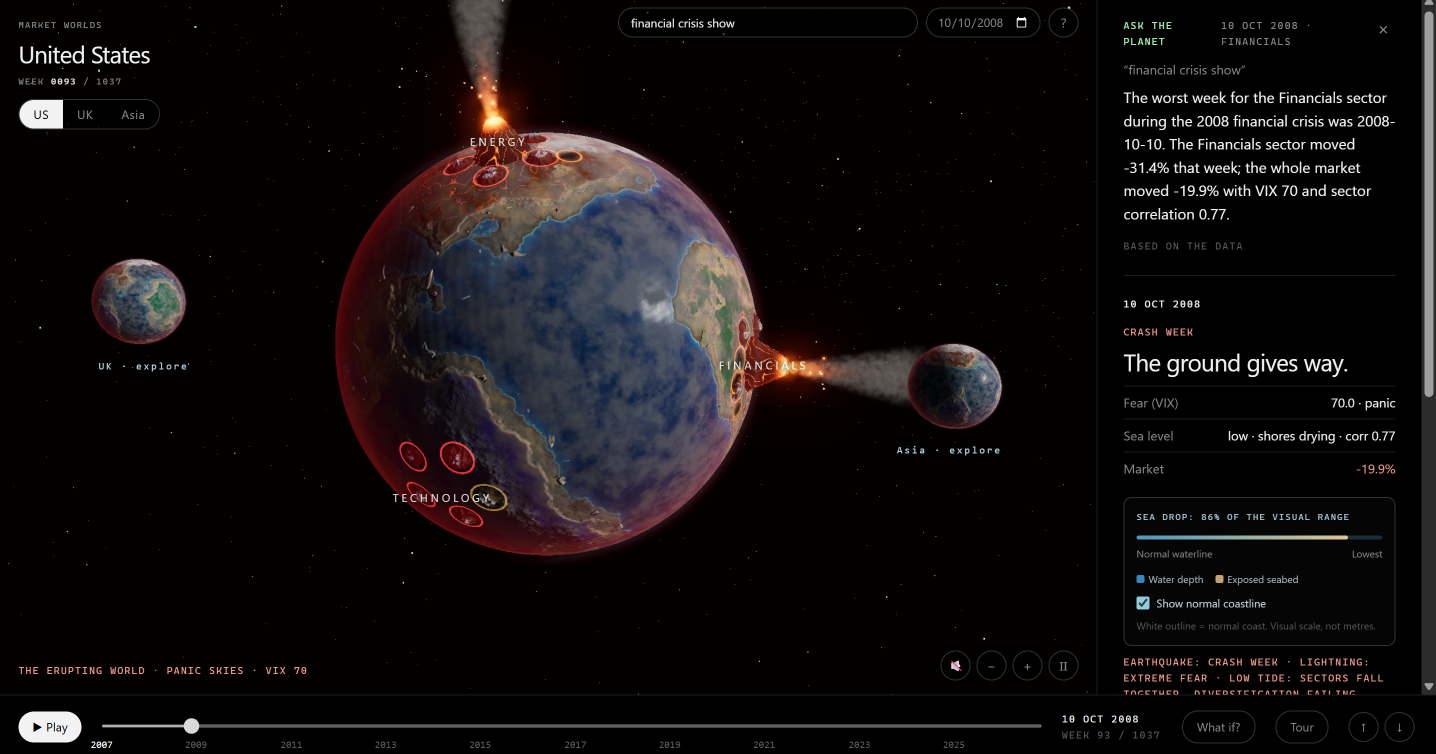
Inspiration
Every market shift creates a new world of opportunities and challenges. We wanted to bring the “New Worlds” theme to life by making financial history something people could explore.
What it does
Market World turns historical market data into an interactive 3D planet. Users travel through dates, explore changing landscapes and discover the good and bad behind major events.
How we built it
We used Three.js, JavaScript and adapted open-source shaders for the planets, storms and volcanoes. Python processes market data from Yahoo Finance, while FastAPI connects the backend to the frontend.
Challenges we ran into
Connecting the graphics and financial data took work. We also had to balance detailed effects with smooth performance and keep the interface usable on smaller screens.
Accomplishments that we're proud of
We brought data, storytelling and interactive worlds together into a working experience, with erupting volcanoes, changing weather and a timeline users can explore.
What we learned
We learned about shaders, 3D animation, financial data processing and connecting frontend and backend systems. We also learned how much testing matters when combining them.
What's next for Market World
We want to add more historical events, improve mobile performance and make the connection between market changes and the landscapes clearer.


