-
-
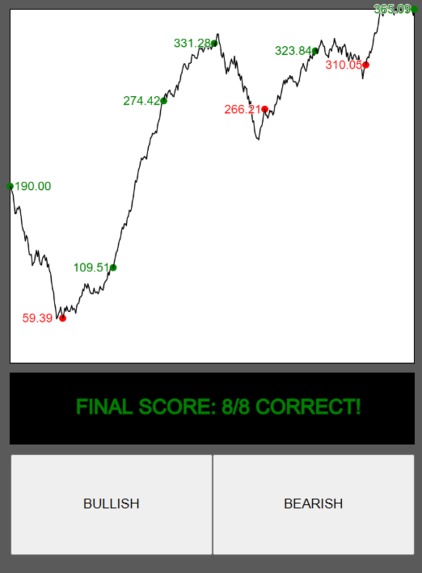
End of a (perfect ;) ) game
Inspiration
As an amateur investor, I think it is very important for people in this day and age to become financially literate and learn about the market. However, this is easier said than done, and the market is very confusing for many people. Hopefully, this little program can at least help some beginners learn to assess a stock's performance and understand what market volatility entails.
What it does
It is meant to help people visualize and understand the seemingly understandable randomness of the market
How we built it
I used P5.js--Processing is one of the first visual libraries I learned about, and I have always loved it :)
This was made largely using knowledge of P5 through past projects.
Challenges we ran into
Using P5 to manage multiple panels in the same canvas was very tedious and hard to debug. Some features had to be cut in the final product due to the sheer difficulty in managing all the different sides of the same canvas.
Accomplishments that we're proud of
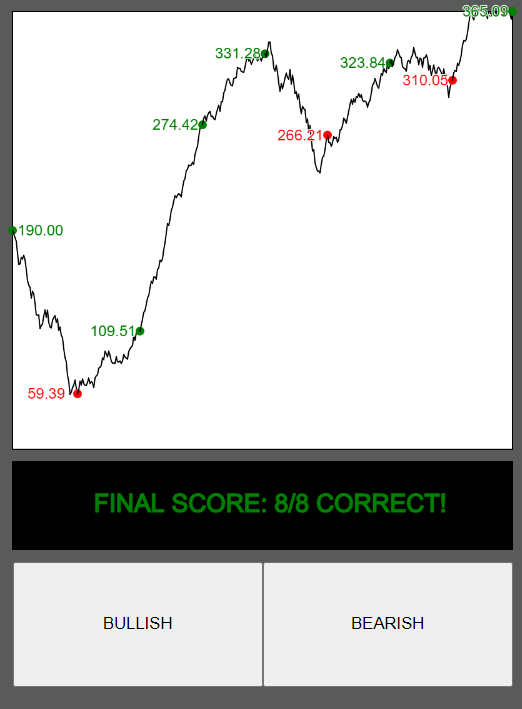
The stock chart is completely random, but through some math, it can be subtly influenced to behave in certain ways depending on the news. Despite the randomness, it is capable of making graphs that look like real stocks. I am also proud of the simplistic, yet intuitive design of the program.
What we learned
I learned that a lot more time and diagramming/organization is needed to make a project like this. I also had to do a little research on what market volatility really was. This project is not the perfect textbook definition of it, but it does help one come to understand it.
What's next for WSB Simulator: Learning Edition :)
Better visuals and improved information UI, like a news feed. I would really like to implement money and earnings/loss into the simulator to add stakes to the game. Lastly, I would like to implement some sort of scaling for the graph window and allow it to exceed the boundaries and have the graph window follow it


Log in or sign up for Devpost to join the conversation.