Inspiration
Prediction markets contain a lot of useful signal, but the raw market list is noisy. A market can look interesting because its odds are extreme, because it has not updated recently, because it is close to resolution, or because the price is supported by thin liquidity. Those are the kinds of situations where a human might want to inspect the market more closely.
Market Mispricing Radar was inspired by that triage problem: instead of trying to build a perfect fair-value model, I wanted to build an explainable inspection tool that helps surface markets worth a second look.
What It Does
Market Mispricing Radar ingests Polymarket data, normalizes market records, computes transparent fragility signals, and ranks markets by how worth-inspecting they look.
The app is built around three user-facing views:
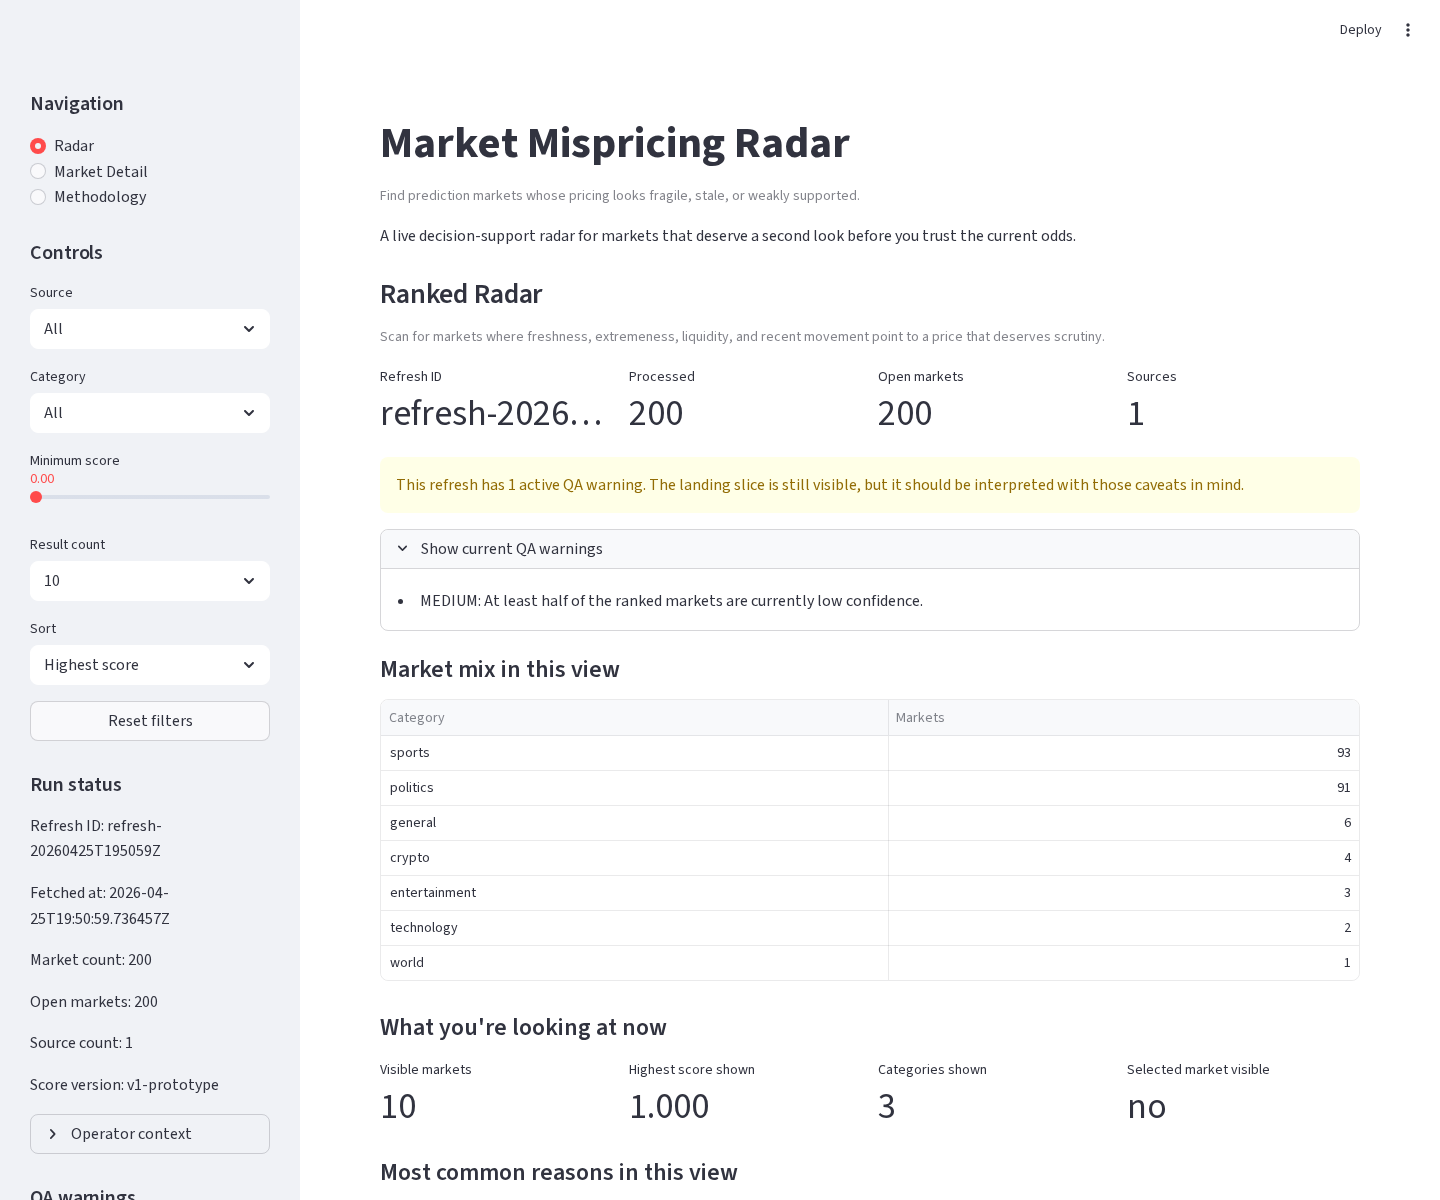
- Ranked Radar: a ranked list of markets with scores, categories, current probabilities, and headline reasons.
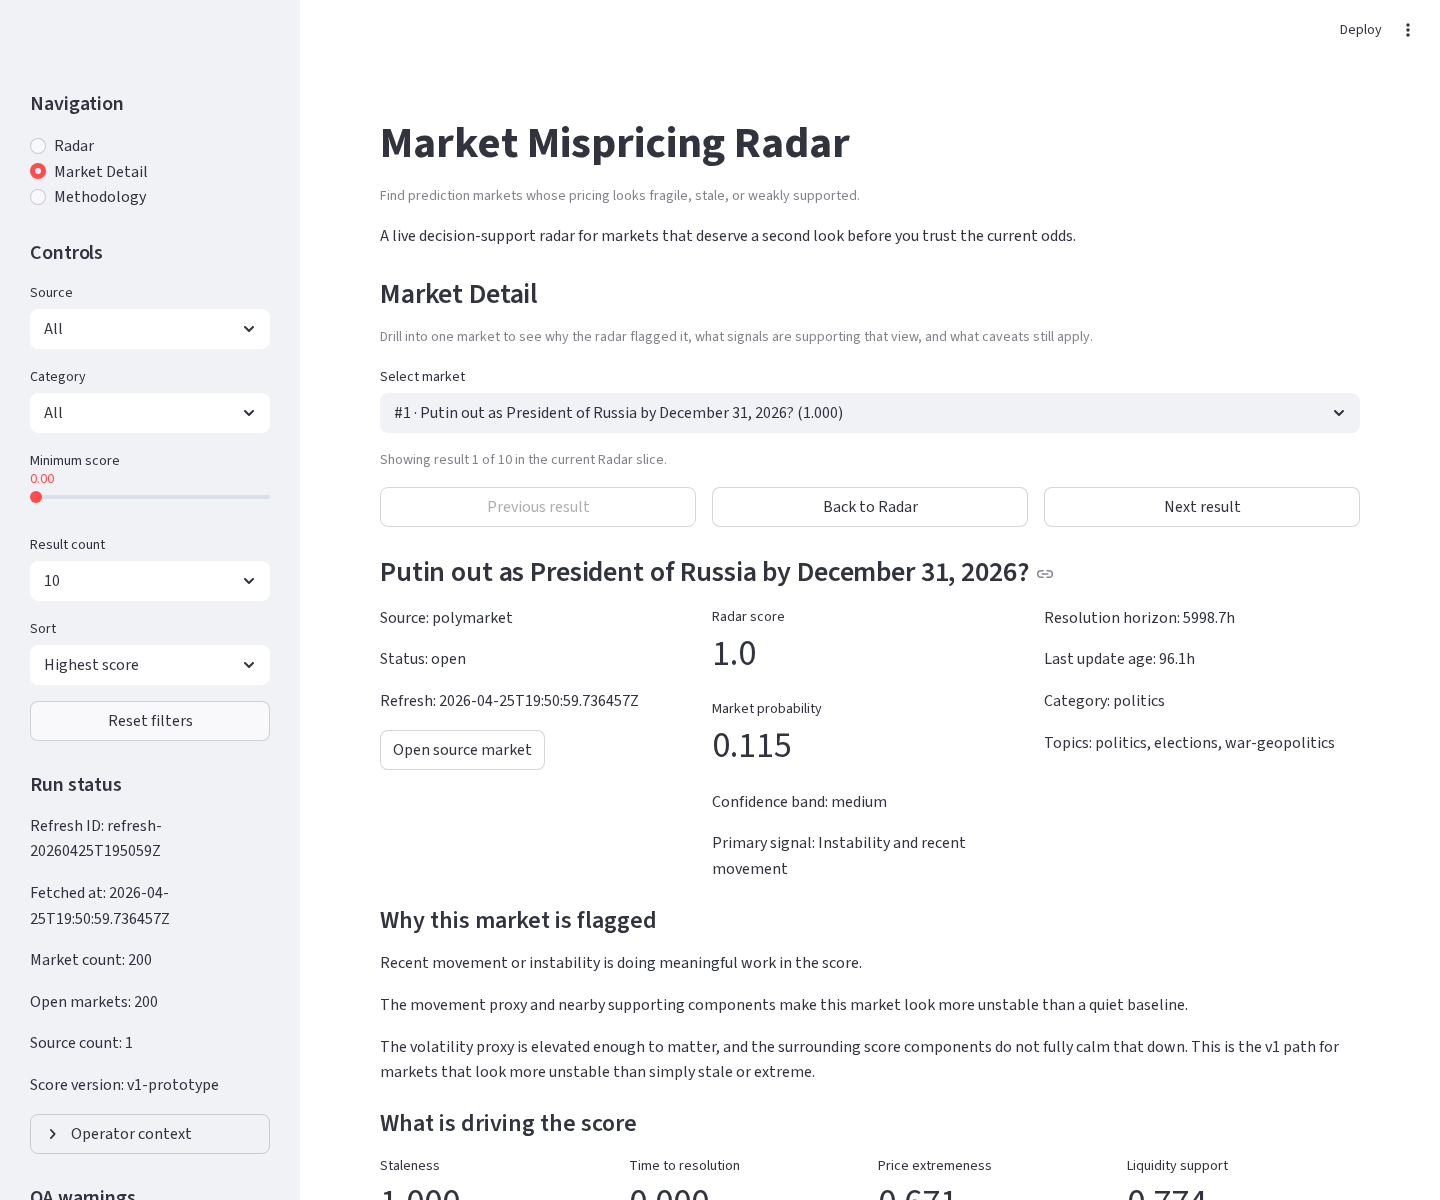
- Market Detail: a drilldown page showing why a specific market was flagged, including score components, supporting signals, caveats, and source links.
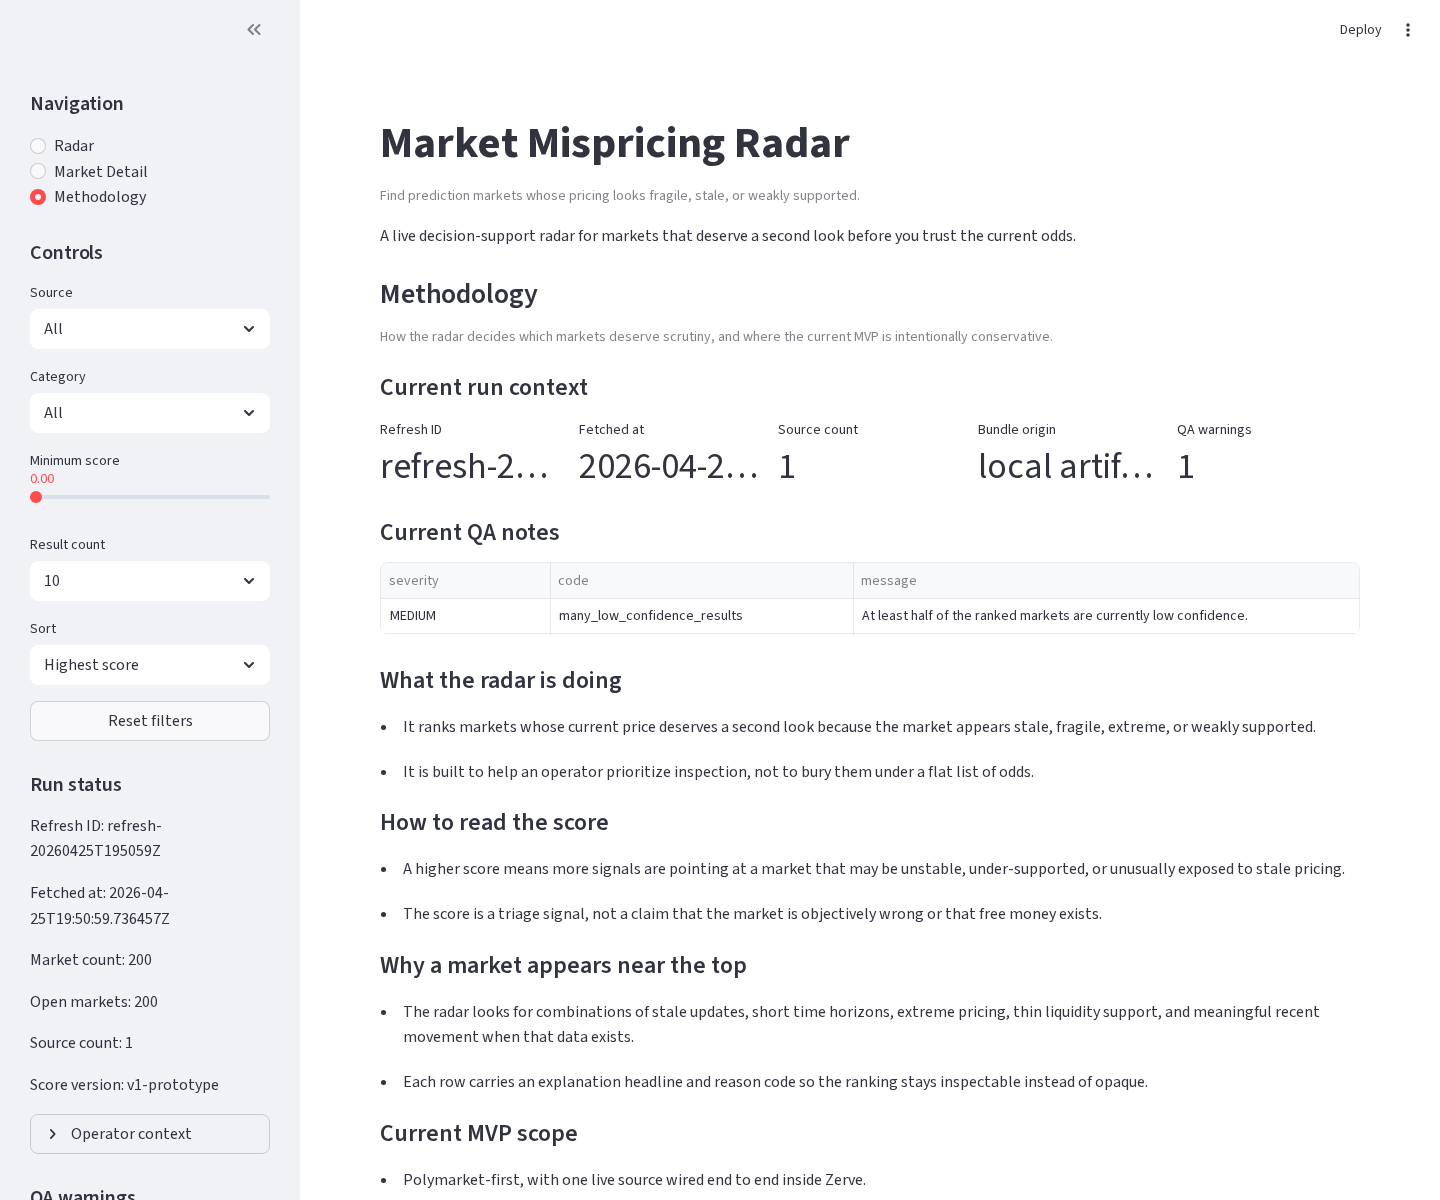
- Methodology: an honest explanation of what the score means and what it does not claim.
The score is intentionally framed as an inspection signal, not a guaranteed arbitrage detector or calibrated truth oracle.
Conceptually, the score combines signals like:
$$ score = f(\text{staleness}, \text{event horizon}, \text{price extremeness}, \text{liquidity}, \text{movement}, \text{data quality}) $$
The goal is to answer which prediction markets look stale, fragile, extreme, or weakly supported enough to deserve human inspection?
How I Built It
I built the project as a Zerve-native analytical workflow with a local Git mirror for safety, iteration, and submission artifacts.
The pipeline is organized as staged blocks:
- Fetch active Polymarket data.
- Normalize raw market payloads into a consistent schema.
- Compute market features such as freshness, event timing, price extremeness, liquidity support, and movement.
- Score and rank markets.
- Generate human-readable explanations.
- Bundle the ranked markets and explanations for a Streamlit app.
- Render a judge-facing app with Radar, Detail, and Methodology views.
The app is implemented in Streamlit and designed to consume prepared upstream outputs rather than doing heavy computation in the presentation layer. That keeps the architecture clean: Zerve handles the notebook-style data workflow, while the app focuses on exploration and explanation.
Challenges
One challenge was keeping the scoring honest. It would have been easy to overclaim and present the score as a true probability model. Instead, I framed it as a transparent fragility score and added visible caveats so users understand its limits.
Another challenge was dealing with real market data. Source records are not always perfectly shaped for an app: timestamps can be missing, categories may need heuristics, and some markets can be technically open while their resolution date has already passed. The pipeline includes data-quality handling so those cases do not silently dominate the rankings.
A third challenge was turning a working prototype into something demoable. The project needed not just scoring logic, but a clear app flow, readable explanations, a reliable local fallback demo, and a submission-ready story.
What I Learned
I learned that explainability matters more than model complexity for this kind of tool. A simple score is much more useful when the user can see exactly why a market was flagged.
I also learned that Zerve is a good fit for this workflow because the project naturally breaks into pipeline stages: ingestion, normalization, feature engineering, scoring, explanation, and app deployment. Keeping those stages explicit made the system easier to debug and easier to explain.
Most importantly, I learned that a strong MVP can be valuable without pretending to solve the entire problem. This version is single-source and deliberately scoped, but it demonstrates the core product idea: turn messy prediction-market data into an explainable inspection queue.
What Is Next
The next version would add more sources, such as other prediction markets or forecasting platforms, and compare disagreement between them. It could also add historical movement tracking, better category-specific scoring, and richer confidence calibration.
The long-term goal is to move from single-source market triage toward a broader market intelligence layer that helps analysts find prediction markets where the current price deserves closer scrutiny.

Log in or sign up for Devpost to join the conversation.