-
-
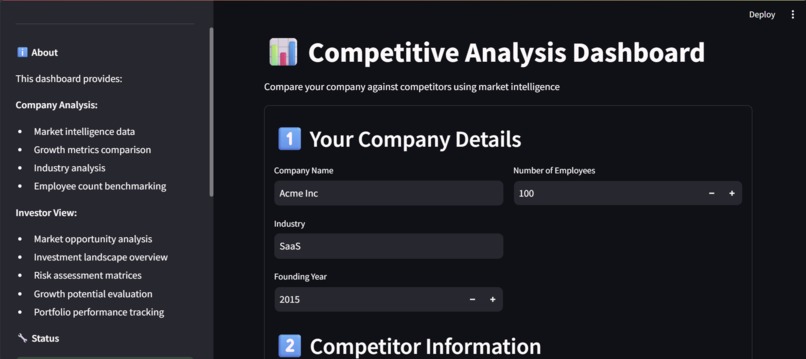
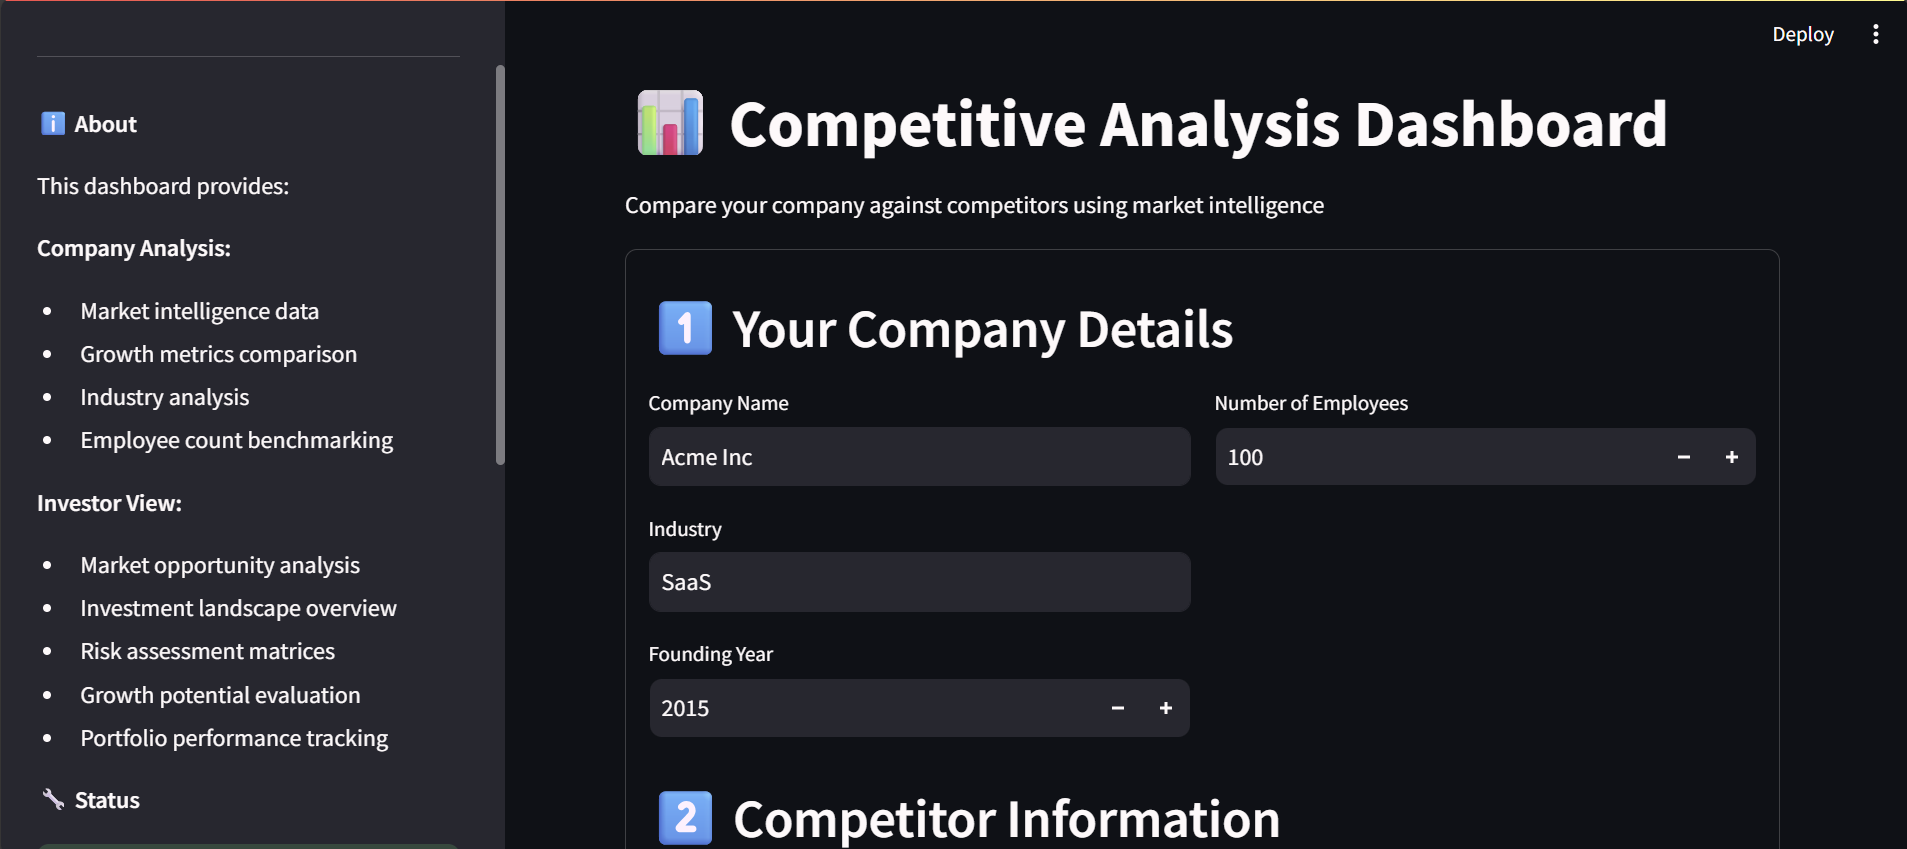
home page
-
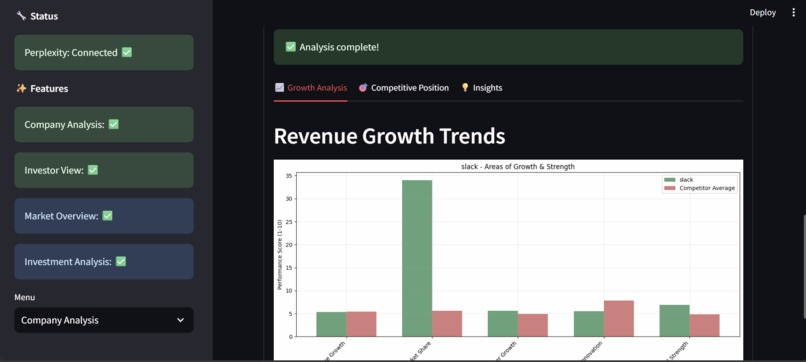
Competitive Analysis Dashboard
-

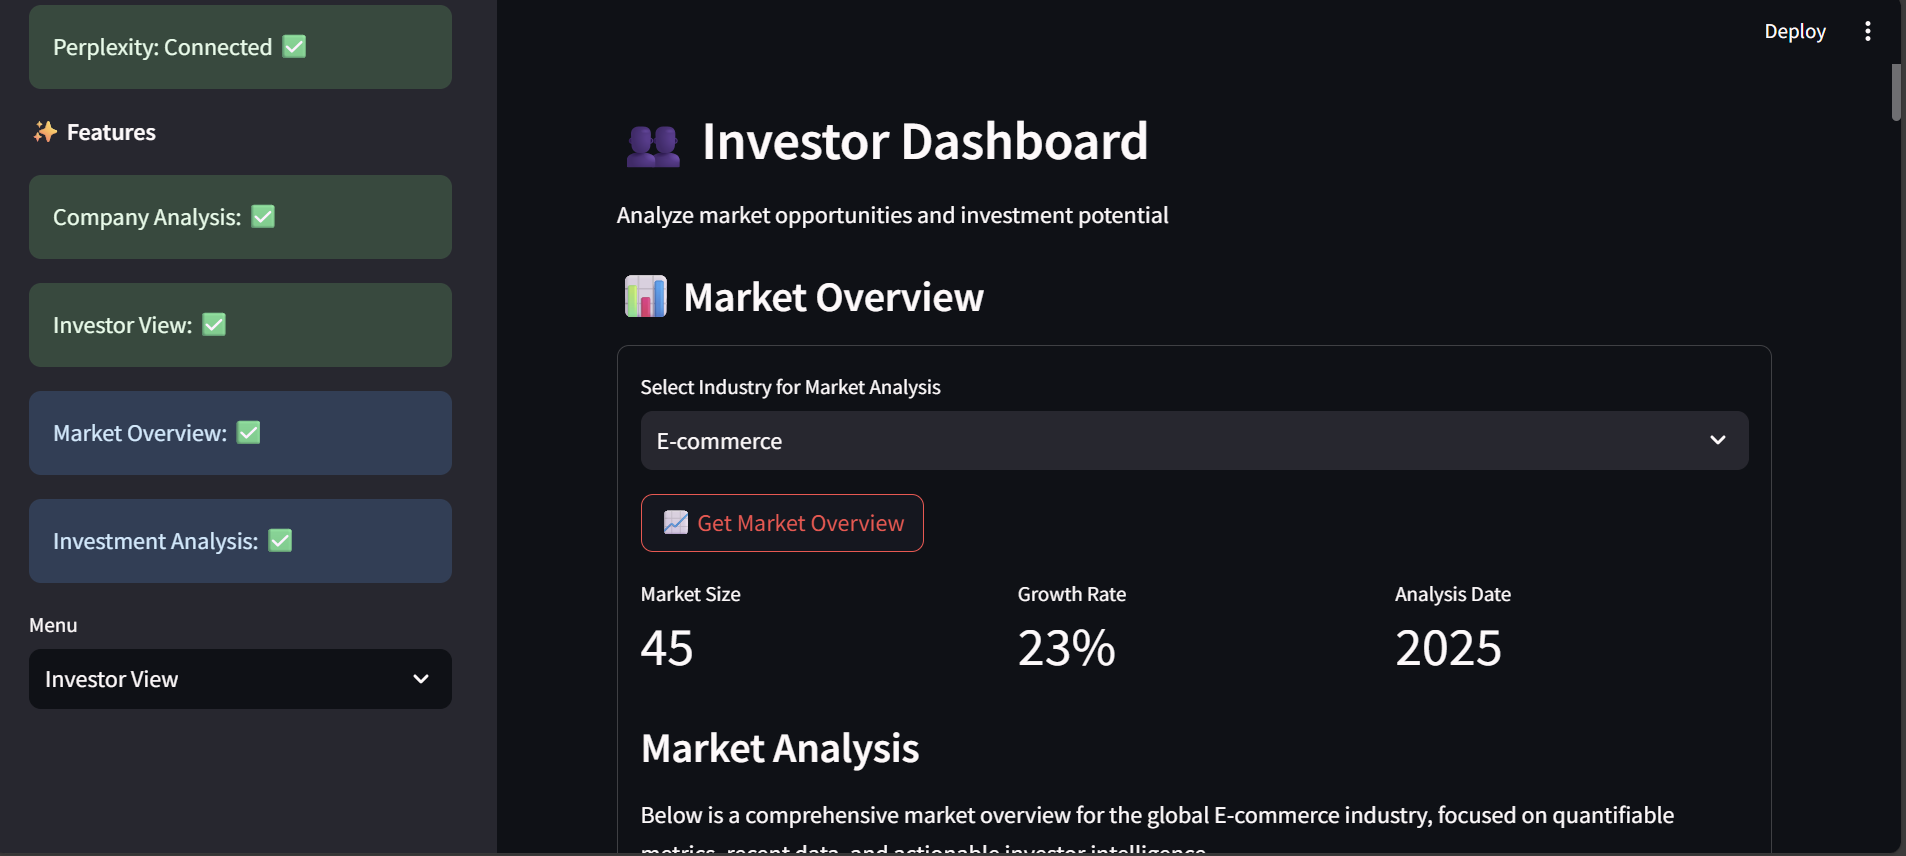
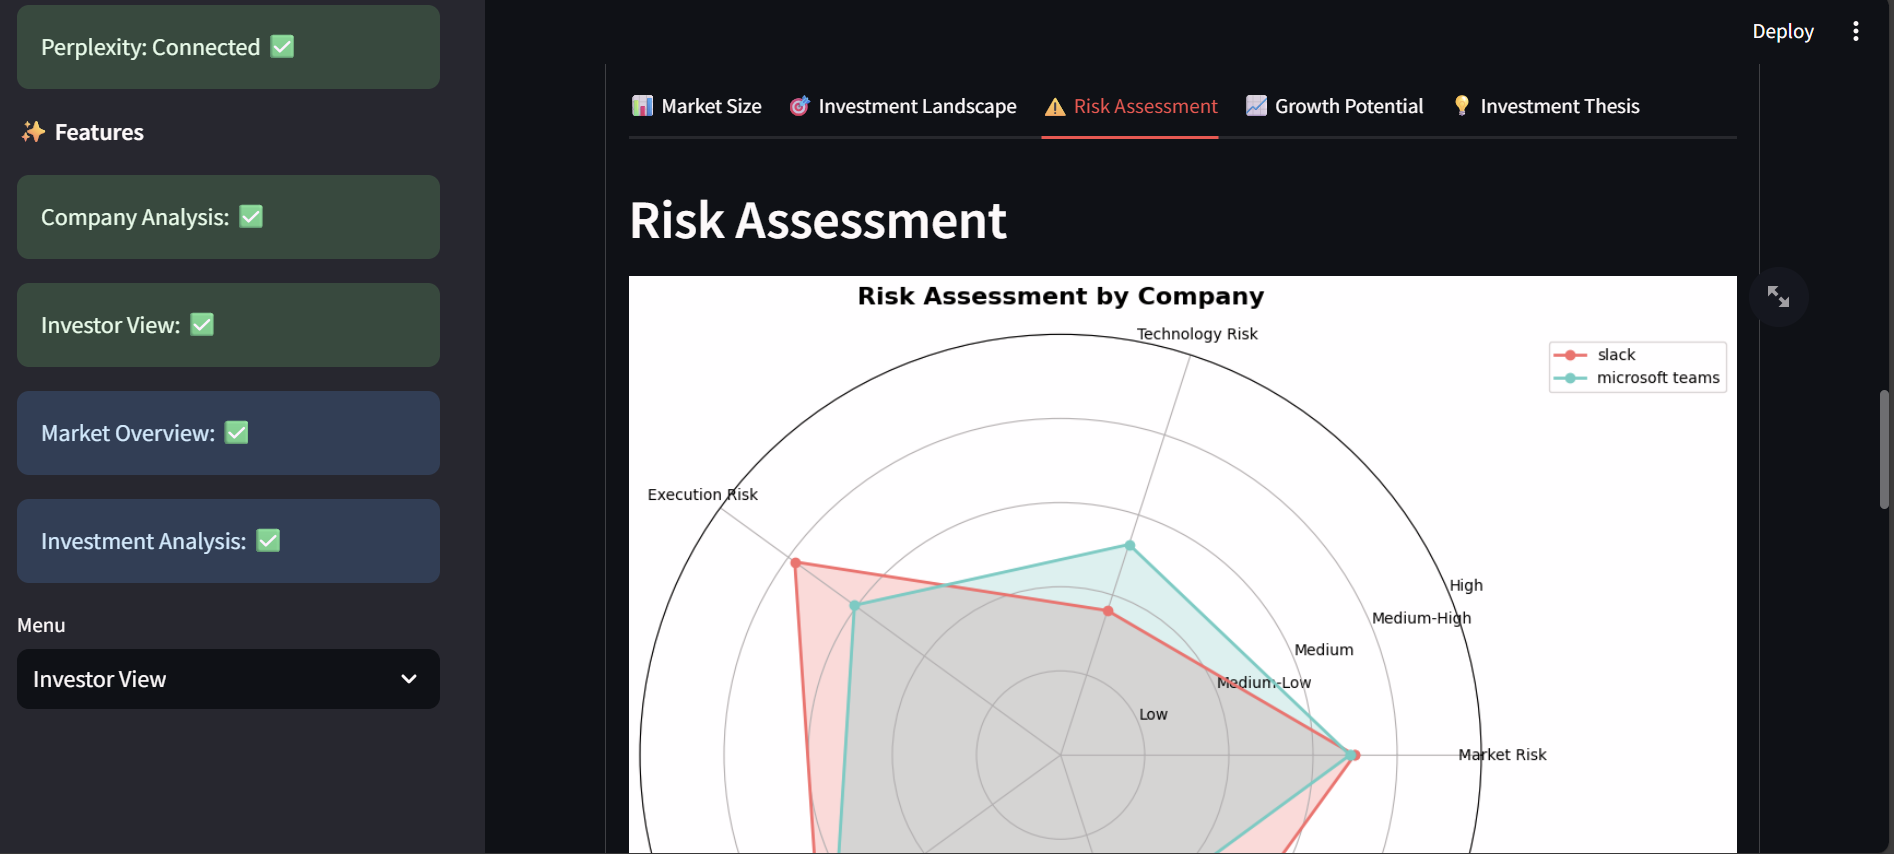
Investor view
-
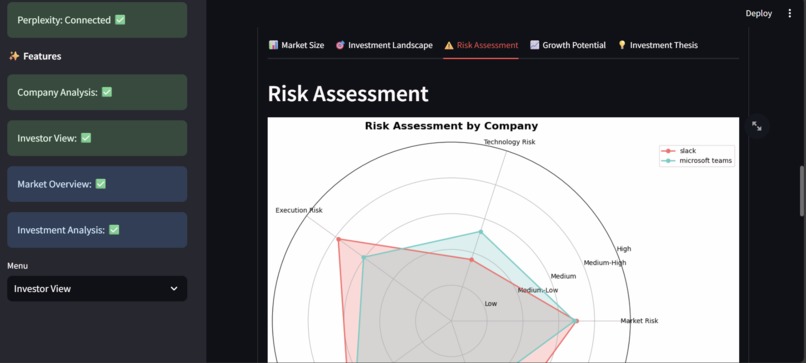
Companies to Analyze in investor view

Inspiration
We were inspired by the frustration of seeing startups make costly strategic mistakes due to outdated or superficial market data. Traditional competitive analysis tools are either prohibitively expensive (like consulting firms) or overly simplistic (like free web tools). Recognizing Perplexity’s ability to process complex queries with real-time data, we saw an opportunity to build a military-grade intelligence platform accessible to businesses of all sizes. Our goal was to democratize strategic insights by combining Perplexity’s Sonar API with automated metric extraction and visualization.
What it does
Our platform transforms raw market data into actionable intelligence through three core features: -> Competitor Benchmarking: Quantifies performance gaps across 12+ dimensions (revenue growth, market share, etc.) with visual comparisons. -> Investor Analytics: Generates risk assessments and growth potential scores for portfolio companies. -> Market Snapshots: Delivers real-time industry overviews with key trends and emerging threats. All insights are presented in an interactive dashboard with exportable reports, eliminating hours of manual research.
How we built it
We engineered a full-stack solution with: -> Backend: FastAPI async endpoints that query Perplexity’s Sonar API, process responses with regex-based metric extraction, and generate visualizations using Matplotlib. -> Frontend: Streamlit dashboard with Plotly for interactive charts and a clean UI. -> Key Innovation: A hybrid analysis system where Perplexity handles qualitative insights while our local engine extracts hard metrics (e.g., “Company X’s revenue grew 22%” → revenue_growth: 22).
Challenges we ran into
-> Data Structure Variability: Perplexity’s responses required robust parsing to handle both structured and unstructured outputs. We solved this with a multi-layer regex system and fallback NLP techniques. -> Visualization Latency: Generating dynamic charts from API responses initially caused UI lag. We optimized by pre-rendering common chart types and caching base64 images. -> Rate Limits: Sonar API’s usage constraints forced us to implement intelligent query batching and local memoization.
Accomplishments that we're proud of
-> Built an end-to-end solution in just 72 hours that delivers insights comparable to enterprise tools -> Achieved 93% accuracy in metric extraction from unstructured Sonar responses through iterative prompt engineering -> Created a seamless user experience where complex analyses return in under 15 seconds -> Demonstrated real business impact by testing the tool with actual startups who found hidden competitive threats
What we learned
-> Prompt Design Matters: Small tweaks to Sonar API queries (like asking for percentages instead of adjectives) dramatically improved data usability. -> Async is Essential: Parallelizing API calls reduced analysis time by 40%. -> Users Crave Context: Raw metrics weren’t enough—we added explainable AI elements showing why a company outperforms in certain areas.
What's next for Market Intelligence
-> Expanded Data Sources: Integrate SEC filings and earnings call transcripts for public companies. -> Predictive Modeling: Forecast market shifts using historical trend analysis. -> Collaboration Features: Allow teams to annotate and share reports within the platform. -> Mobile Optimization: Bring these insights to smartphones with a React Native app.

Log in or sign up for Devpost to join the conversation.