-
-
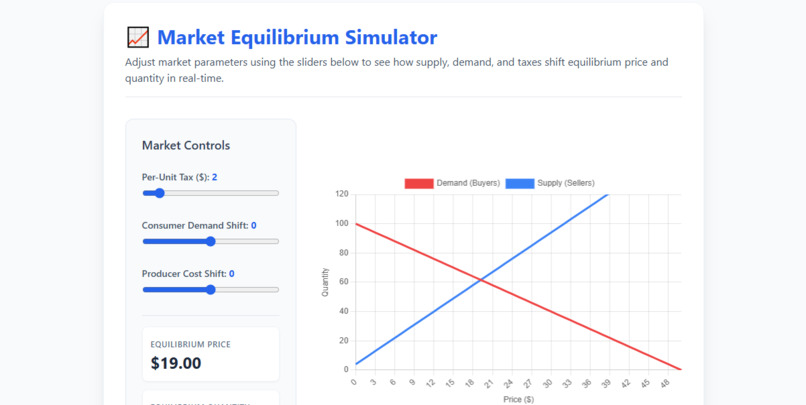
This is What are Main Page looks like where you can actually work on
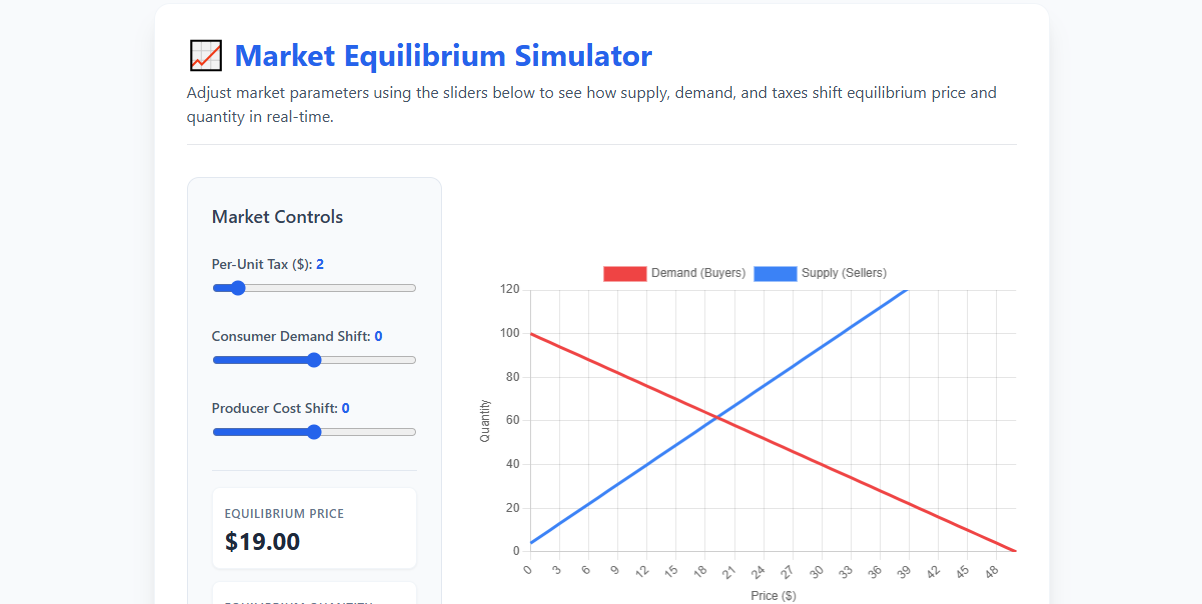
Inspiration
Understanding microeconomics concepts like supply, demand, and market equilibrium can often feel abstract when looking at static textbook diagrams. We were inspired to create the Market Equilibrium Simulator to bridge the gap between theoretical economic concepts and interactive visual learning. Our goal was to build a clean, instant tool that allows students and teachers to manipulate market forces in real-time.
What it does
The Market Equilibrium Simulator is a web application that visualizes supply and demand shifts dynamically:
- Interactive Sliders: Users can adjust per-unit taxes, consumer demand trends, and producer cost shifts.
- Real-time Charting: Renders smooth Demand (Buyers) and Supply (Sellers) curves dynamically.
- Automated Calculations: Computes exact market equilibrium prices and quantities dynamically based on user input.
How we built it
We built this application with a lightweight, client-side stack to ensure maximum speed and zero downtime:
- HTML5: Structured the simulator layout and interactive control panel.
- Tailwind CSS: Styled the user interface with modern, responsive styling.
- Chart.js: Handled canvas rendering for real-time dynamic curve updates.
- JavaScript: Implemented linear mathematical models for demand and supply calculations.
Challenges we faced
- Intersection Logic: Implementing precise real-time calculations to find where the linear demand and supply functions intersect ($Q_d = Q_s$) across price ranges without causing chart lag.
- Clean UI Layout: Designing a responsive dashboard layout that keeps user controls side-by-side with live metrics and charts.
Accomplishments that we're proud of
- Created a zero-dependency, client-side application that loads in under a second in any browser.
- Built a clear, intuitive UI that translates complex economic equations into real-time visual feedback.
What we learned
- Learned how to effectively integrate Chart.js for real-time dynamic data updating.
- Gained hands-on experience structuring linear mathematical models into dynamic JavaScript algorithms.
What's next for Market Equilibrium Simulator
- Adding controls for Price Ceilings and Price Floors.
- Visualizing Deadweight Loss and Consumer/Producer Surplus regions directly on the chart canvas.
- Supporting multi-product market comparisons.
Built With
- chart.js
- css3
- github
- html5
- javascript
- tailwind
- vercel


Log in or sign up for Devpost to join the conversation.