-
-
App Screenshot
-
App Screenshot
-
App Screenshot
-
App Screenshot


Inspiration
Markets are flooded with confident narratives — headlines that sound convincing, trend strongly on social media, and often move sentiment indicators. But as investors, we kept asking a simpler question:
When does the story stop matching reality?
Most sentiment tools measure how positive or negative the news is. Very few measure whether that sentiment is actually reliable when compared to real price movement. We were inspired to build a tool that doesn’t just summarize narratives, but tests them against market outcomes.
What it does
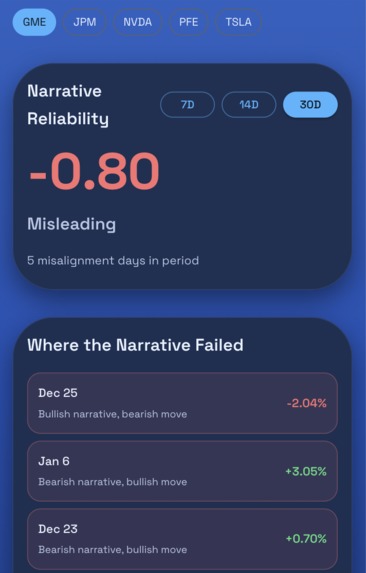
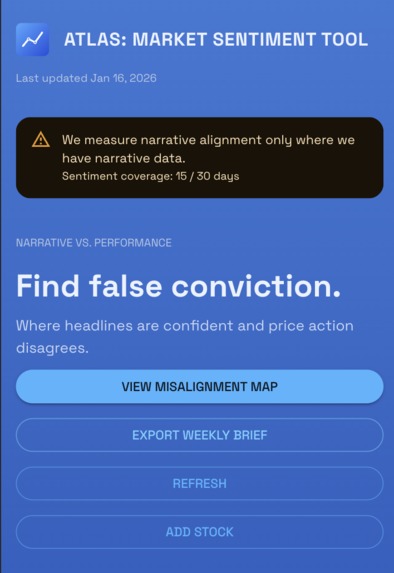
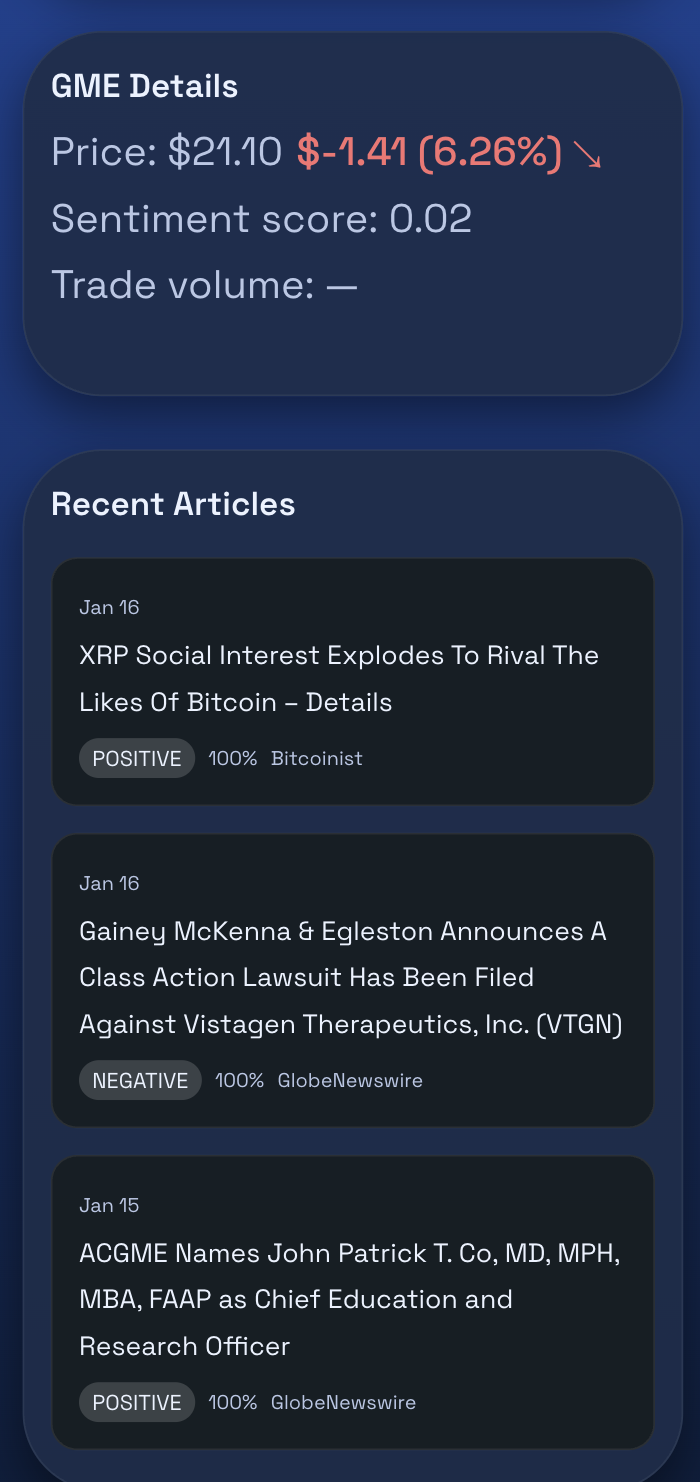
Market Atlas detects moments of false conviction — periods where headlines and sentiment are confident, but price action disagrees.
For each stock, the app:
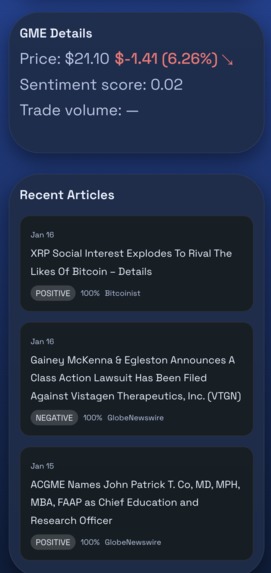
- Aggregates daily news sentiment
- Compares it to actual price returns
- Computes a Narrative Reliability Score over 7 / 14 / 30 days
- Surfaces misalignment days, where bullish narratives coincided with falling prices (or vice versa)
- Allows users to drill down into the actual headlines behind those failures
The result is not just a score, but an auditable story: Score → Failure → Evidence
How we built it
Backend
- Python + FastAPI for the API layer
- Supabase (Postgres) for structured storage
- Background worker pipeline for ingestion and computation
- Daily jobs to:
- Ingest news articles
- Score sentiment using an ML model (with chunking to handle token limits)
- Aggregate daily sentiment
- Ingest historical and daily prices
- Compute rolling alignment metrics
Frontend
- Next.js (App Router)
- TypeScript
- Material UI for fast, consistent layout
- A narrative-driven UI that prioritizes insight over charts
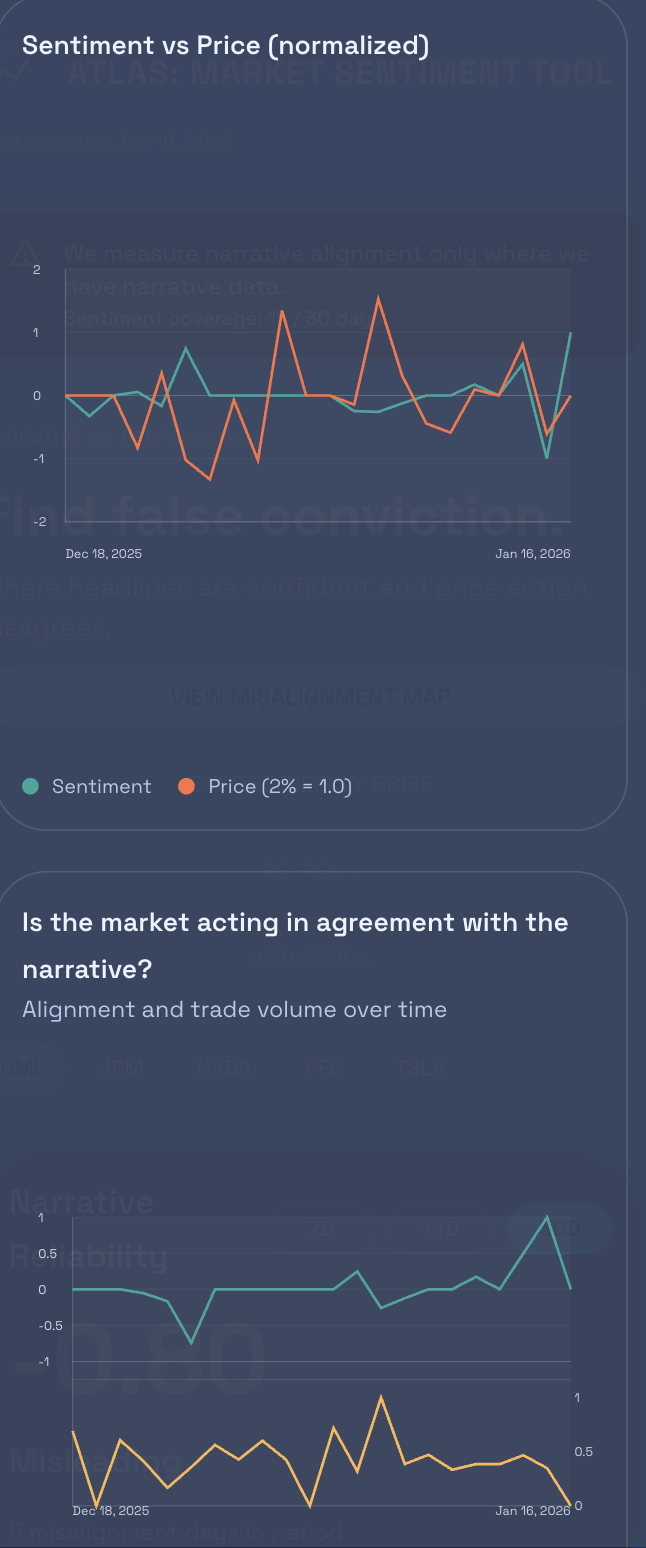
Key Metric
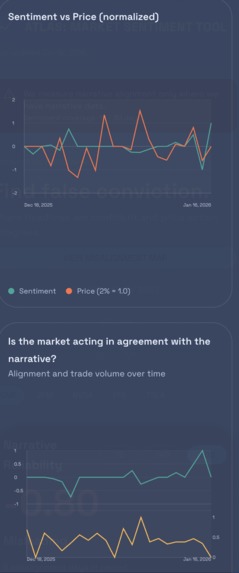
Narrative alignment is computed using:
- Directional agreement between sentiment and returns
- Strength-weighted misalignment detection
- Rolling windows instead of single-day noise
All external data fetching happens outside the UI. The frontend only reads from the database, ensuring consistency and speed.
Challenges we ran into
- Data coverage limits: Free news APIs only provide limited historical depth, forcing us to explicitly track and surface sentiment coverage.
- Token limits in ML models: Articles often exceeded model limits, requiring chunking and aggregation without biasing results.
- Avoiding noisy metrics: Simple correlation alone was misleading; we had to combine direction, magnitude, and confidence.
- UI clarity: The hardest part was deciding what not to show and framing the data as a clear narrative.
Accomplishments that we're proud of
- Turning abstract sentiment analysis into a testable, falsifiable signal
- Making misalignment auditable through real headlines
- Building a full ingestion → scoring → aggregation → visualization pipeline during a hackathon
- Designing a UI that tells a story instead of overwhelming users with charts
- Explicitly communicating uncertainty and data coverage
What we learned
- Sentiment alone is cheap; sentiment reliability is hard
- Alignment matters more than raw positivity
- Clear narratives beat complex metrics
- Precomputing metrics is far more scalable than calculating them on every page load
- Strong framing can make existing data feel entirely new
What's next for Market Atlas
- Expand narrative sources (earnings calls, social platforms, analyst notes)
- Improve alignment math with volume- and confidence-weighted signals
- Add a full misalignment map across stocks and time
- Generate automatic explanations for why narratives failed
- Turn misalignment detection into alerts and weekly briefs
Market Atlas isn’t about predicting markets. It’s about knowing when not to trust the story.
Built With
- distilroberta-financial-sentiment
- fastapi
- newsapi
- nextjs
- postgresql
- python
- supabse
- typescript
- yahoo-finance

Log in or sign up for Devpost to join the conversation.