Inspiration
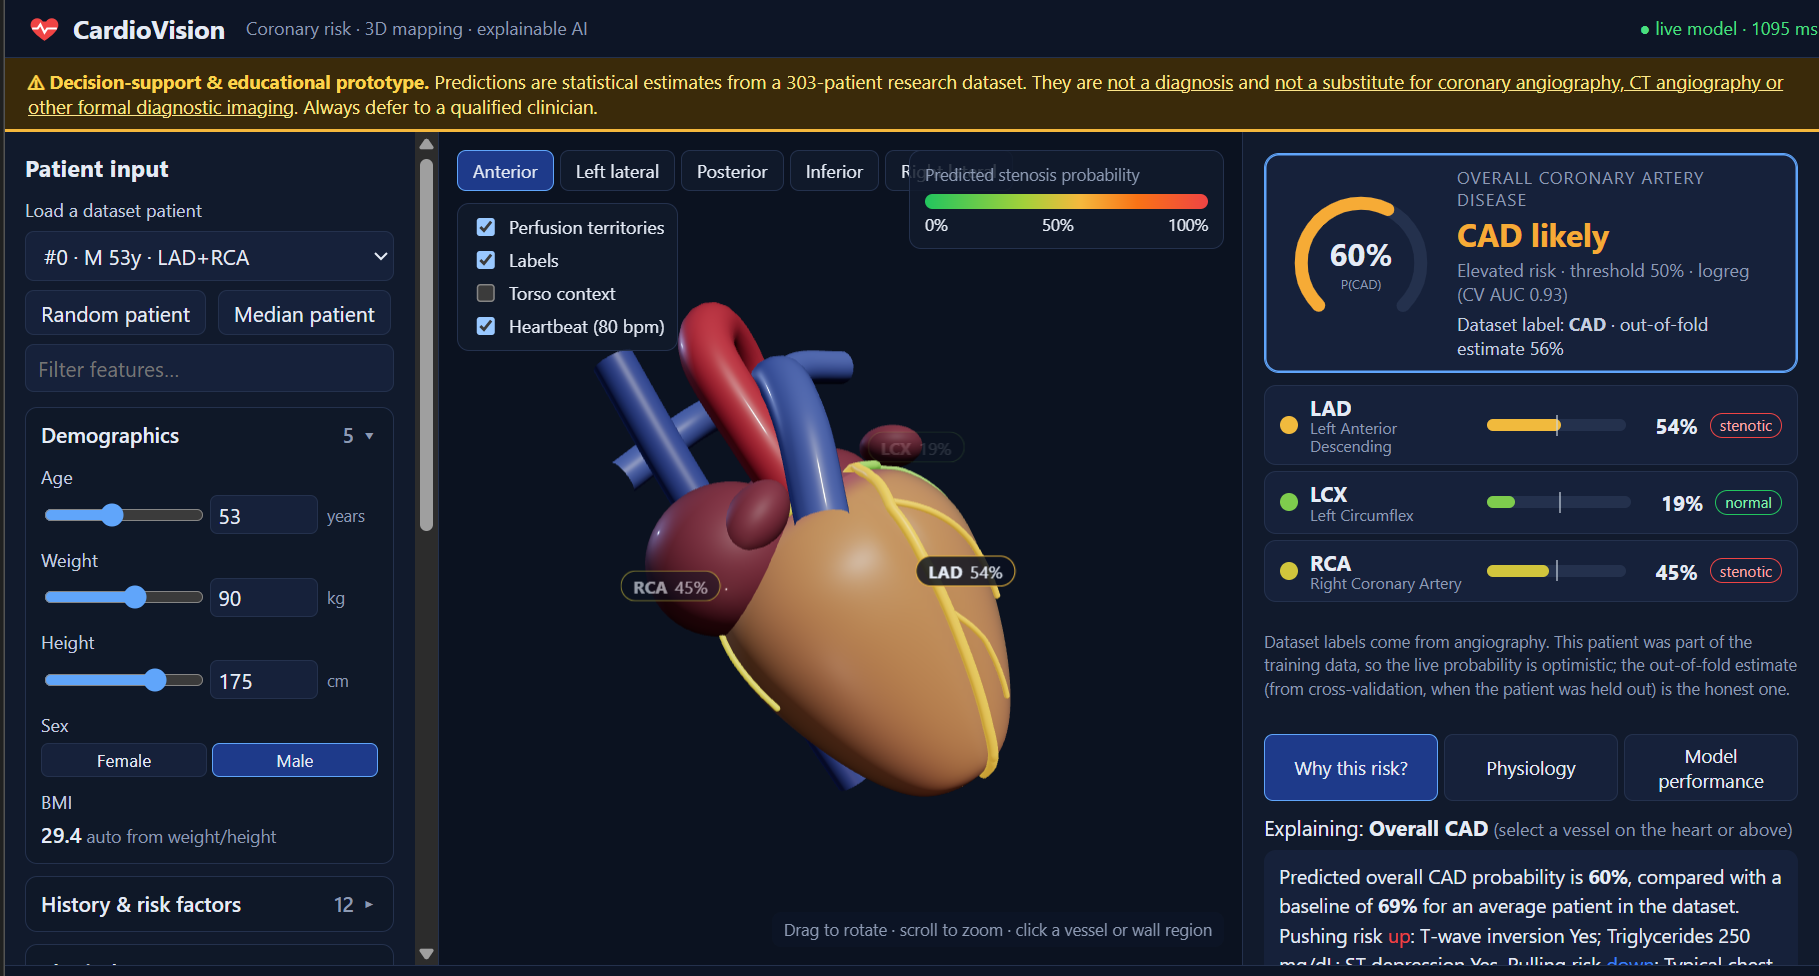
Coronary angiography is the gold standard for diagnosing coronary artery disease (CAD), but it's invasive, expensive, and not something you can run on every at-risk patient. Clinicians already have cheap, non-invasive signals — demographics, ECG, labs, symptoms — long before anyone reaches for a catheter. We wanted to see how far a model could get using only that pre-angiogram data, and more importantly, make the result something a clinician (or a curious patient) could actually see and trust, instead of a black-box number. That's where the 3D heart came from: stenosis isn't abstract, it lives on a specific vessel (LAD, LCX, or RCA), so the UI should show it there.
What it does
CardioVision takes ~50 clinical features (history, exam, ECG, labs, echo) and predicts:
- Overall CAD risk ($P(\text{CAD})$ from the Cath label)
- Per-vessel stenosis risk for LAD, LCX, and RCA independently
Every prediction comes with a SHAP explanation — "why this risk" in terms of the original clinical features, not one-hot encoded internals — and maps the per-vessel probability directly onto a procedurally generated, anatomically laid-out 3D heart with correct coronary perfusion territories, so you can rotate the heart and watch the risk color-code the exact vessel at fault.
How we built it
- Data & modeling: the Z-Alizadeh Sani dataset (303 patients, UCI ML Repo). Phase 0 was a full audit (missingness, label consistency between Cath and the three vessels, near-constant columns) before touching the data. We trained three candidate families per target — logistic regression, random forest, XGBoost — under repeated stratified 5-fold CV ($5\times10$ repeats), selecting the best mean ROC-AUC model per target:
$$\text{AUC}{\text{Cath}} = 0.930,\quad \text{AUC}{\text{LAD}} = 0.853,\quad \text{AUC}{\text{LCX}} = 0.743,\quad \text{AUC}{\text{RCA}} = 0.731$$
- Explainability: a custom Explainer wraps SHAP's LinearExplainer/TreeExplainer and collapses one-hot encoded SHAP values back onto the original clinical feature (e.g. BBB_LBBB + BBB_RBBB → BBB), so additivity ($\sum_i \phi_i + \phi_0 = f(x)$) holds and the explanation reads the way a clinician thinks.
- Backend: FastAPI serving predictions, SHAP contributions, metrics, and demo patients; models load once at startup, SHAP background set is the full training distribution.
- Frontend: React 19 + React Three Fiber. Rather than license a medical mesh, we built the heart procedurally as a parametric surface with hand-placed coronary perfusion territories, so vessel-to-territory correspondence is exact and license-free. Risk probability drives vertex coloring in real time as the patient form is edited (debounced, abortable requests), with a heartbeat animation and camera presets for anterior/other anatomical views.
AI tools used
- Claude Code was the primary builder end-to-end: the data audit script, the schema/preprocessing layer, the training pipeline, the SHAP explainer, the FastAPI backend, and the entire React Three Fiber frontend (including the procedural heart geometry and anatomy data) were built collaboratively with it across the project.
- Claude (Sonnet 5) was used for architecture decisions (model selection strategy, SHAP attribution approach, 3D anatomy data structure) and for the post-hoc efficiency/robustness pass on the finished codebase.
Challenges we ran into
- Small-data modeling (n = 303): aggressive models overfit instantly. We deliberately used conservative hyperparameters (shallow trees, heavy regularization, class-balanced weighting) and leaned on repeated CV rather than a single held-out split to get a trustworthy AUC estimate.
- Leakage discipline: Cath, LAD, LCX, RCA are correlated with each other and with near-proxy columns in the raw sheet. We enforced — and unit-tested — that none of the four targets can ever appear as a model input for any of the others.
- SHAP across three different model families: logistic regression (log-odds, LinearExplainer), XGBoost (log-odds, TreeExplainer), and random forest (probability space, TreeExplainer) each return SHAP values in different units. Unifying these into one consistent "contribution" the UI could render — and collapsing one-hot columns back to the original feature without breaking additivity — took real care.
- Anatomically honest 3D mapping without a licensed mesh: building a parametric heart surface with correct LAD/LCX/RCA perfusion territories from scratch, and keeping it performant (dirty-checked vertex-color updates instead of full geometry rebuilds every frame), was the trickiest frontend problem.
What we learned
- A clean single source of truth for schema (data.py) and UI metadata (features_meta.py) pays for itself the moment you have a model pipeline, an API, and a form-rendering frontend all needing the same facts.
- Explainability is a UX problem as much as an ML one — SHAP values are only useful if they're mapped back to language and visuals a non-technical user already understands.
- Procedural 3D content can beat a downloaded asset when you need exact semantic correspondence (vessel → territory) that a generic mesh can't guarantee.
Built With
- fastapi
- python
- react
- scikit-learn
- shap
- three.js
- xboost

Log in or sign up for Devpost to join the conversation.