Inspiration
The inspiration behind MapYourFashion was to create an interactive way to know which brands of fashion are popular on distinct geographical places around the world.
What it does
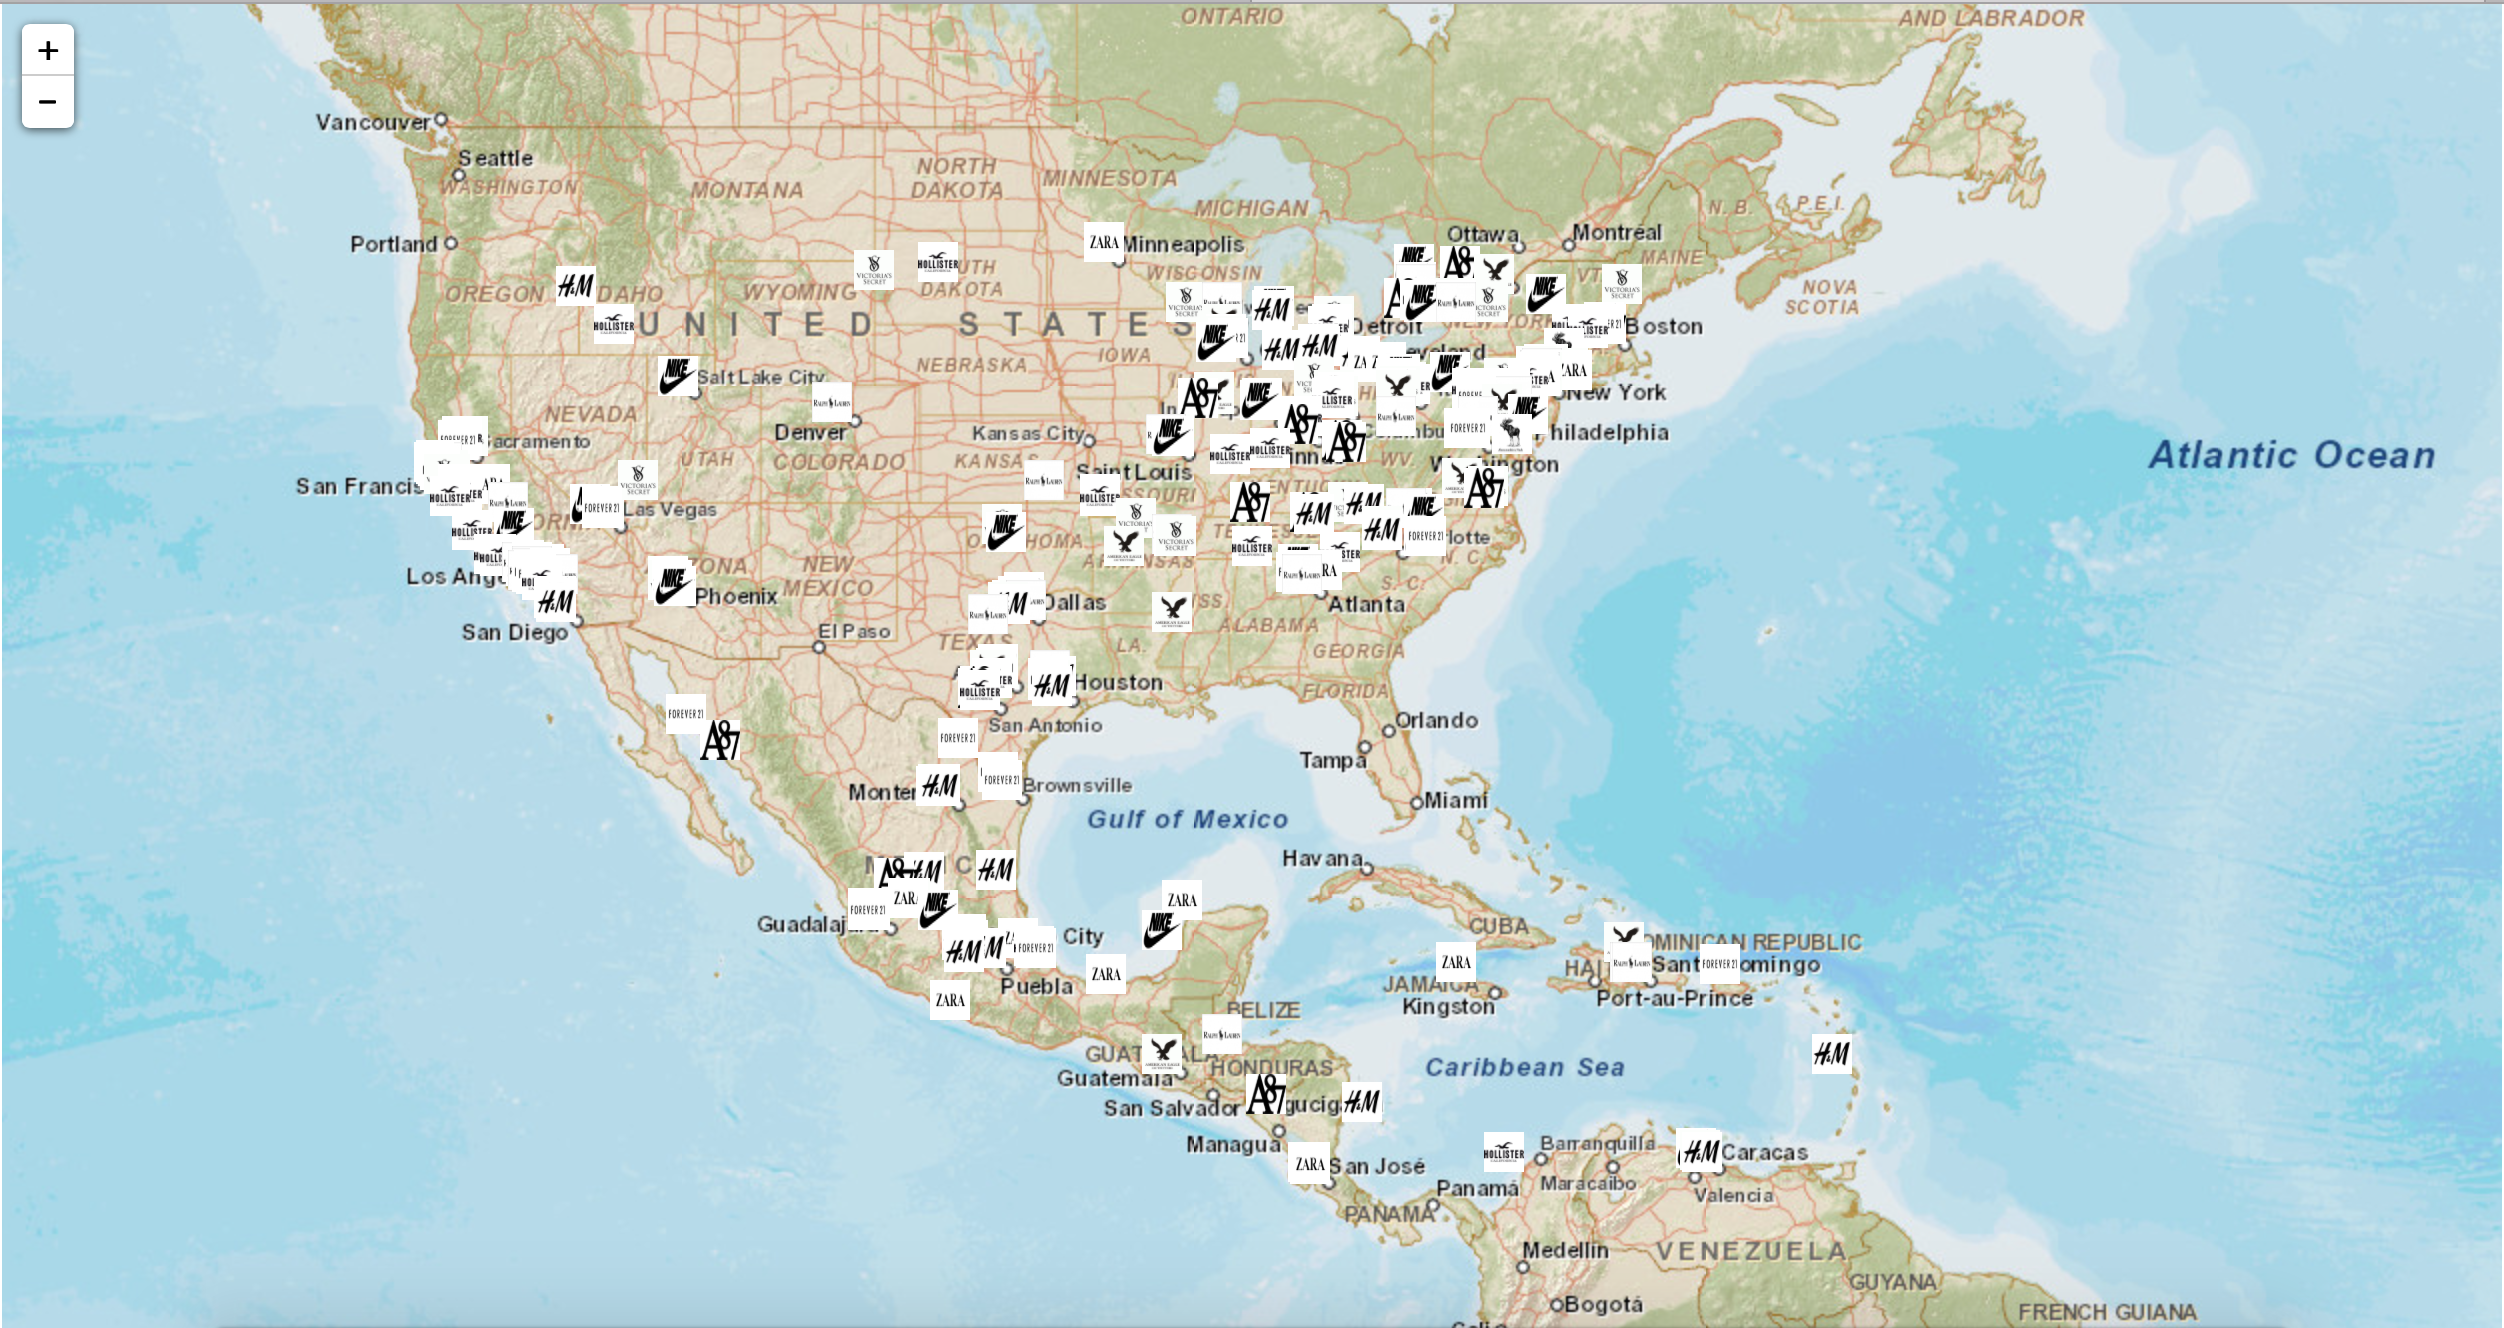
It takes social data from twitter and creates an interactive map in which it plots where people have tweeted about famous fashion brands.
How I built it
It was built using the Twitter API, the Twython python package and python. Also, the statistic software package R and shiny.
Challenges I ran into
I would say that the most challenging thing we ran to was the data mining process.
Accomplishments that I'm proud of
This is my first time using an API of any kind so I'm really proud of that. Also, I've used shiny before but not anything like what was accomplished with MapYourFashion.
What I learned
I further my knowledge in python and R. Also, I learned how to use the Twitter API.
What's next for MapYourFashion
We want to create a full fed web application that uses live social data to create an interactive map that plots hot fashion brands all around the world in order to know what to wear and where to where it. We think that the application has a lot of potential in the marketing field, specially for this big fashion brand companies.
Built With
- api
- leaflet.js
- python
- r
- shiny
- twython


Log in or sign up for Devpost to join the conversation.