-
-

capa
-
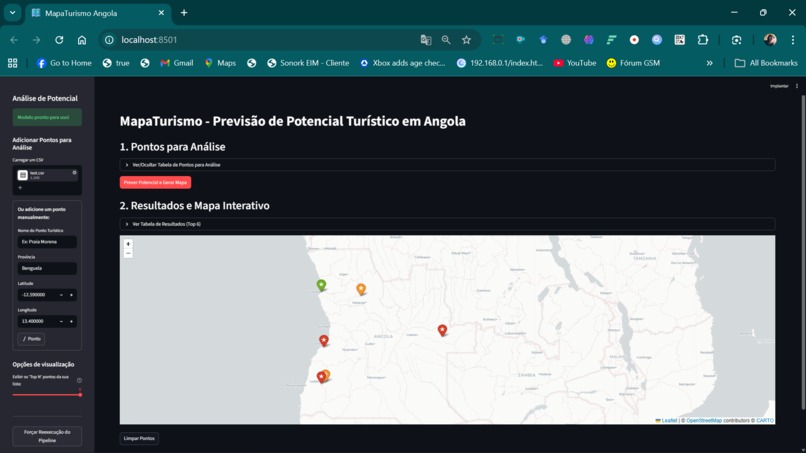
Dashboard main

Inspiration
Angola possesses immense, yet largely untapped, tourism potential—from the Kalandula waterfalls to the Namib Desert, and the biodiversity of the Okavango Valley. However, there is a lack of an objective, data-driven tool to help local governments, investors, and tourism operators identify which locations have the greatest potential for sustainable development. The inspiration stems from the need to transform decisions based on intuition into decisions based on evidence.
What it does
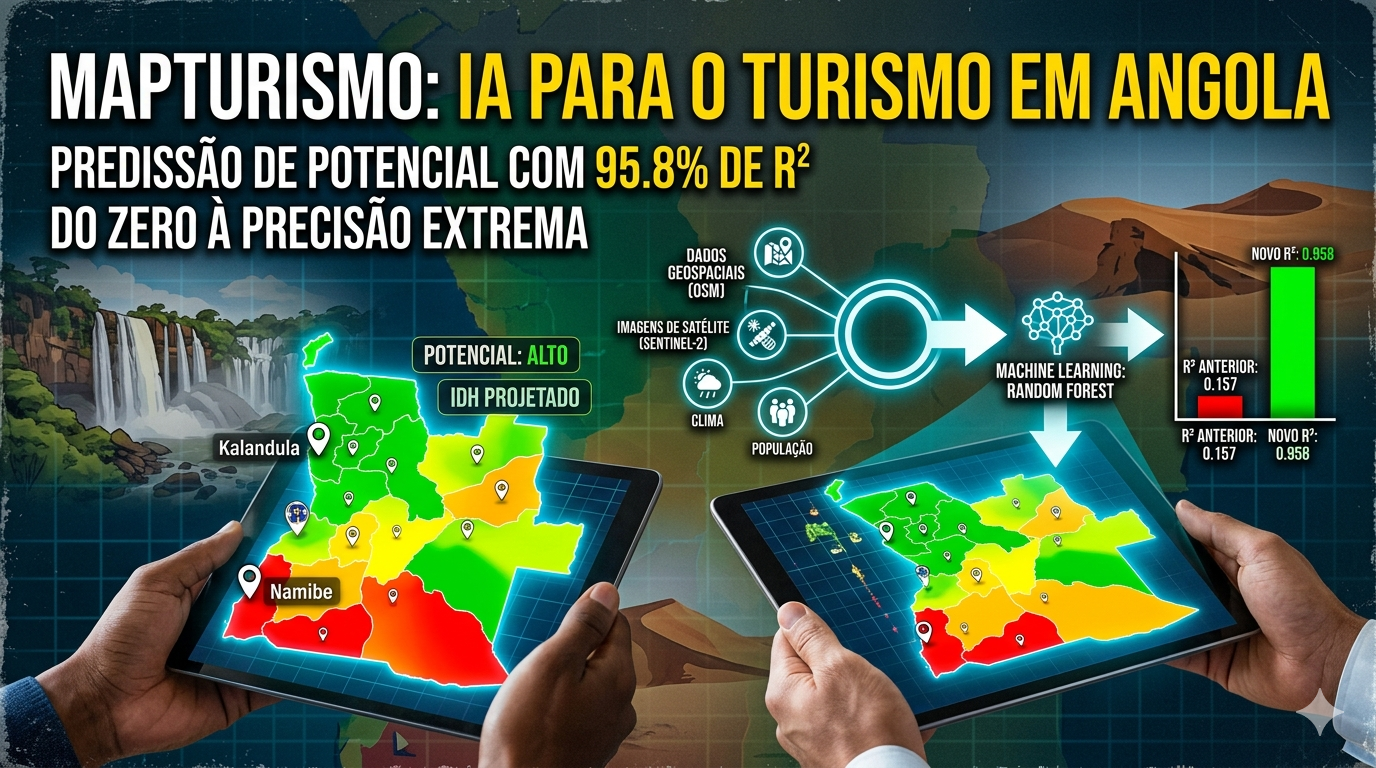
MapTurismo is a machine learning model that classifies the tourism potential of locations in Angola. Based on geospatial data (vegetation, altitude, climate, proximity to water), infrastructure (access, roads, points of interest), and socioeconomic data (population density, local development), the model assigns a Human Development Index (HDI) score and a tourism potential category to each location. The result is an interactive map that guides strategic planning and investment in sustainable tourism.
How we built it
Our process was divided into four main stages, from raw data to an interactive tool:
Data Collection and Integration: We started by building a rich geospatial dataset, integrating multiple public data sources: infrastructure data from OpenStreetMap, satellite imagery from ESA (Sentinel-2), historical climate data, and population censuses from Angola.
Feature Engineering: With the raw data, we created high-value features for the model, such as the vegetation index (NDVI), distances to critical infrastructure (roads, hospitals), and the density of points of interest (schools, restaurants) in each location.
Predictive Modeling: To predict development potential (measured by the HDI), we approached the problem as a regression task. Our chosen model was RandomForestRegressor, due to its robustness with complex datasets and its ability to capture non-linear relationships between features.
Visualization and Interface: Finally, to make these insights accessible, we developed an interactive dashboard using Streamlit and Folium. The interface allows users to explore the results on a map of Angola, comparing the projected potential of different tourist attractions.
Challenges we ran into
Our biggest challenge was the scarcity and heterogeneity of data in Angola. Our first prototype, trained with only 15 tourist sites for which we had confirmed HDI data, resulted in a very poorly performing model (an R² of only 0.157), which was useless for real-world predictions. Furthermore, integrating such diverse data—vector geospatial data (OpenStreetMap), satellite raster data (Sentinel-2 for NDVI), and tabular data (censuses)—required a complex and error-prone ETL (Extraction, Transformation, and Loading) pipeline.
Accomplishments that we're proud of
Our greatest achievement was transforming a low-performing model into a high-precision forecasting engine. By methodically increasing our dataset through data collection for over 100 locations, we managed to increase the R² of our model from 0.157 to an impressive 0.958. We are especially proud to have built an end-to-end pipeline, which goes from raw data collection and feature engineering (such as calculating NDVI from satellite images) to an interactive dashboard that makes the insights actionable for anyone interested in investing in Angola.
What we learned
We learned, in a very practical way, that in data science, the quality and quantity of data almost always outweigh the complexity of the algorithm. The transition from a useless model to a highly accurate one did not come from fine-tuning hyperparameters, but rather from the hard work of enriching our dataset. We also learned the value of rapid prototyping; using tools like Streamlit allowed us to validate our ideas and share our results interactively much faster.
What's next for MapTurismo
The next step is to evolve MapTurismo from a diagnostic tool to a simulation tool. We want to implement a "What-if" functionality, where a user can simulate the impact of new investments. For example: "What would the new predicted HDI be if we built a new paved road or three new schools in this area?". Furthermore, we plan to enrich our model with more data sources, such as local economic indicators and social media sentiment data to capture tourist perception.
Built With
- esa
- folium
- geopandas
- matplotlib
- numpy
- osm
- osmnx
- overpassapi
- pandas
- python
- scikit-learn
- seaborn
- streamlit


Log in or sign up for Devpost to join the conversation.