-
-
test run #1
-

test run #2
Inspiration
Information today is increasingly consumed through audio—lectures, meetings, podcasts, and interviews—but audio is inherently linear and difficult to revisit. We were inspired by the question: what if spoken ideas could be transformed into structured, visual workflows automatically?
We wanted to help students, researchers, and creators turn dense audio into something explorable, skimmable, and actionable.
What it does
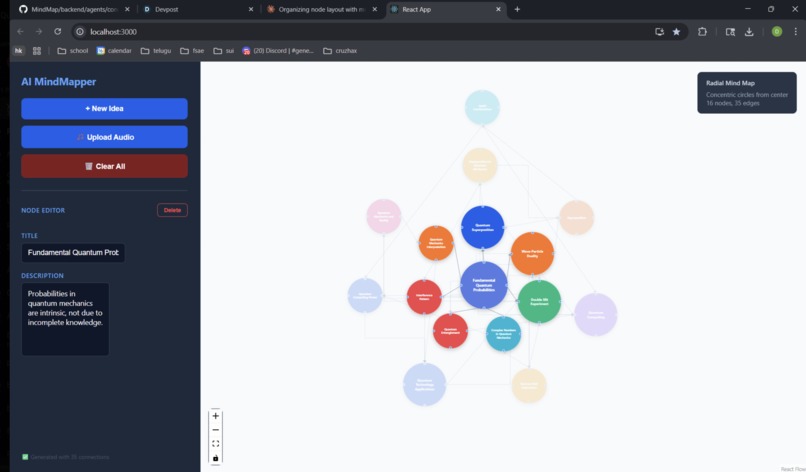
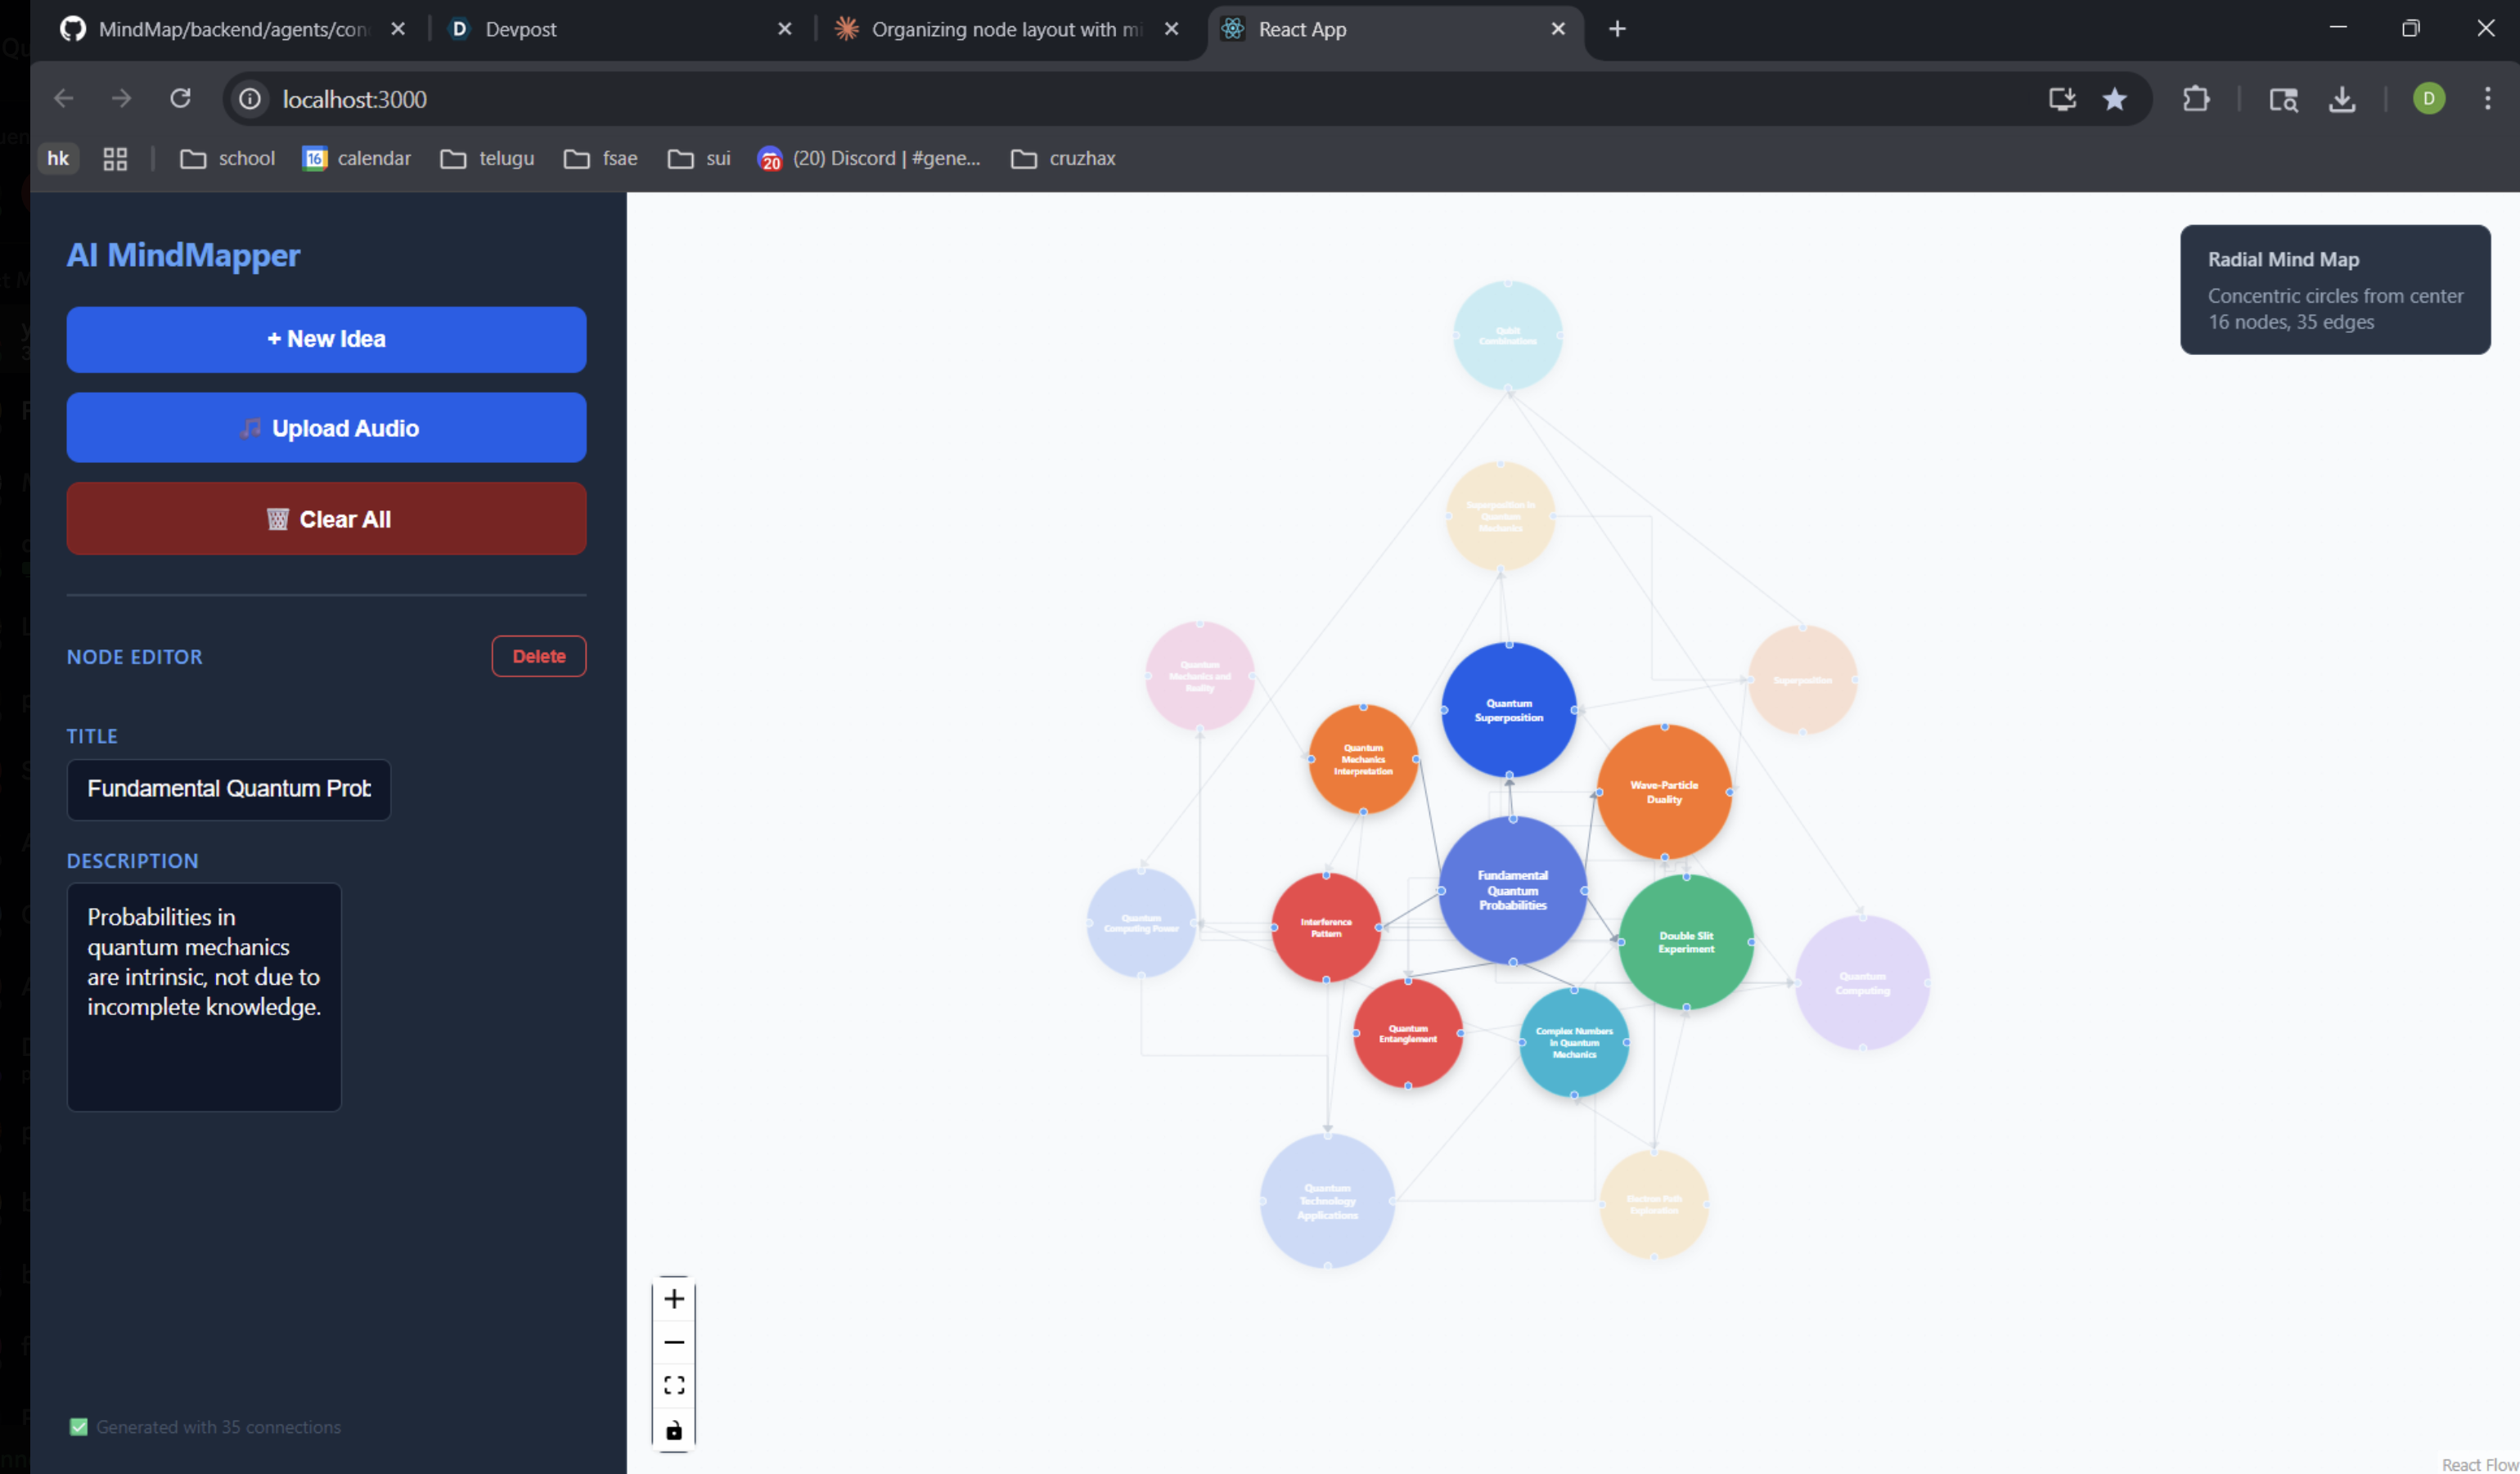
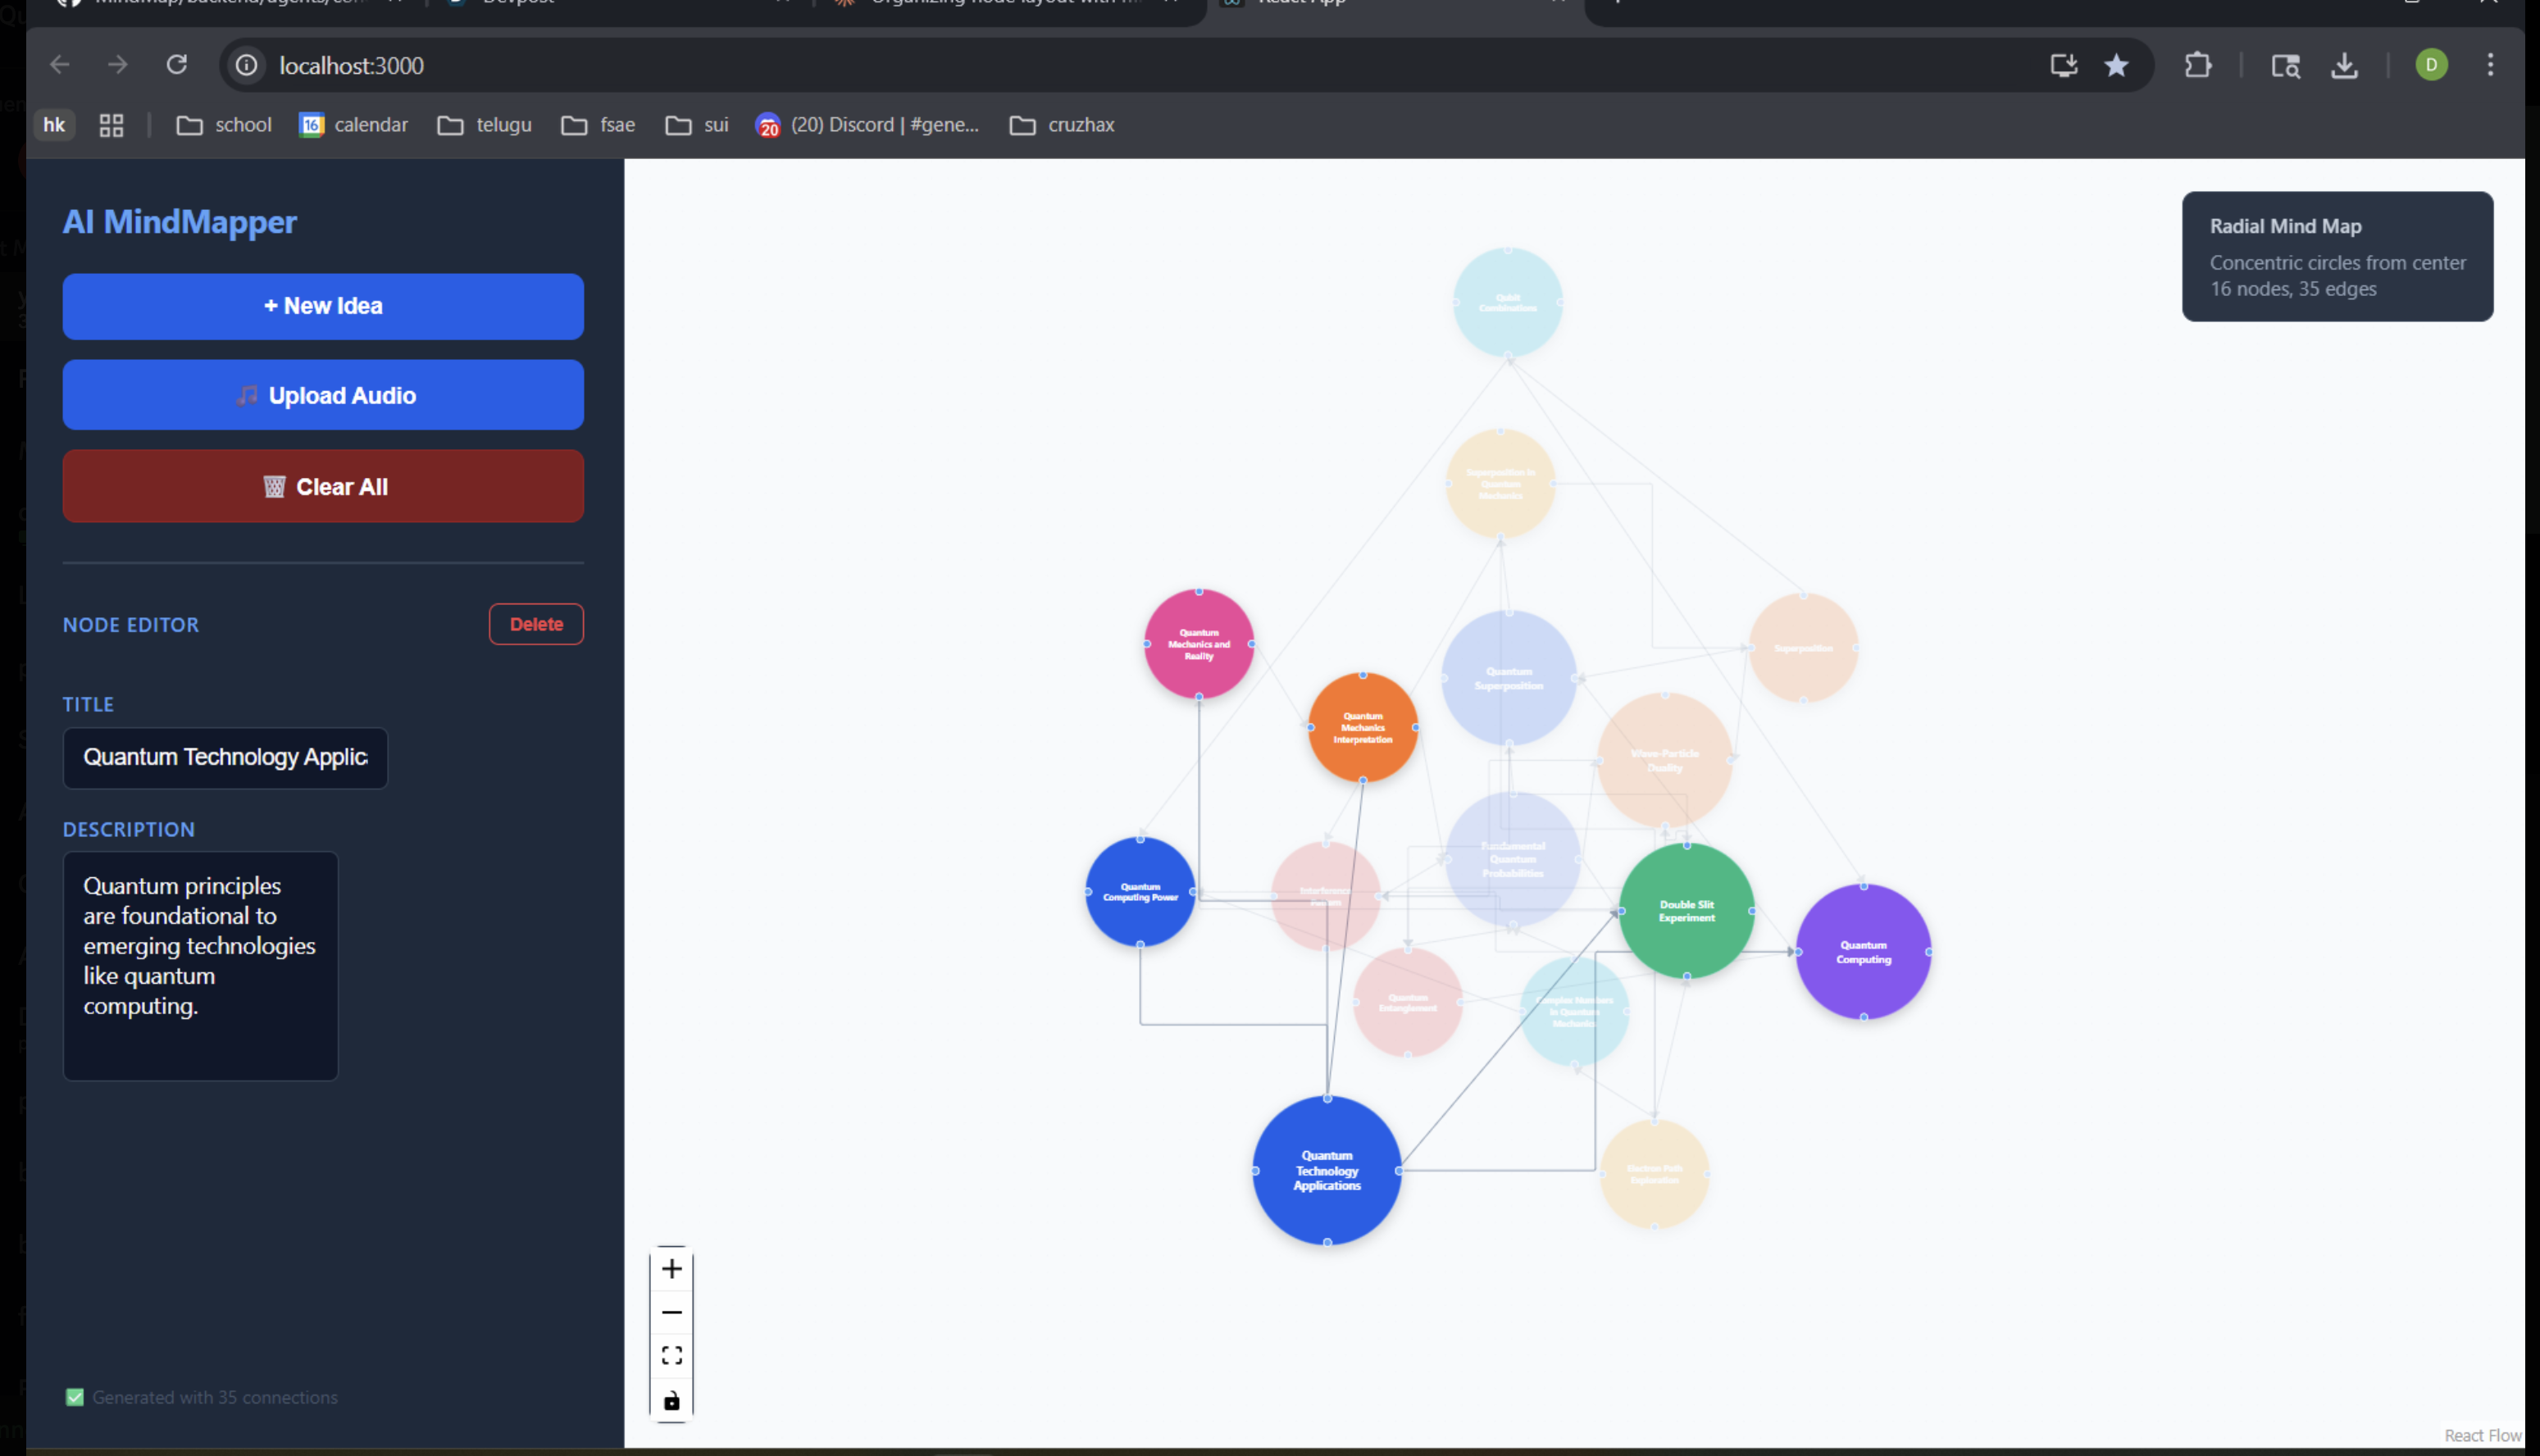
Mappit! takes an audio file as input and automatically generates a visual flowchart representing the key ideas, concepts, and relationships discussed in the audio. Instead of reading long transcripts, users can explore a structured graph that highlights major themes while still preserving supporting details.
How we built it
We designed Mappit! as a modular pipeline powered by AI agents:
- Speech-to-text using Whisper to generate accurate transcripts
- Concept extraction agents that identify topics, subtopics, and relationships
- Node generation agents that create raw graph nodes from extracted concepts
- Cleaning and filtering logic to reduce noise and organize the graph
- Frontend visualization using an interactive flowchart interface to display nodes and edges
Each agent operates independently, acting like a function in the pipeline. This made the system easier to debug, extend, and iterate on under hackathon constraints.
Challenges we ran into
One of our biggest challenges was overpopulation of the graph. Audio naturally contains many small, niche ideas, and naïvely converting them into nodes resulted in cluttered and overwhelming visualizations. Balancing completeness with clarity—deciding what concepts truly mattered—was a nontrivial problem.
We also faced challenges in designing layouts that felt intuitive rather than chaotic, especially as the number of nodes increased.
Accomplishments that we’re proud of
- Successfully transforming raw audio into a structured visual representation
- Building a fully modular, agent-based pipeline that can be extended easily
- Creating an interactive flowchart that makes long-form audio more digestible
- Tackling a real usability problem rather than just a technical one
What we learned
We learned that visual clarity is just as important—if not more—than model accuracy. Extracting information is easier than organizing it in a way that humans actually want to explore.
We also gained valuable experience working with multi-agent AI systems, designing pipelines under time pressure, and iterating quickly based on visual feedback.
What’s next for Mappit!
- Introduce hierarchical abstraction, grouping minor nodes under higher-level concepts
- Add importance scoring so only the most relevant ideas appear by default
- Improve graph layout and clustering for readability
- Improve connections between nodes
- Enable live usage, such as live streams or real-time video conferencing

Log in or sign up for Devpost to join the conversation.