-
-
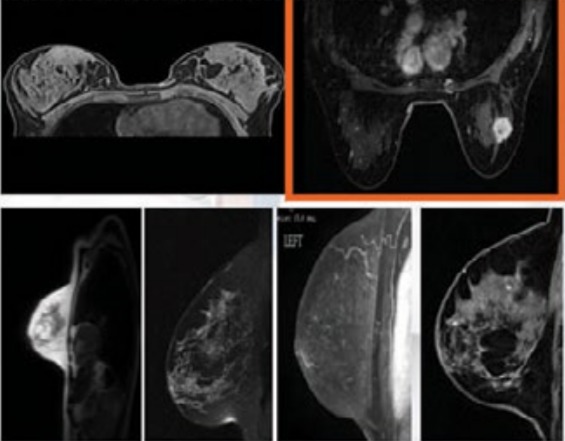
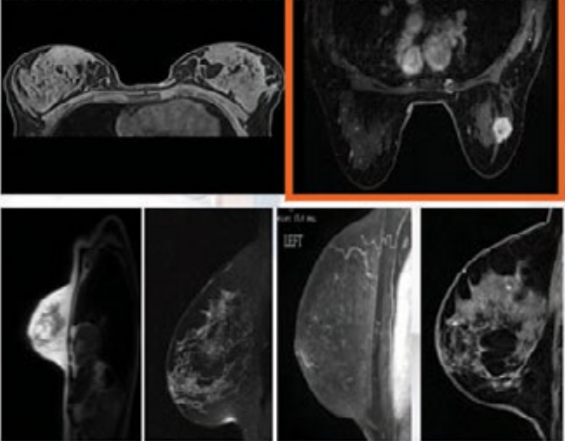
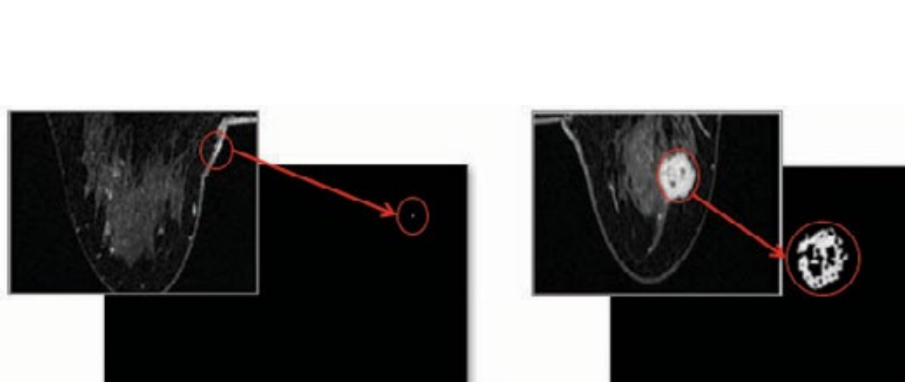
Figure 1:Images of breast cancer
-
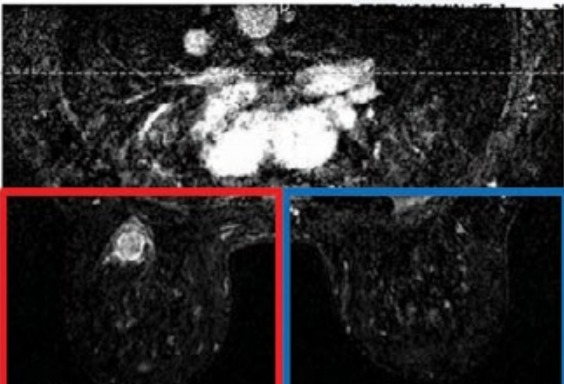
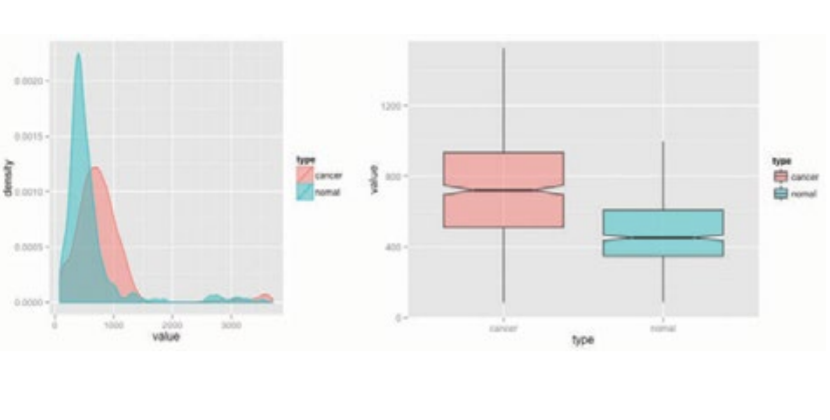
Figure 2: Differentiating the data
-
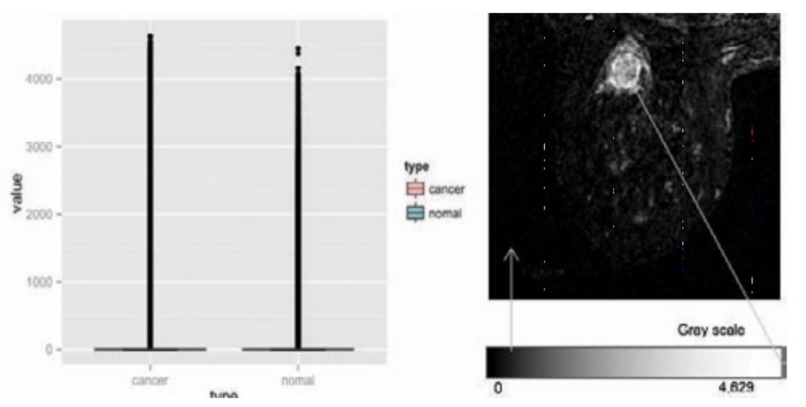
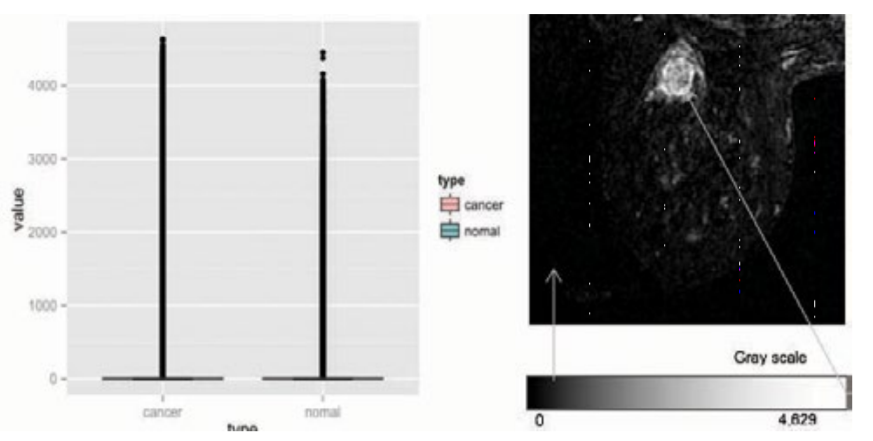
Figure 3: Images and their pixels
-

Figure 4: Image brightness difference
-
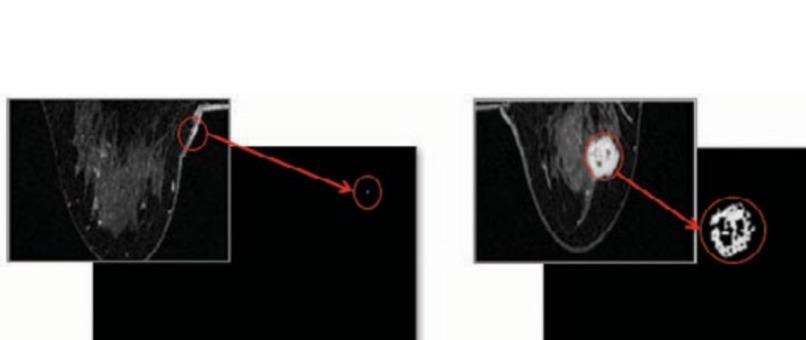
Figure 5: Inverting the colors
-
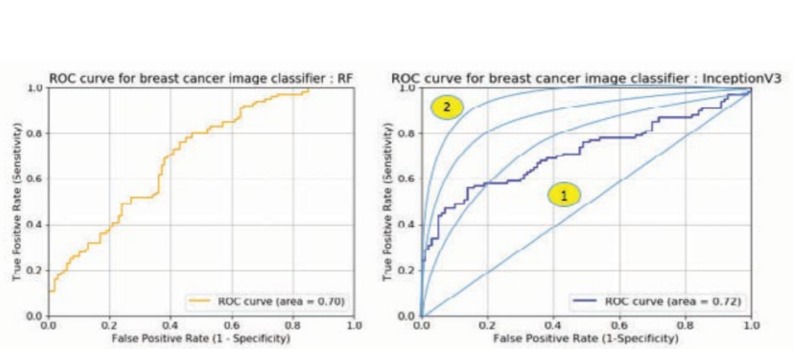
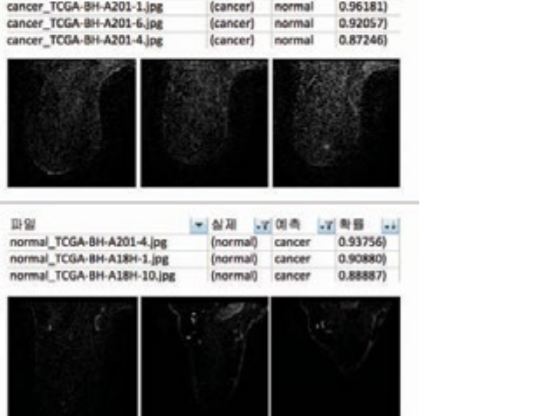
Figure 6: Testing the models and evaluating them
-
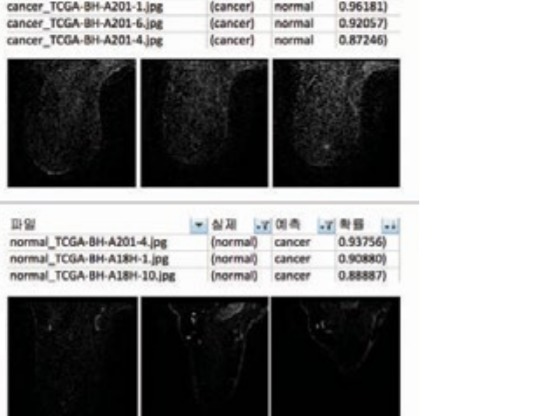
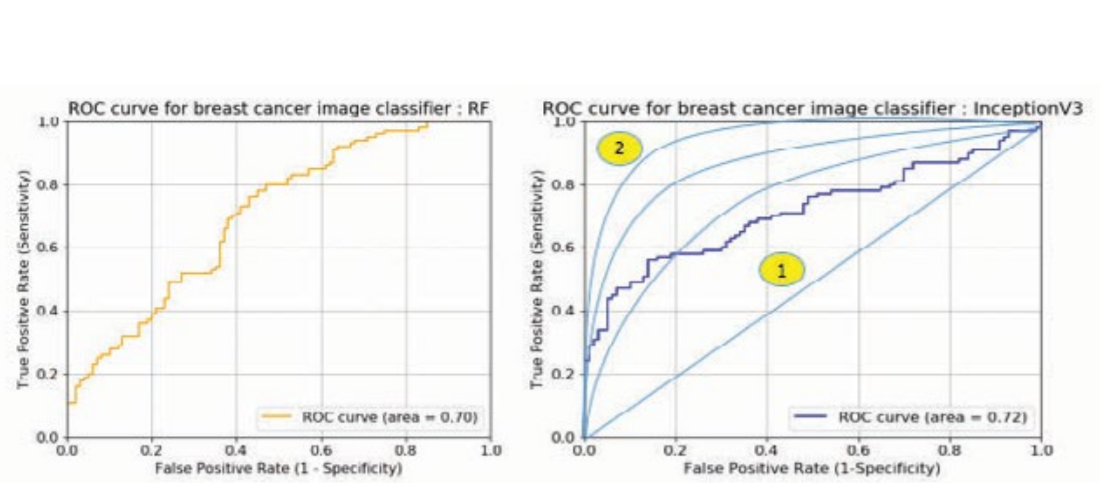
Figure 7: Error testing for machine learning

Why I started this project
Before starting the project, I have wanted to do something that would help the world. Considering the current situation, I thought that the medical area would be best to help the world not only medically but also socially. As the standard of liver life improves, the desire and interest in healthy life are increasing. However, unlike the desire for health, due to various factors such as environmental and genetic factors, cancer has always been something that we can not help with. Breast cancer is the number one cancer in women around the world. So I decided to do something about it.
I have looked at the data and found that among suspected breast cancer patients, only about 0.6 percent were diagnosed as real cancer. Not only it is expensive to check that you have cancer but also it could be a failed diagnostic measure(Meaning that cancer might have been too small to be detected.) The low rate of non-judgment does not mean that social costs such as health insurance are wasted. I came to think about the role of early diagnosis, which is the purpose of physical examination, which is more important and should be a standard measure for everyone.
So, I've come to think that: If I can make a model that can reduce misclassification, it would reduce the cost of the wasted medical examination plus the time for both patients and the doctors. Igo believes it will help determine breast cancer faster and help with early treatment. Using the information from the Cancer Image Archive (TCIA) in the U.S. has clinical information. The breast cancer MRI (magnetic response imaging) and the general examination images can be found and are allowed to be used without any restrictions.
I have targeted the MRI images of real breast cancer patients. Using this information, a patient with an MRI image can summit their image through the system and check if they have breast cancer or not.
How I did it
The next following few headlines will go over detailed steps I took to archive the project. Main steps were
- Collecting Data 2. differentiating data 3. Exploring data 4. Segmentation & Tensorflow Following these steps, I was able to complete the project. Let's dive into the details of each step.
Collecting the data
U.S. TCIA database. Breast Cancer Image Data (BRCA) Data showed 230,167 images of 139 patients (for use). MRI, General Breast Cancer (MG) tests (88.58GB) that have already been performed. Breast cancer MRI images show a variety of different pictures. This analysis shows the complexity of the analysis. Categorized by boxes in [Figure 1] to reduce (complexity) I decided that I would use the images with tumors. 49 different patients with a total of 747 images were selected to collect the data.
Differentiating the data
The collected data of 49 breast cancer patients, differentiated two types of data. Figure 2 Red being cancer and Blue being the Normal person. Using image separation (R). Image data provided by TCIA Digital Imaging and COMmunizations in Medicine (DICOM) were converted to 'oro' so dicom R can be used to read the images. Then It was converted and saved as a JPEG image.
Exploring data
Once you check the distribution of all pixels of two groups, you have to check how different pixels tells which one has cancer and which one does not. Using the R package to draw a boxplot and a density curve, it is easy to see that most pixels are black, however, some parts of it had white and black. So the density curve as shown in [Figure 3] Both these and boxplots are difficult to measure distribution differences between groups, however, a lot of comparisons will make it easier and easier.
However, instead of looking at each pixel color, you can check the overall "Brightness" of the picture to see how much white is in the picture. By only taking top % (Max - min brightness) of the difference, you can easily graph the differentiation which makes it easier to compare which one has more white than the others. Looking at figure 4, it is easier to see which one had a higher brightness than the others. Using ggplot, I was able to tell the 1.802e-12 difference in colors to 20% max difference by only taking top % of the drawing. This 20% difference allows the machine to detect the images with higher accuracy and faster results.
Segmentation & Tensorflow
So after changing the images, how can we make it easier to see cancer from the image? Looking at figure 5 you can see exactly what I did. After figuring out the max difference area from the previous step, I changed the rest of the color to black and left the most different area to white. As you can see the picture without cancer(Left) has little to no white space at all while the picture with cancer (On the right) shows a massive amount of space with white color.
Detecting and predicting the cancer
1,494 image data collected in advance to build the model was used when training the model. The image was divided into 1,294 data for growth and 200 data for model verification. The discriminant model implementation is currently used in deep learning and AI. Based on TensorFlow, Three types of discrimination models were used to discriminate between breast cancer and normal images. K-Nearest Neighbors (kNN), Random Forest (RF) and Convolutional (Deep Neural Network).
Using the Inception V3, a model built by Google for its own image classification, I used the breast cancer images to train and use it again and again. First, the classification result using kNN with k=3 is shown in Figure 6. Sensitivity, which judges cancer as cancer, is 59 out of 100 (59%), and determines the normal judged by the image is 61 out of 100 (61%), and the overall accuracy is showed about 60%.
The second model was the random forest (500 iterations, 100 tree generation, 500 image springs) Model evaluation results: 71 out of 100 patients were diagnosed with cancer. (71%), 42 out of 100 (42%) out of 100 who rated normal as normal The probability was 56.5%. <- I still suspect that this could be a very random number by the computer so I will not include this result.
Finally, Inception V3 model: Results showed that 87 out of 100 patients (87%) who had cancer had cancer and the specificity judged was 65 out of 100 (65%), and the overall accuracy was 76%. Well, this is insane accuracy. But I still had some doubts about this number. So I decided to conduct some error research. (Figure 7 for reference)
The classifiable accuracy is important, but the Type II error, here, although it is a real cancer patient, being judged as normal can be a very critical problem. Therefore, it can be considered that a model with a small error of type 2 is a good model. As shown in table figure 7, the actual type 2 error is also simulated using deep learning. It was confirmed that the type was detected 2-3 times more than the other two models. In order to visualize and evaluate the three models, ROC (Receiver) Operating Characteristic). The graph of the ratio of True Positive to the ratio of Positive (Type I error) was graphed. Random forest classifies cancer patients with less than 40% of error. The Ning method will accurately judge the cancer image at a higher rate near 60%. see. In addition, the area under the actual graph is numerically expressed as AUC (Area Under). Curve) Even if you look at the value, the deep learning method had the best of 0.72 which is way higher than 60% accuracy so I approved the last method of detecting cancer.
The outcome
In conclusion, CDNN derivative Google Inception V3 model (excluding speed) resulted in the best performance. So this Inception v3 model, Can it be applied to real word? Numerical accuracy of 76% and sensitivity of 87%. 76% was a big success rate for me however, I figure that it could increase with way more testing and with way more images to train the algorithm. The use of the Inception V3 model allowed me to successfully detect and predict breast cancer within given images and I believe that 76% accuracy would be high enough for something that I've created during the weekend.
Problems I have faced
Since I am using a computer with less power than what is expected for classifying images, sometimes it would stop on the way making me re-do the whole process again. Thankfully that only happened once so I am glad that it was not a big problem. I also had a hard time reading the images to check what is what, but thanks to different people (Can not name them all) I was able to continue on with the project.
The future that is awaited
The image discrimination model performed in this project was breast cancer only. Which means there is more future that awaits. In addition, I think it is a model that can be classified by expanding and applying it to other cancers and diseases. Of course, there are many obstacles to overcome. For example, in medical images different target (breast, lung, stomach, etc.) and treatment of other organ tissues, noise, and medical devices from multiple manufacturers.\
Well if you think about, any health problem that can be turned into a picture can be detected using the exact same method as above. Doing so will allow us to check what is in your blood (Which is currently the hardest thing to do). Currently, it is said that some places charged up to $3000 just to check for COVID and false treatment for it. To keep people out from this, it can be done that taking the images of blood samples, the same machine learning study can be used to detect the COVID as well and for free. However, that will require more precise and accurate system than this model.
Final words
I really enjoyed coding by pulling a night. Had so much fun doing things I love and got to learn things on the way. Such an amazing time. I also intend to expand on this way more and hopefully, patent this so that it can be used privately by different hospitals and doctors. Also, I never really used GitHub before (I think my friend taught me how to upload stuff and did it with me but that's all I know)
Built With
- dicom
- knn
- machine-learning
- python
- tensorflow


Log in or sign up for Devpost to join the conversation.