-
-
# Mapping Flood Damage from Space
Inspiration
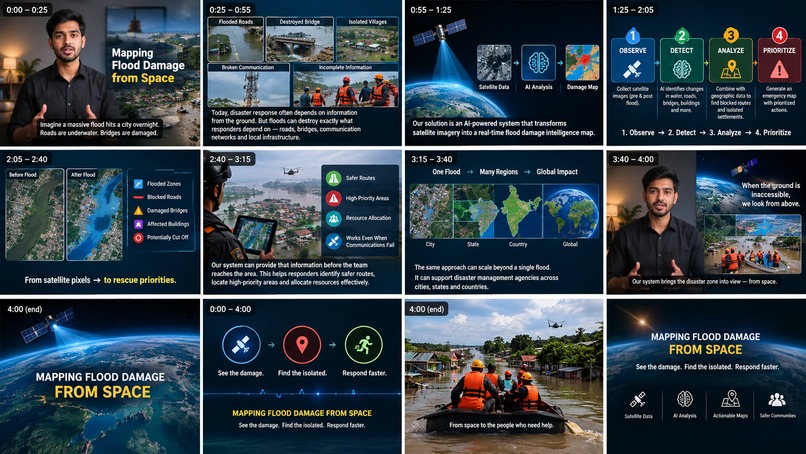
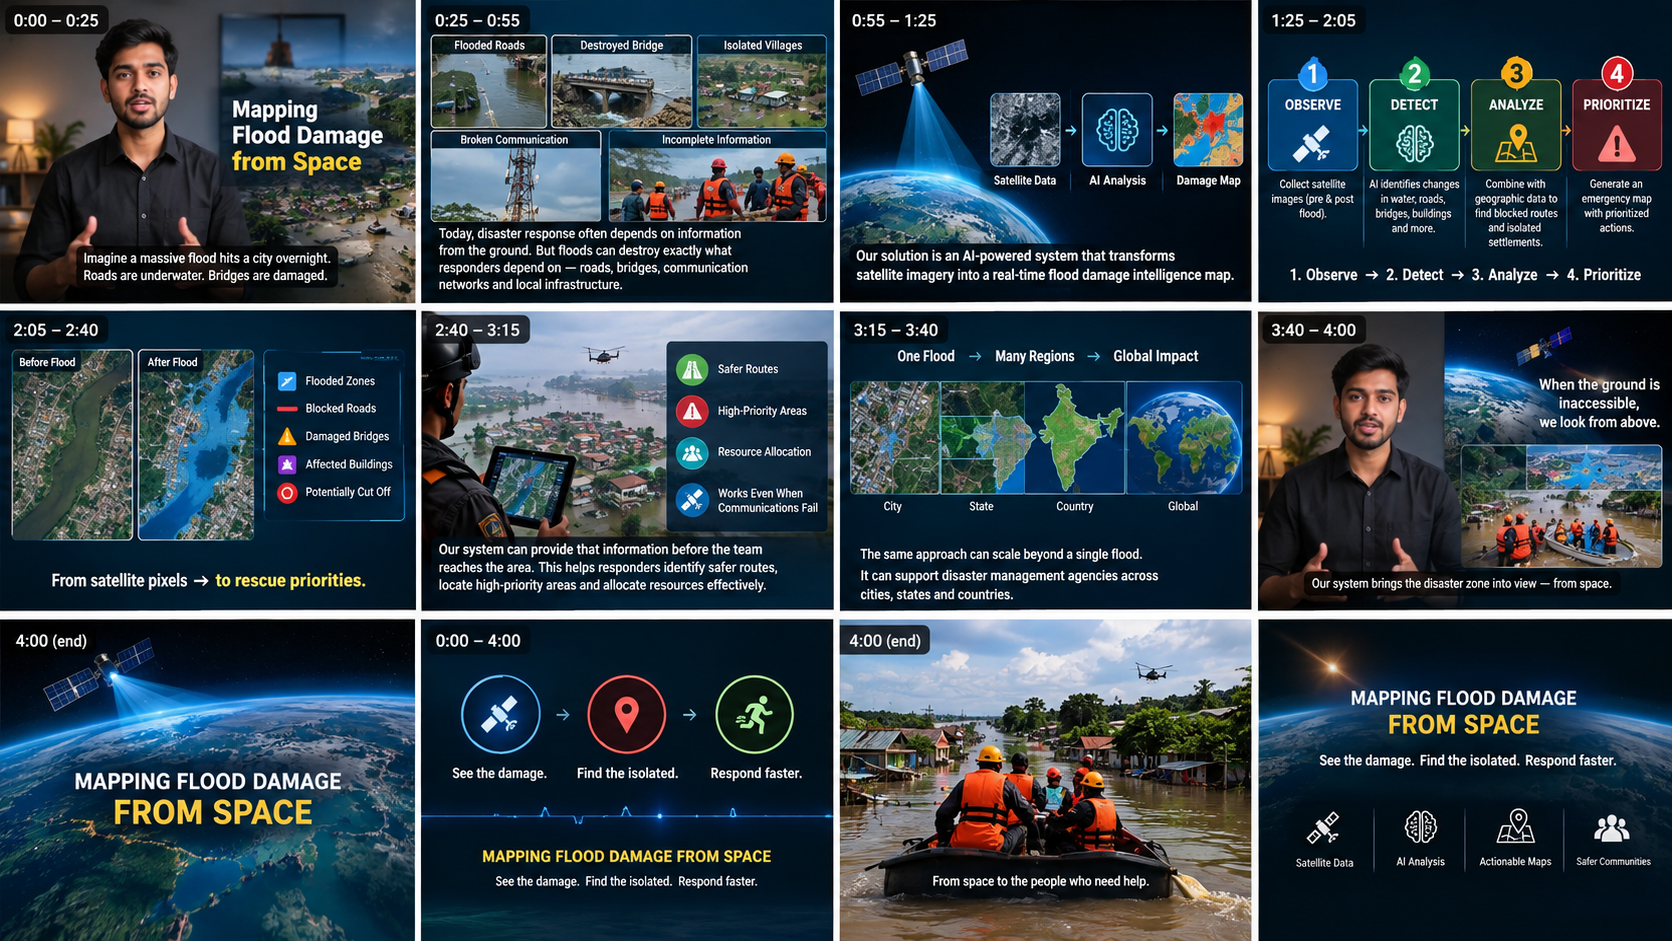
When a flood hits, the first things to fail are roads, bridges and phone lines. That is also when rescuers most need to know what is damaged and which villages are cut off. Ground surveys take days, and ordinary satellite photos are blocked by the same storm clouds that cause the flood. We asked a simple question: if the ground can't tell us, can the sky? Radar satellites see through clouds and night, so we built FloodSight around them.
What it does
FloodSight turns one satellite pass into a rescue map. In our prototype you can:
- Raise the water with a flood slider, presets (Pre-flood, Moderate, Severe, Extreme), or a "Play flood rise" animation on a radar-style map.
- See which roads and bridges the flood destroys, with live counts of what is lost.
- See which villages can no longer reach a hospital or relief camp, shown as "Cut off", and which are "Under water".
- Get a ranked rescue priority list, ordered by population and vulnerability.
- Click any village to get a safe road route to help, or an airdrop or boat recommendation with the nearest reachable point if every road is gone.
- Download the priority list as GeoJSON for field teams to use offline.
How we built it
The website is plain HTML, CSS and JavaScript with no libraries, so it works offline and opens from a single file. The map is drawn in SVG.
The scenario is a simulated district: a river, a grid of villages with populations, a road network, a few bridges, and two aid points (a district hospital and a relief camp). The analysis on top of it is real code:
- The flood level sets a flood zone that widens around the river.
- Any road or bridge that crosses the flood zone is marked lost.
- A graph search from the hospital and camp finds every village still reachable over the surviving roads.
- Villages that are not reachable are marked cut off, and they are ranked by population times vulnerability.
- Dijkstra's shortest-path algorithm finds the best route for reachable villages.
The production pipeline we designed uses Sentinel-1 radar images from before and during the flood, a water mask from change detection or a U-Net trained on Sen1Floods11, OpenStreetMap roads and bridges, NetworkX for the cut-off analysis, and WorldPop for population counts.
Challenges we ran into
- Getting real satellite, road and population data into a hackathon demo that has to run offline, so we built a simulated district and kept the analysis code real.
- Making the demo believable. Our first version had too many bridges, so almost nothing was ever cut off. We cut the bridges down to match a real river valley, and the isolation story then showed up properly.
- Deciding what "cut off" means. A village can be dry but have no surviving road out, so we separated "Cut off" from "Under water" because they need different rescue methods.
- Keeping the page fast and clear while recalculating the whole road network on every slider move.
Accomplishments that we're proud of
- The idea goes beyond a flood map. It answers the question rescuers actually ask: who is cut off, and who do we reach first?
- A working live demo with real graph logic, not just a mock-up.
- A single offline package that anyone can open with no setup. ## What we learned
- Radar satellites are the right tool for floods because they see through clouds and at night.
- A flood map alone is not enough. Overlaying it on the road network is what turns pixels into decisions.
- Rescuers need rankings and routes, not just layers.
Being honest about simulated data makes a prototype more credible, not less.
What's next for Untitled
Replay a real past flood, such as Kerala 2018, end to end with real Sentinel-1 images.
Train and plug in the U-Net water-detection model.
Add DEM-based forecasts of where the water will spread next.
Send alerts and offline maps to district disaster teams, NGOs and relief logistics firms.
Extend the same engine to cyclones and landslides.
Built With
- css3
- dijkstras-algorithm
- graph-algorithms
- html5
- javascript
- svg

Log in or sign up for Devpost to join the conversation.