-
-

Our company!
-

MAPCORONA!
-

Our elegant, sleek, and user-friendly app
-

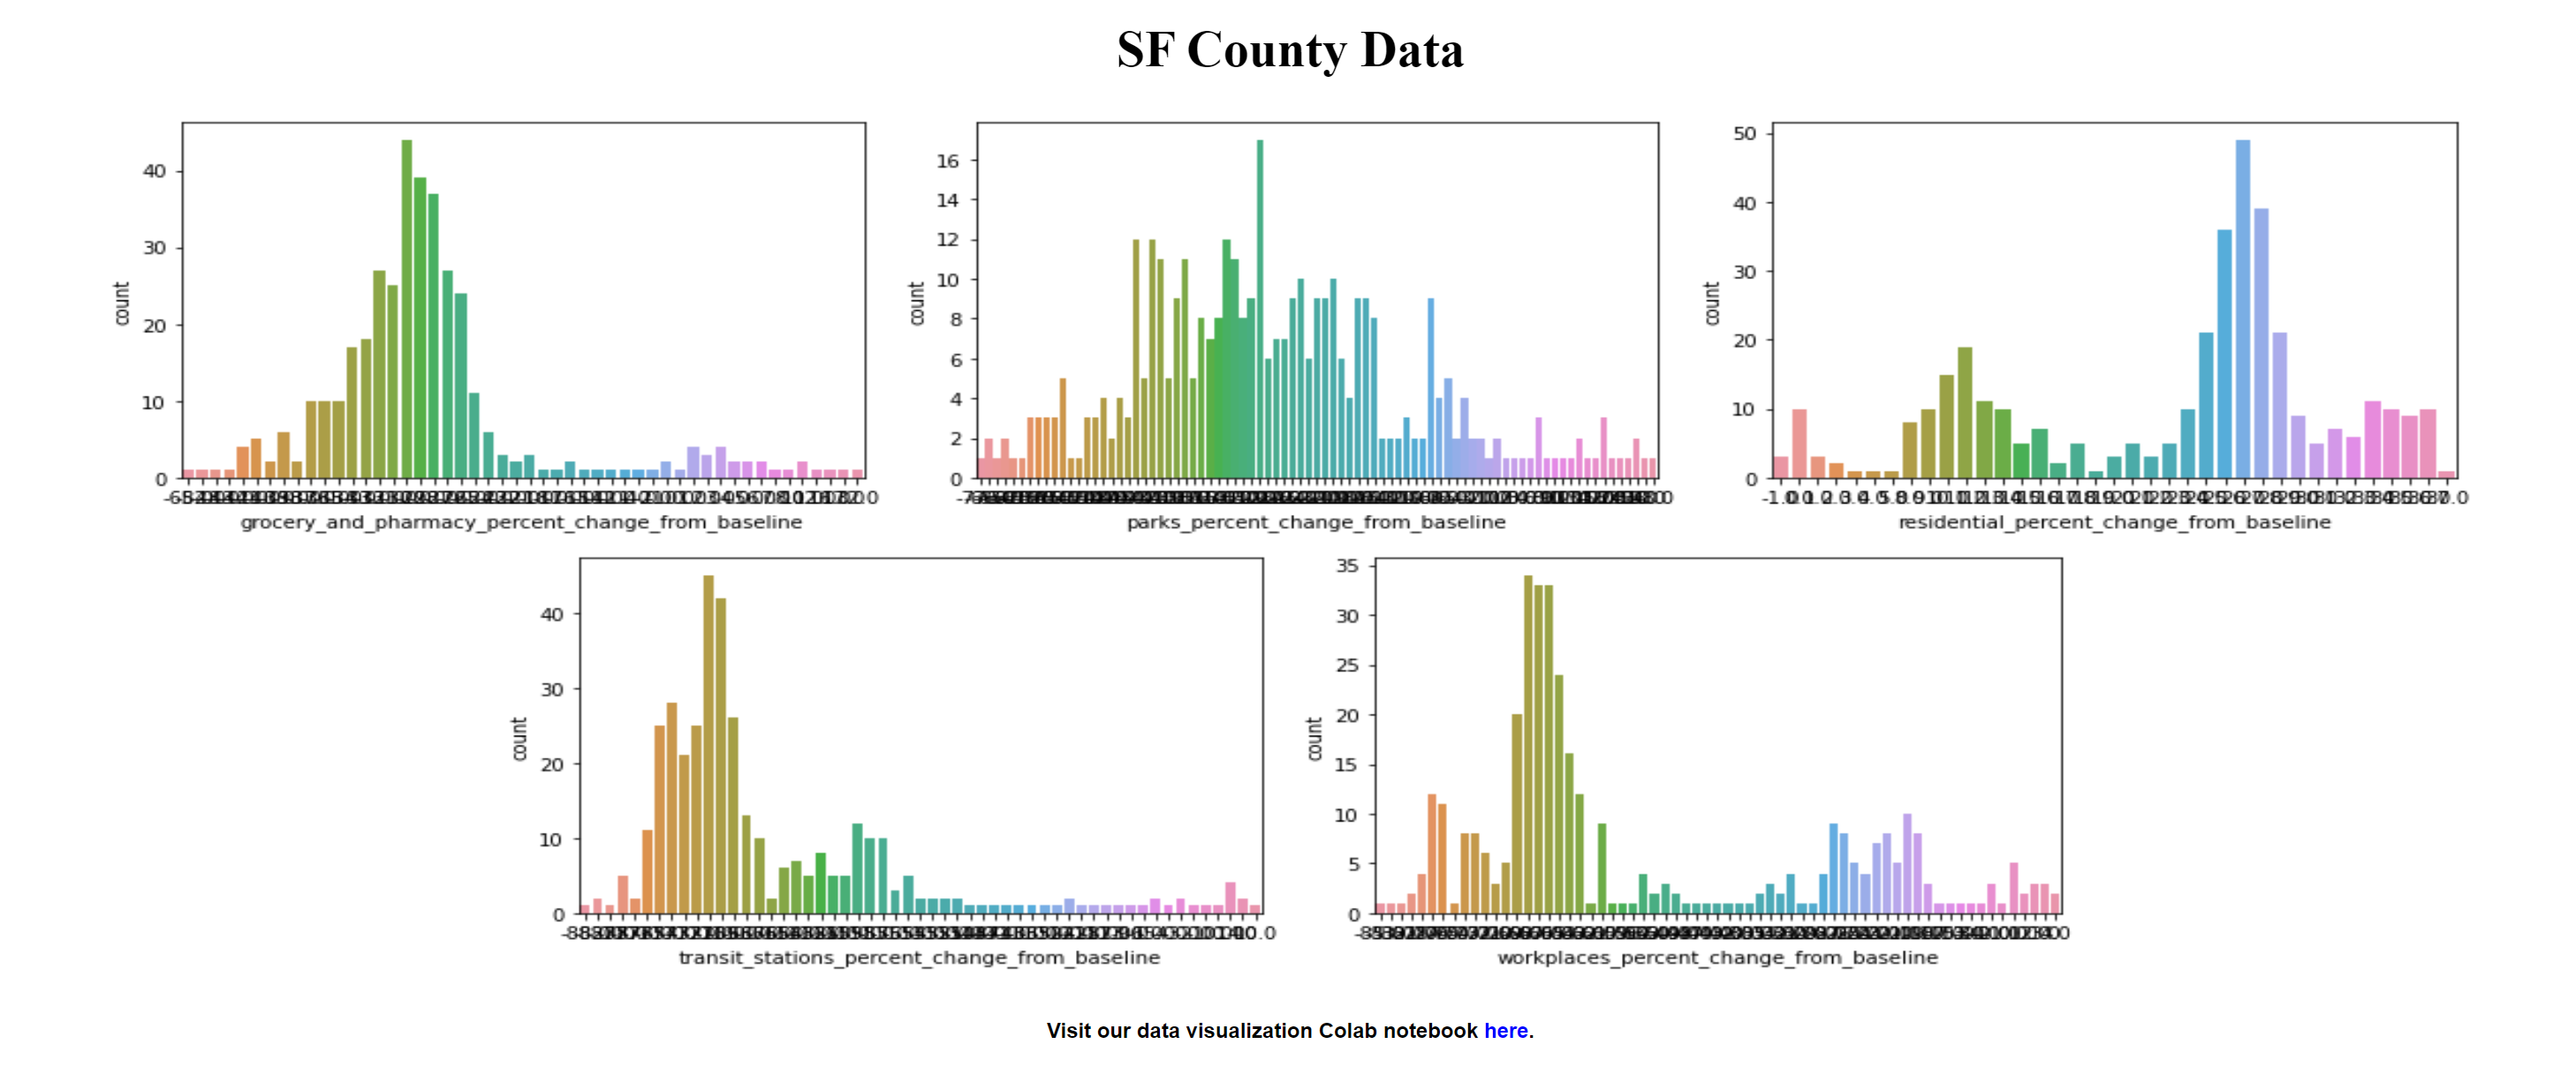
Our data visualization for SF County
-

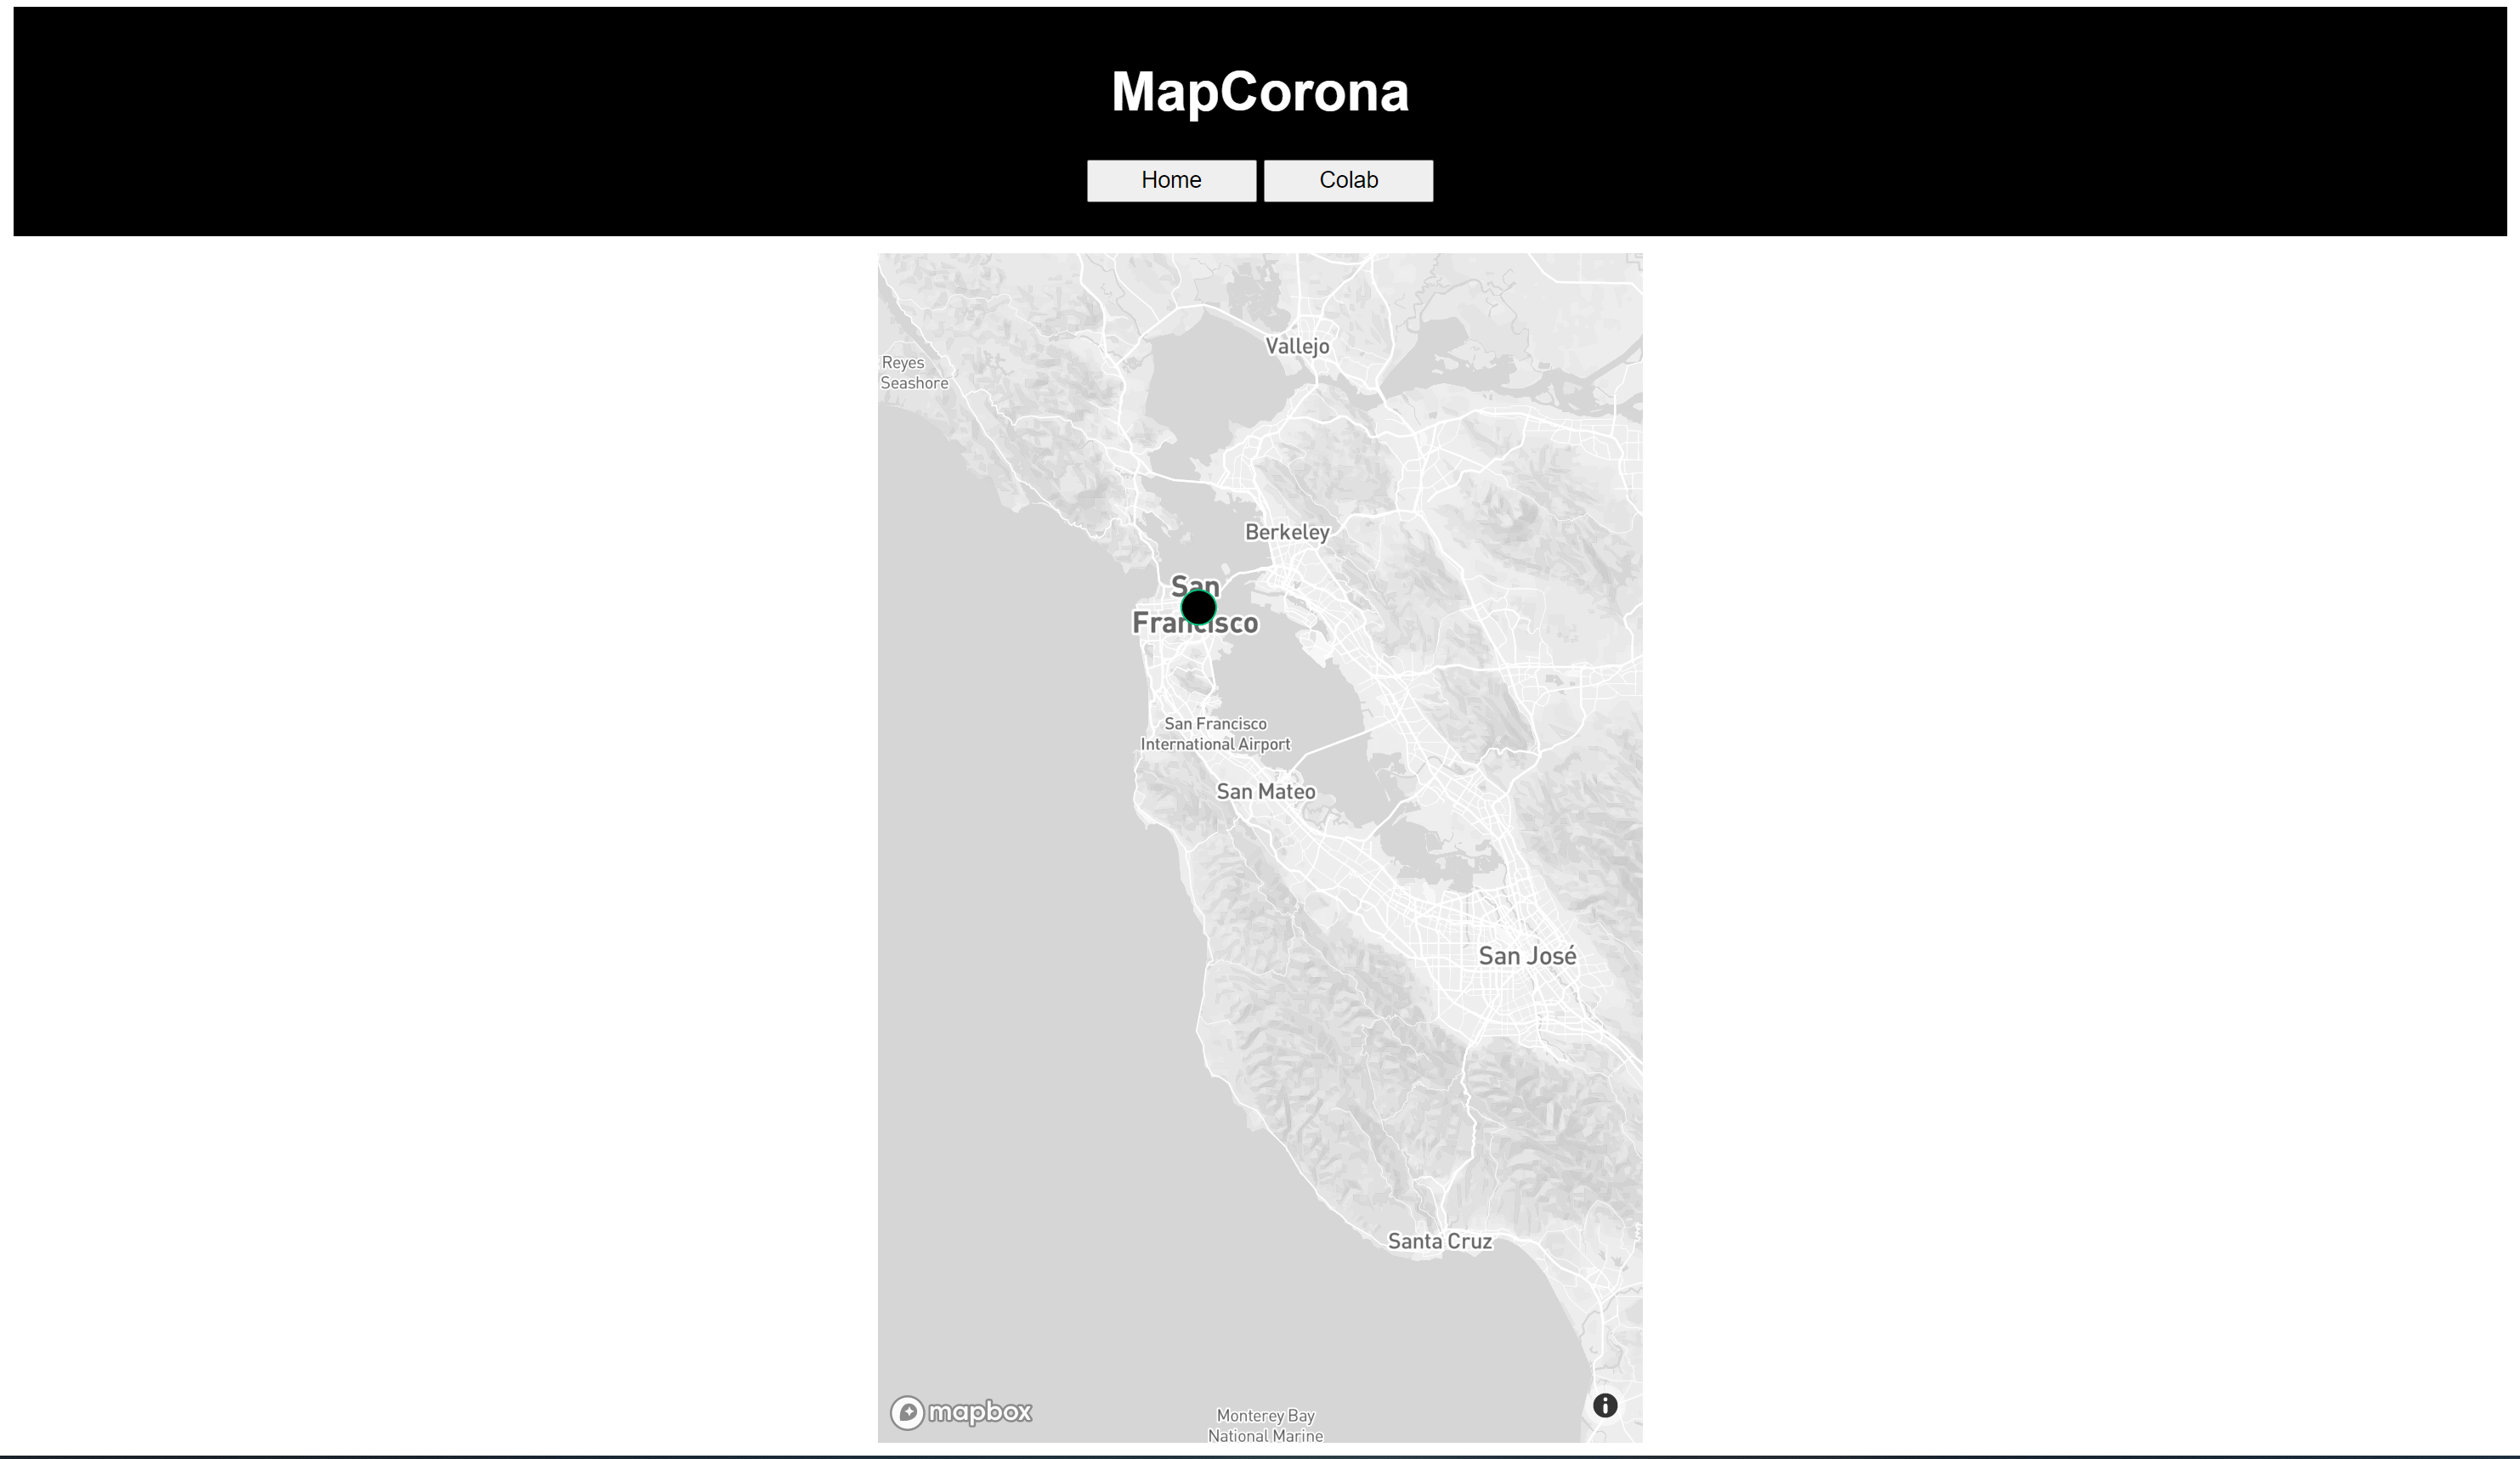
Our website


Inspiration
These days we are prisoners of our homes, so we thought well what was the safest way we can go out and travel. The very first, best, and safest answer was a ROAD TRIP!! But, road trips are a danger of their own these days: we can’t stop in-between cities to take rest and stretch our body during the trip. So then we again wondered how we can make road trips safe, so that we can travel safely with our families. Our answer: introducing MapCorona. The smart and safe way of tracking the condition of COVID-19 in the cities and counties you travel to, so that you and your family know how severe COVID-19 is throughout your trip, so that you and your loved ones can stay safe!
What it does
MapCorona is used to track Covid cases and help people stay safe by tracking and logging the condition of where you are going. The app engages users in many by letting then learn more information about Covid cases and what tier their county is in. Users can explore the map on our site and learn more information about how their county is getting affected from Covid before going on road trips.
How we built it
We used html, css, javascript, and python for our website to make our map more interactive and engaging. For the app, we used proto.io. We also used Clipchamp to edit our video.
Challenges we ran into
At the beginning, most of us weren't quite familiar with HTML and CSS. The website was a struggle for us due to our lack of experience in web development, and it was a challenge for us to finish this project in the time constraint. Embedding the map onto our website was a challenge for us because we weren’t sure how to make it interactive with the user.
Accomplishments that we're proud of
We figured how to prototype the app very well, when it was our first time using proto.io. We also proud of being able to make parts of the map to be interactive with the user. And most of all, we were able to finish an efficient product within 24 hours!
What we learned
We learned how to be more efficient and improvise our ideas for the time constraint. During this hackathon, we learned a lot more about html, css, web development, and data visualization. We learned more about how to do professional editing and using proto.io. There are different ways to visualize data by using python. We also learned how to properly implement JavaScript and the MapBox API.
What's next for MAPCORONA
We plan to add more information about other states other than California and make our site more interactive and engaging for users to use. Later on, we plan to add locations to testing centers and hospitals closest to the user. We are excited to see what the future of MapCorona will hold!


Log in or sign up for Devpost to join the conversation.