In this project, I develop a trading strategy using my intuition and Technical Analysis and test it against a stock using my market simulator. In a later project, I will use the same indicators but with Machine Learning (instead of my intuition) to create a trading strategy.
Part 1: Technical Indicators
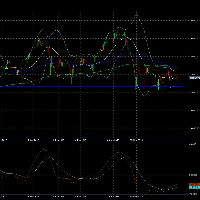
Develop at least 3 and at most 5 technical indicators. I create a single, compelling chart that illustrates the indicator.
Part 2: Theoretically Optimal Strategy
Assuming that I can see the future, but that I am constrained by the portfolio size and order limits as specified, I create a set of trades that represents the best a strategy could possibly do during the in-sample period. The reason for this is so that I will have an idea of an upper bound on performance.
The intent is for me to use adjusted close prices with the market simulator that I wrote earlier. For this activity, I use $0.00, and 0.0 for commissions and impact respectively.
I provide a chart that reports:
Benchmark normalized to 1.0 at the start. Value of the theoretically optimal portfolio (normalized to 1.0 at the start).
I also report:
Cumulative return of the benchmark and portfolio Stdev of daily returns of benchmark and portfolio Mean of daily returns of benchmark and portfolio
Part 3: Manual Rule-Based Trader
I implement a set of rules using the indicators I created above. I devise some simple logic using my indicators to enter and exit positions in the stock.
I tweak my rules as best I can to get the best performance possible during the in-sample period, and I use my rule-based strategy to generate a trades data frame over the in-sample period, then run that data frame through my market simulator.
Part 4: Comparative Analysis
I evaluate the performance of my strategy in the out of sample period. I create a table that summarizes the performance of the stock, and the manual strategy for both in-sample and out of sample periods.


Log in or sign up for Devpost to join the conversation.