-
#datastats
Inspiration
Major League Hacking is the inspiration.
What it does
it analyzes athlete related datasets.
How we built it
I took the help of a website and started learning from it.
import pandas as pd import seaborn as sns
Part 1 functions
def mean(arr): return sum(arr) / len(arr)
def isEven (arr): return arr % 2 == 0
def half (arr): if isEven(len(arr)): return int(len(arr)/2) - 1 else: return int(len(arr)/2)
def median (arr): sortedList = sorted(arr) index = half(sortedList) if isEven(len(sortedList)): return mean([ sortedList[index], sortedList[index + 1] ]) else: return sortedList[index]
Part 2 functions
def square(x): return x * x
def sumOfSquaredDifferences (arr): xBar = mean(arr) differences = map(lambda x: x - xBar, arr) squaredDifferences = map(square, differences) return sum(squaredDifferences)
def variance (arr): n = len(arr) return sumOfSquaredDifferences(arr) / (n-1)
def sqrt (x): return x**(1/2)
def stDev (arr): return sqrt(variance(arr))
Part 3 numerator functions
def n (arr): return arr.count()
def product (x, y): return x * y
def sumXTimesY (x, y): return sum(map(product, x, y))
def numerator (x, y): return n(x) * sumXTimesY(x, y) - sum(x) * sum(y)
Part 3 denominator functions
def sumOfSquares (arr): return sum(map(square, arr))
def denominator (x, y): return sqrt((n(x) * sumOfSquares(x) - square(sum(x))) * (n(y) * sumOfSquares(y) - square(sum(y))))
Part 3 final function
def r (x, y): return numerator(x, y) / denominator(x, y)
data
data = [ {"name": "John", "distance": 5602, "high-speed-running": 504}, {"name": "Mike", "distance": 5242, "high-speed-running": 622}, {"name": "Chad", "distance": 4825, "high-speed-running": 453}, {"name": "Phil", "distance": 611, "high-speed-running": 500}, {"name": "Tyler", "distance": 5436, "high-speed-running": 409} ]
df = pd.DataFrame(data)
weekData = [ { "name": "John", "distance": 35.4, "high-speed-running": 3.65, "week": 1 }, { "name": "Mike", "distance": 32.9, "high-speed-running": 3.77, "week": 1 }, { "name": "Chad", "distance": 27.2, "high-speed-running": 3.02, "week": 1 }, { "name": "Phil", "distance": 20.5, "high-speed-running": 2.01, "week": 1 }, { "name": "Tyler", "distance": 15.3, "high-speed-running": 2.09, "week": 1 }, { "name": "John", "distance": 38.4, "high-speed-running": 4.95, "week": 2 }, { "name": "Mike", "distance": 37.9, "high-speed-running": 4.97, "week": 2 }, { "name": "Chad", "distance": 33.2, "high-speed-running": 4.42, "week": 2 }, { "name": "Phil", "distance": 25.5, "high-speed-running": 3.91, "week": 2 }, { "name": "Tyler", "distance": 19.3, "high-speed-running": 3.09, "week": 2 }, ]
weekDf = pd.DataFrame(data=weekData)
plots
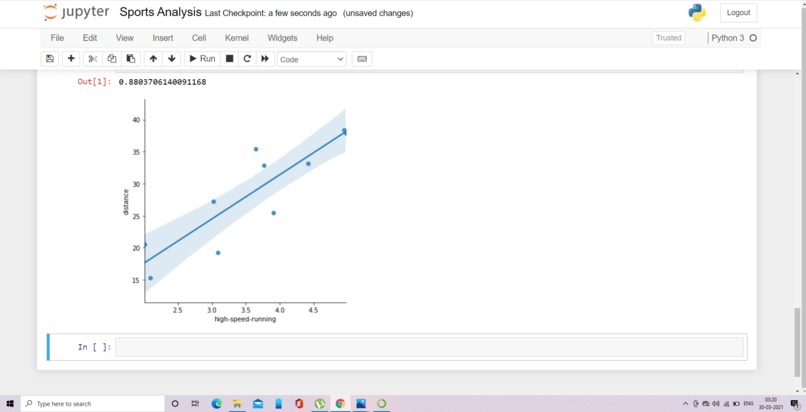
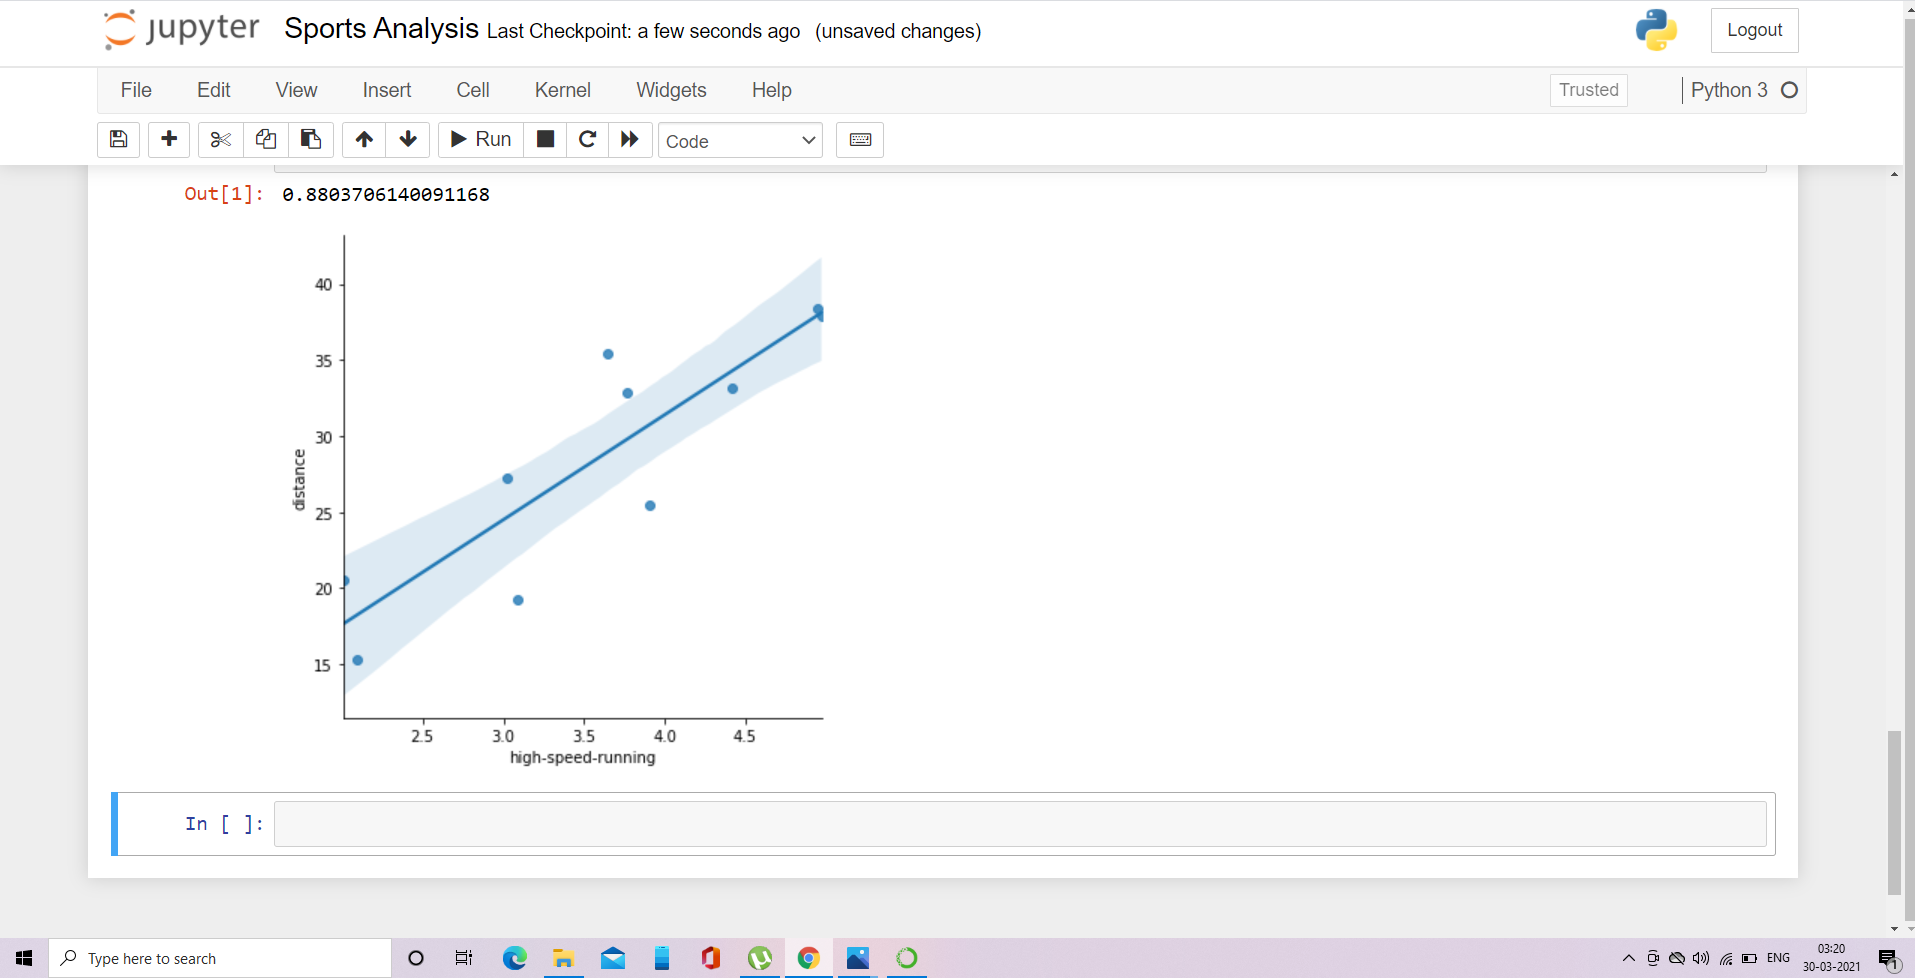
plot = sns.lmplot(x='high-speed-running', y='distance', data=weekDf)
operation
r(weekDf['high-speed-running'], weekDf['distance'])
0.8803706140091168
Challenges we ran into
It's a very new thing. Actually It is a part of data science and I am not much into it. But I love reading and debugging the code.
Accomplishments that we're proud of
Taking a new challenge.
What we learned
Some aspects of data science.
What's next for Make a Sports Analyst Hack
Probably more detailed study.


Log in or sign up for Devpost to join the conversation.