-
-
Hex Thread Agent
-
Overview
-
Donor Segment
-
Donation Forecasting


Inspiration
The goal was to leverage the Hex.tech analytics stack to analyze charity donation data. Makana (pronounced mah-kah-nah) is a Hawaiian word meaning gift, present, reward, award, or donation.
What it does
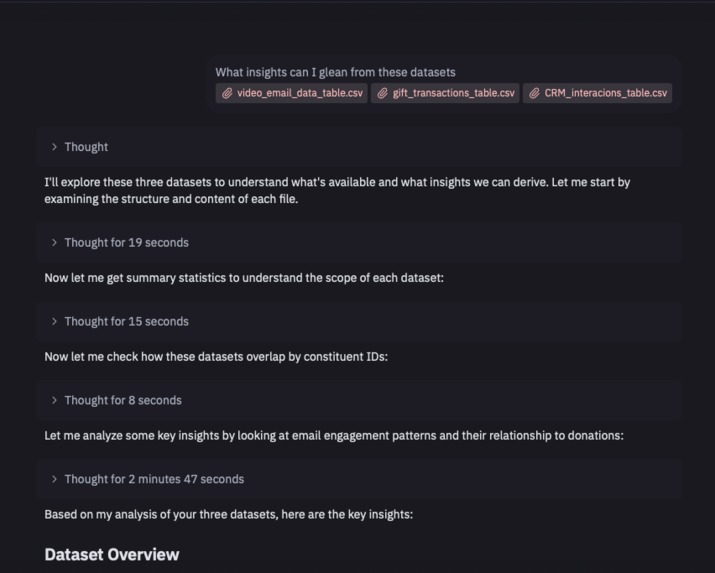
The app analyzes donation data with the focus on understanding current state, creating customer segment and predicting future donations. It uses the Hex thread agent as a starting point for the analysis. There were three datasets involved in the analysis. After reviewing the output of the Hex thread agent, I then built out more of the analysis in the notebook using SQL and python. I then added visualizations using plotly. I then built out the app after. The app consists of three section (Overview, Donor Segments and Donation Forecasting).
How we built it
The app was built using the Hex platform. I used a mix of SQL, python, different python libraries for analytics and visualization.
Key Insights
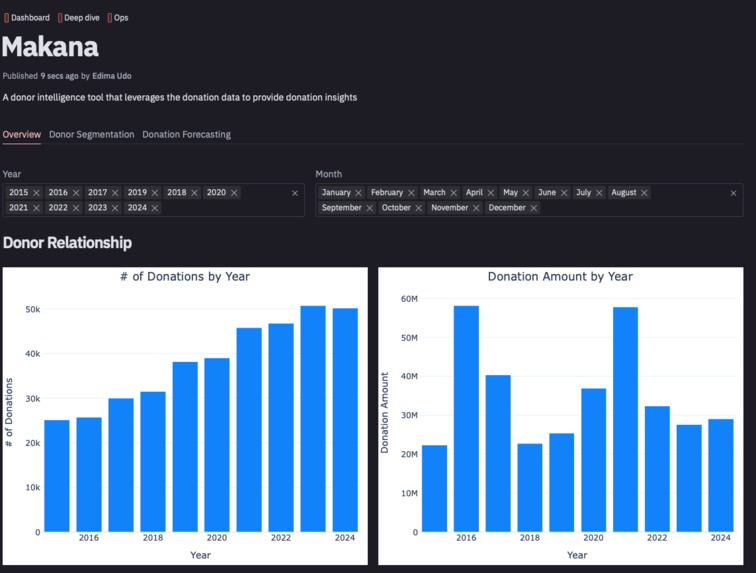
- # of donations have grow over time but donation amounts have been trending downwards
- Jan, June and Dec are key donation month, Tues and Thurs are key donation days
- Donation growth and donor growth are not consistent
- Visit are the main donation driver but correspondence is used the most, opportunity to drive better donation conversions
- Video view and clicks have been trending upwards
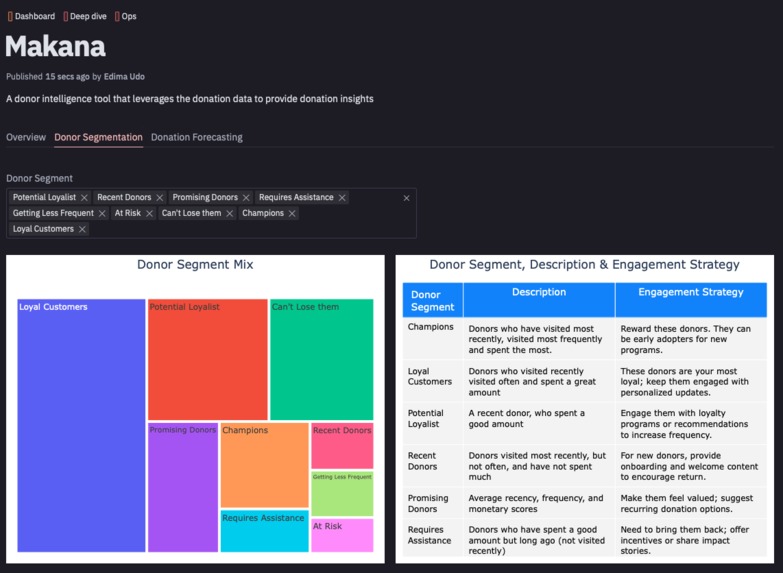
- Opportunity to drive better targeted campaigns using newly created customer segments
- Recency, frequency and Monetary Analysis was used to create the customer segment. Engagement strategy was also outlined
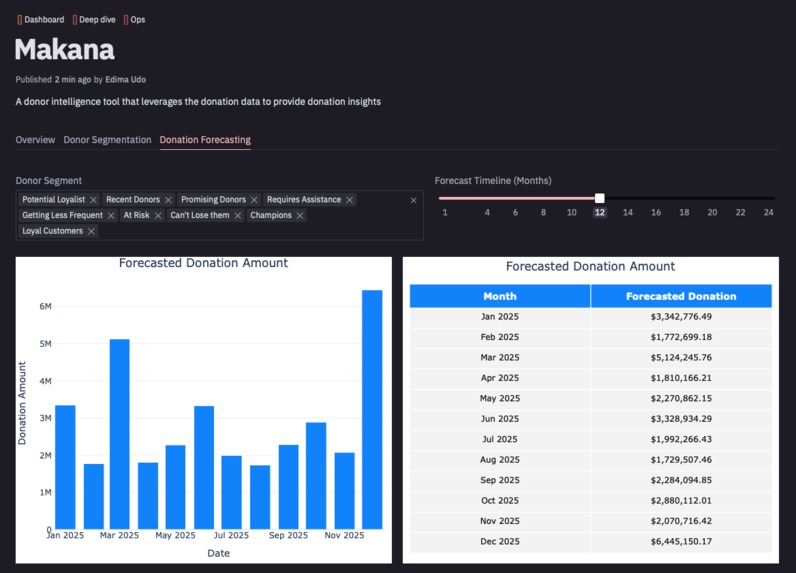
- Forecast model is effective but there is room for improvement ## Challenges we ran into
- One challenge was exploring the different aspects of the Hex platform. It is quite expansive and has lots of ways to do analytics. You can dive right into doing your analysis with your own dataset or import from snowflake or another external datasource. So had to know which approach would be best for my project. I went with importing my own dataset for this challenge.
- Another major challenge was knowing what questions to ask when leveraging the thread or notebook agent. Since you could go with a simple prompt or something deeper. I started with a very generic prompt to see what it would provide. I then reviewed the data and then did a deep dive on my own. I also added my own donation metrics. For customer segmentation I used RFM analysis. For predicting future donations I leveraged the newly created customer segments and built a forecasting model. ## Accomplishments that we're proud of
- Ability to go from analysis to user friendly app in a short period of time using the Hex platform ## What we learned
- Loved the approach to analytics leveraging LLMs but still giving the end user the ability to write python, SQL and hopefully R
- Great experience learning how to use the hex platform in terms of the widgets, presentation, sharing and visualizations tools ## What's next for Makana
- Add a prediction model for amount to be donated based on charity features
- Improve the UX of the app
- Provide a visualization for donation amount flow
- Generate a constituent journey design
- Improve forecasting model and customize based on customer segments

Log in or sign up for Devpost to join the conversation.