-
-
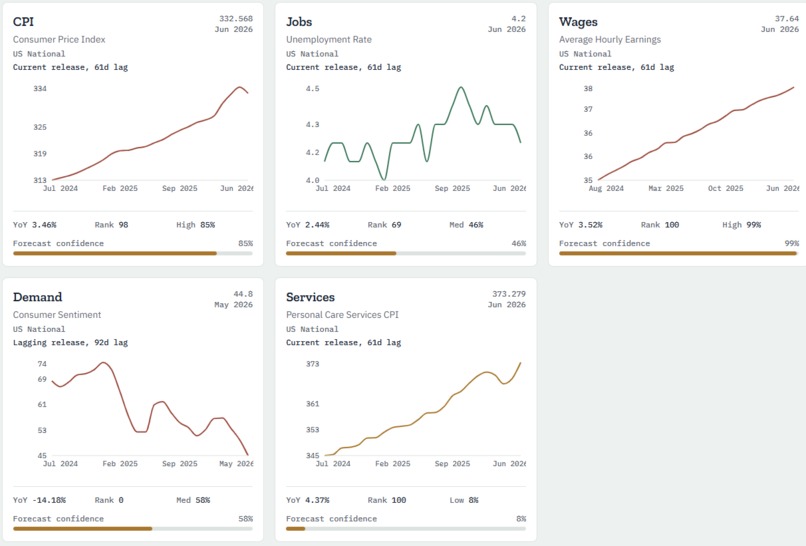
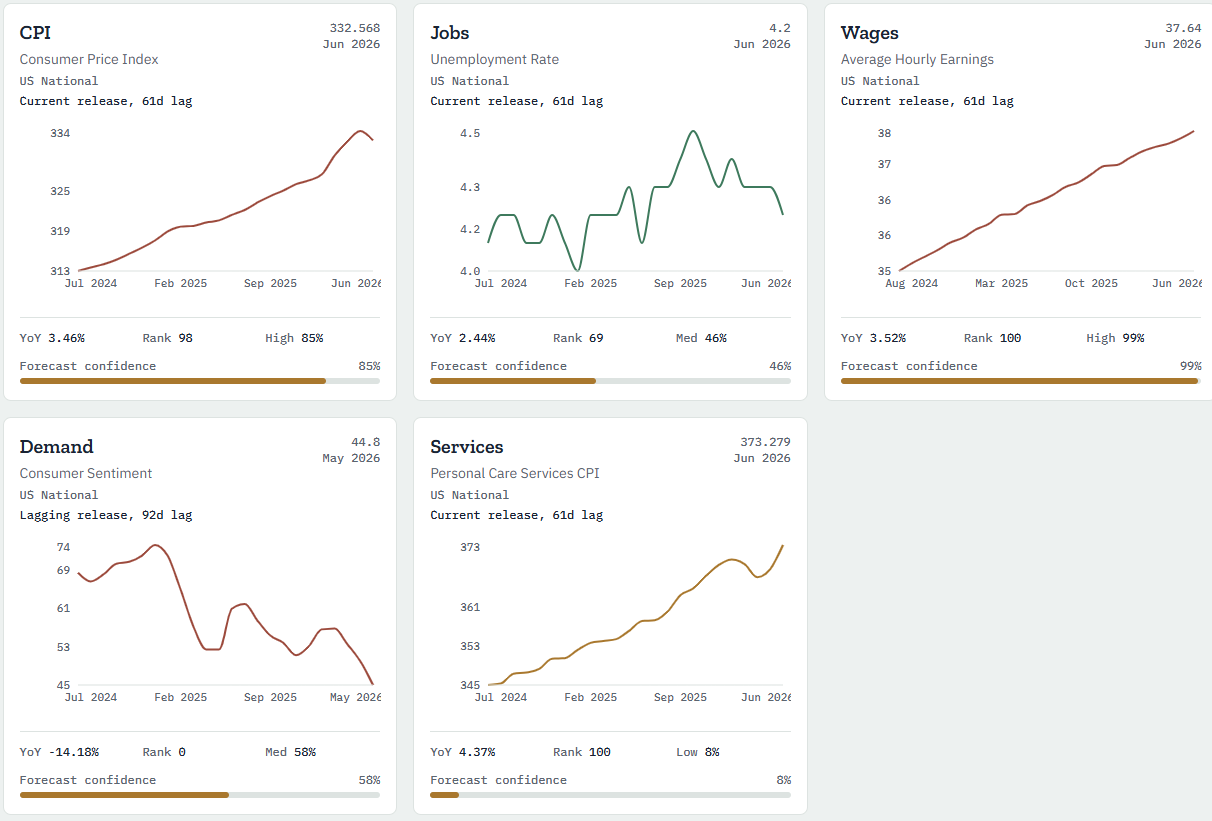
Economic Charts Used
-
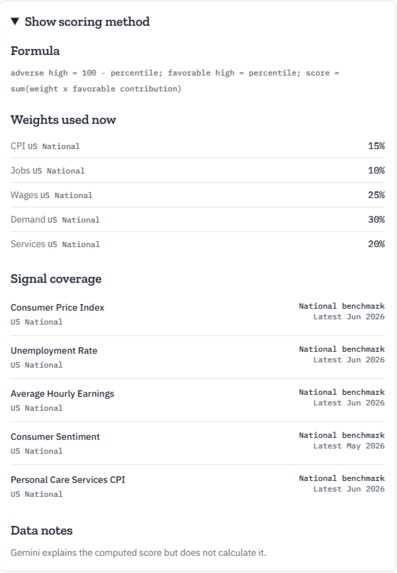
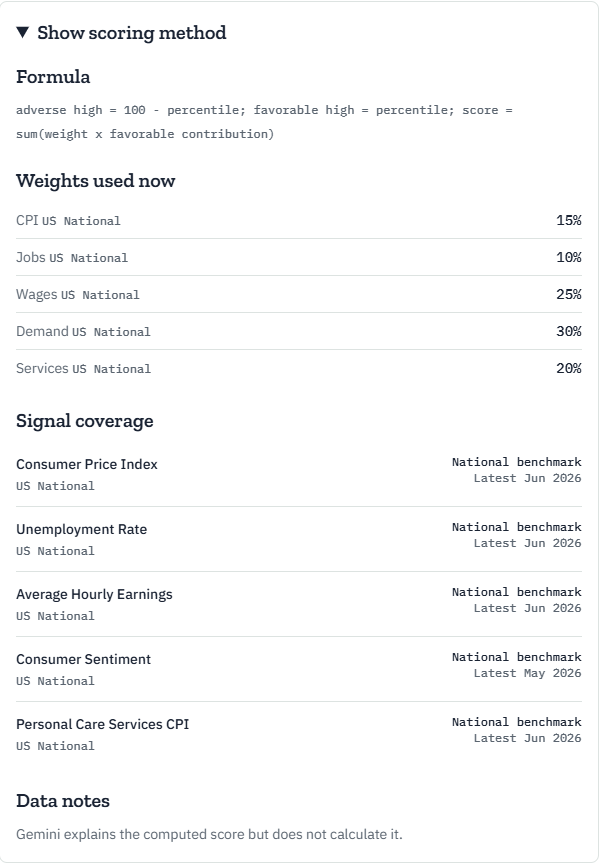
Scoring Calculation Method
-
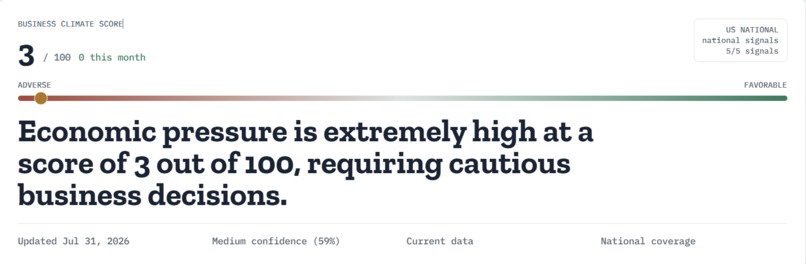
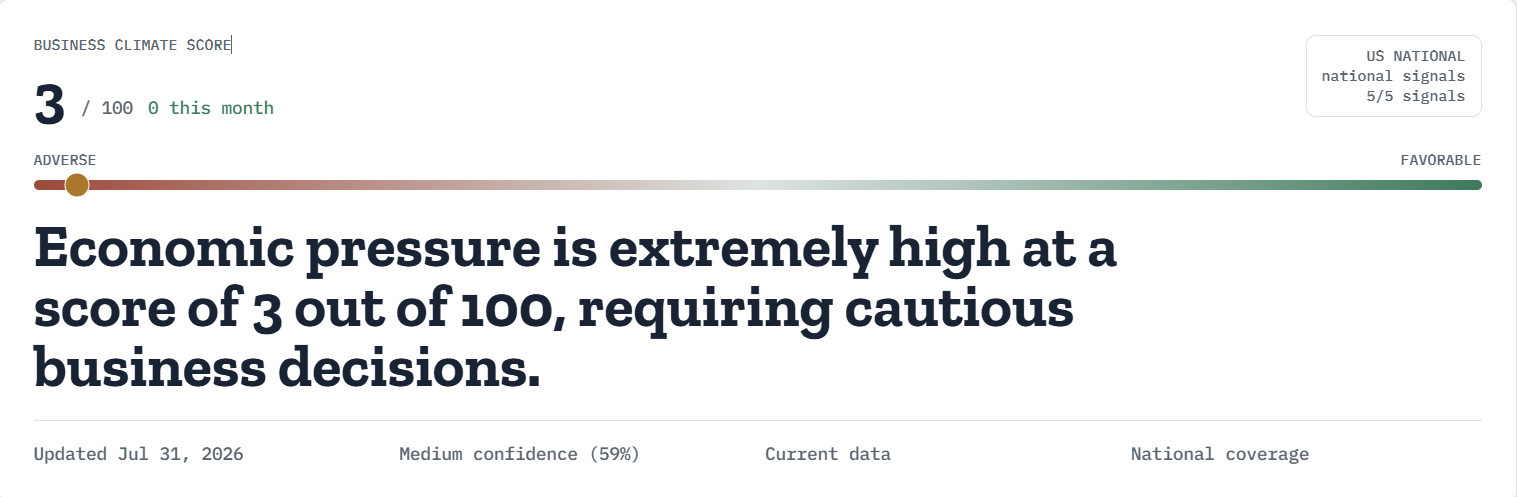
Hero Section
-
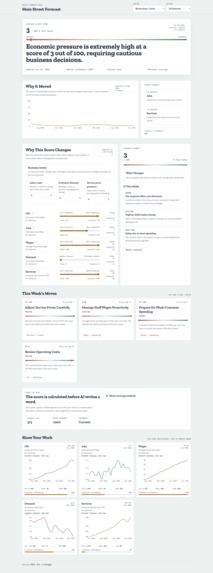
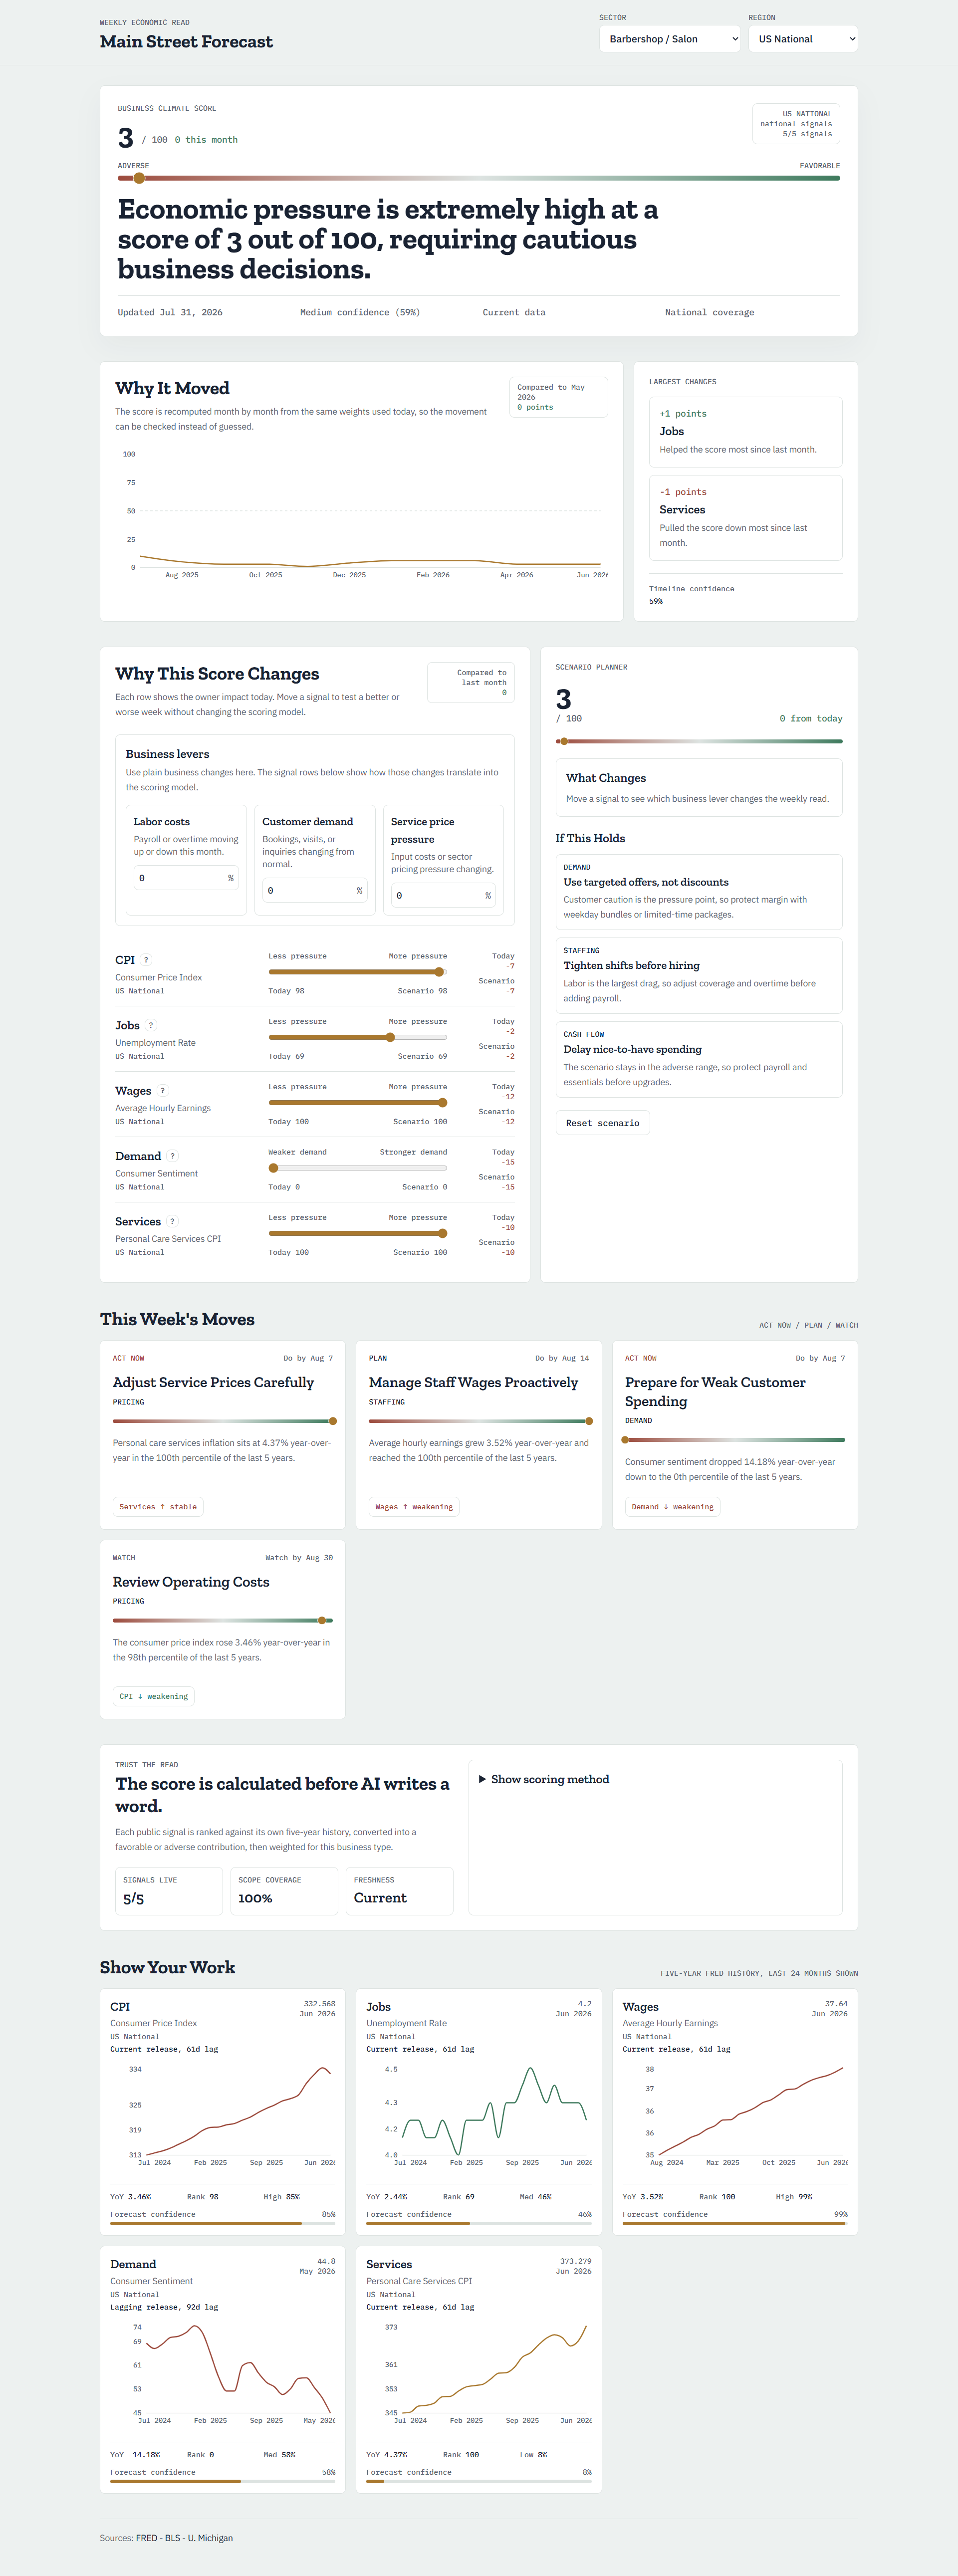
Website screenshot
Inspiration
Small business owners feel inflation, wage pressure, and shifts in consumer demand long before they have time to read a Fed release or an economics report. A cafe owner, salon operator, or guesthouse manager does not need a wall of charts. They need a fast, trustworthy answer to a simple question: what should I do this week?
Main Street Forecast was inspired by that gap. We wanted to turn public economic data into something practical for real operators: one score, one explanation, and a short set of actions grounded in current conditions.
What it does
Main Street Forecast is a weekly economic read for small businesses.
A user selects a sector and a region, and the app turns public data into:
- a Business Climate Score
- a plain-English headline
- 3 to 5 recommended actions
- a score explainer that shows which signals helped or hurt
- a Scenario Planner that lets users test changes like labor costs, customer demand, and sector price pressure
- supporting charts and coverage notes so the result stays transparent
The goal was not to build another generic dashboard. The goal was to build a decision-support tool that explains what is happening, why it is happening, and what a business owner may want to do next.
How we built it
We built Main Street Forecast with Next.js, TypeScript, Tailwind CSS, Recharts, and Framer Motion.
The app uses public economic data from FRED. For each profile, it fetches five years of monthly history, normalizes the indicators, computes percentile ranks, and applies sector-specific weights to produce a deterministic Business Climate Score from 0 to 100.
The score is computed in application code before any AI call. We also compute momentum using a simple linear regression over recent values and expose a confidence read for the current picture.
After the score is calculated, Gemini is used only for narration. It receives the app-computed score and indicator readings, then returns a plain-English headline and recommendations. We validate that output and fall back to deterministic raw data if the model response is invalid.
We also added:
- partial-data handling if one signal fails
- cached forecast responses
- regional labor market support for selected states
- accessibility checks
- unit, integration, and browser-flow tests
Challenges we ran into
The hardest part was building something that felt credible rather than cosmetic.
Public economic data is messy. Not every series has a clean regional equivalent, and not every indicator updates at the same cadence. We had to decide where to use regional signals, where to keep a national benchmark, and how to explain that honestly in the UI.
Another challenge was keeping the product explainable. It is easy to hide behind AI-generated language, but we wanted the score to be inspectable. That led to features like the score contribution view, the monthly score timeline, the signal coverage panel, and the Scenario Planner.
We also spent time making sure the AI layer stayed in bounds. The model does not invent the score or the signals. It explains numbers that the app already computed.
What we learned
We learned that the strongest use of AI here was not replacing the logic, but translating it.
The most important part of the project ended up being the deterministic scoring pipeline and the interaction design around it. Once the score was explainable and interactive, the product felt much more trustworthy.
We also learned how much polish matters. Accessibility, error handling, partial-data fallbacks, and clear documentation made the project feel complete instead of fragile.
What's next
The next steps would be:
- more regional coverage
- more sector-specific signals
- saved profiles and weekly email briefings
- peer benchmarking across locations
- deeper scenario modeling over time
But even in its current form, Main Street Forecast already shows the core idea: public economic data can become a practical operating tool for small business owners.
Built With
- axxe
- css
- framermotion
- fred
- gemini
- html
- javascript
- next.js
- playwright
- react
- recharts
- tailwindcss
- typescript
- vercel
- vitest
- zod

Log in or sign up for Devpost to join the conversation.