🛠️ Technology Stack Framework: Streamlit Data Processing: Pandas, NumPy Visualization: Plotly, Altair Forecasting: Prophet, scikit-learn, statsmodels File Handling: openpyxl (Excel), CSV 📁 Project Structure mai-shen-yun/ ├── app.py # Main dashboard entry point ├── requirements.txt # Python dependencies ├── .streamlit/ │ └── config.toml # Streamlit configuration ├── data/ │ ├── raw/ # Raw data files │ │ ├── MSY Data - Ingredient.csv │ │ ├── MSY Data - Shipment.csv │ │ └── *Data_Matrix.xlsx # Monthly data │ └── processed/ # Processed data (generated) ├── src/ │ ├── data_loader.py # Data loading and validation │ ├── data_processor.py # Data cleaning and transformation │ ├── analytics.py # Analytics functions │ ├── predictions.py # Forecasting models │ └── visualizations.py # Chart components └── pages/ # Multi-page app ├── 1📊Overview.py # Executive dashboard ├── 2📦Inventory.py # Inventory tracking ├── 3📈Analytics.py # Trend analysis ├── 4🔮Predictions.py # Forecasting └── 5💰_Cost_Analysis.py # Cost optimization 🚀 Getting Started Prerequisites Python 3.8 or higher pip package manager Installation Clone the repository
git clone https://github.com/yourusername/mai-shen-yun.git cd mai-shen-yun Install dependencies
pip install -r requirements.txt Prepare your data
Place your data files in the data/raw/ directory Required files: MSY Data - Ingredient.csv (menu items and ingredient quantities) MSY Data - Shipment.csv (shipment frequencies and quantities) Monthly data matrices (Excel files) Run the dashboard
streamlit run app.py Access the dashboard
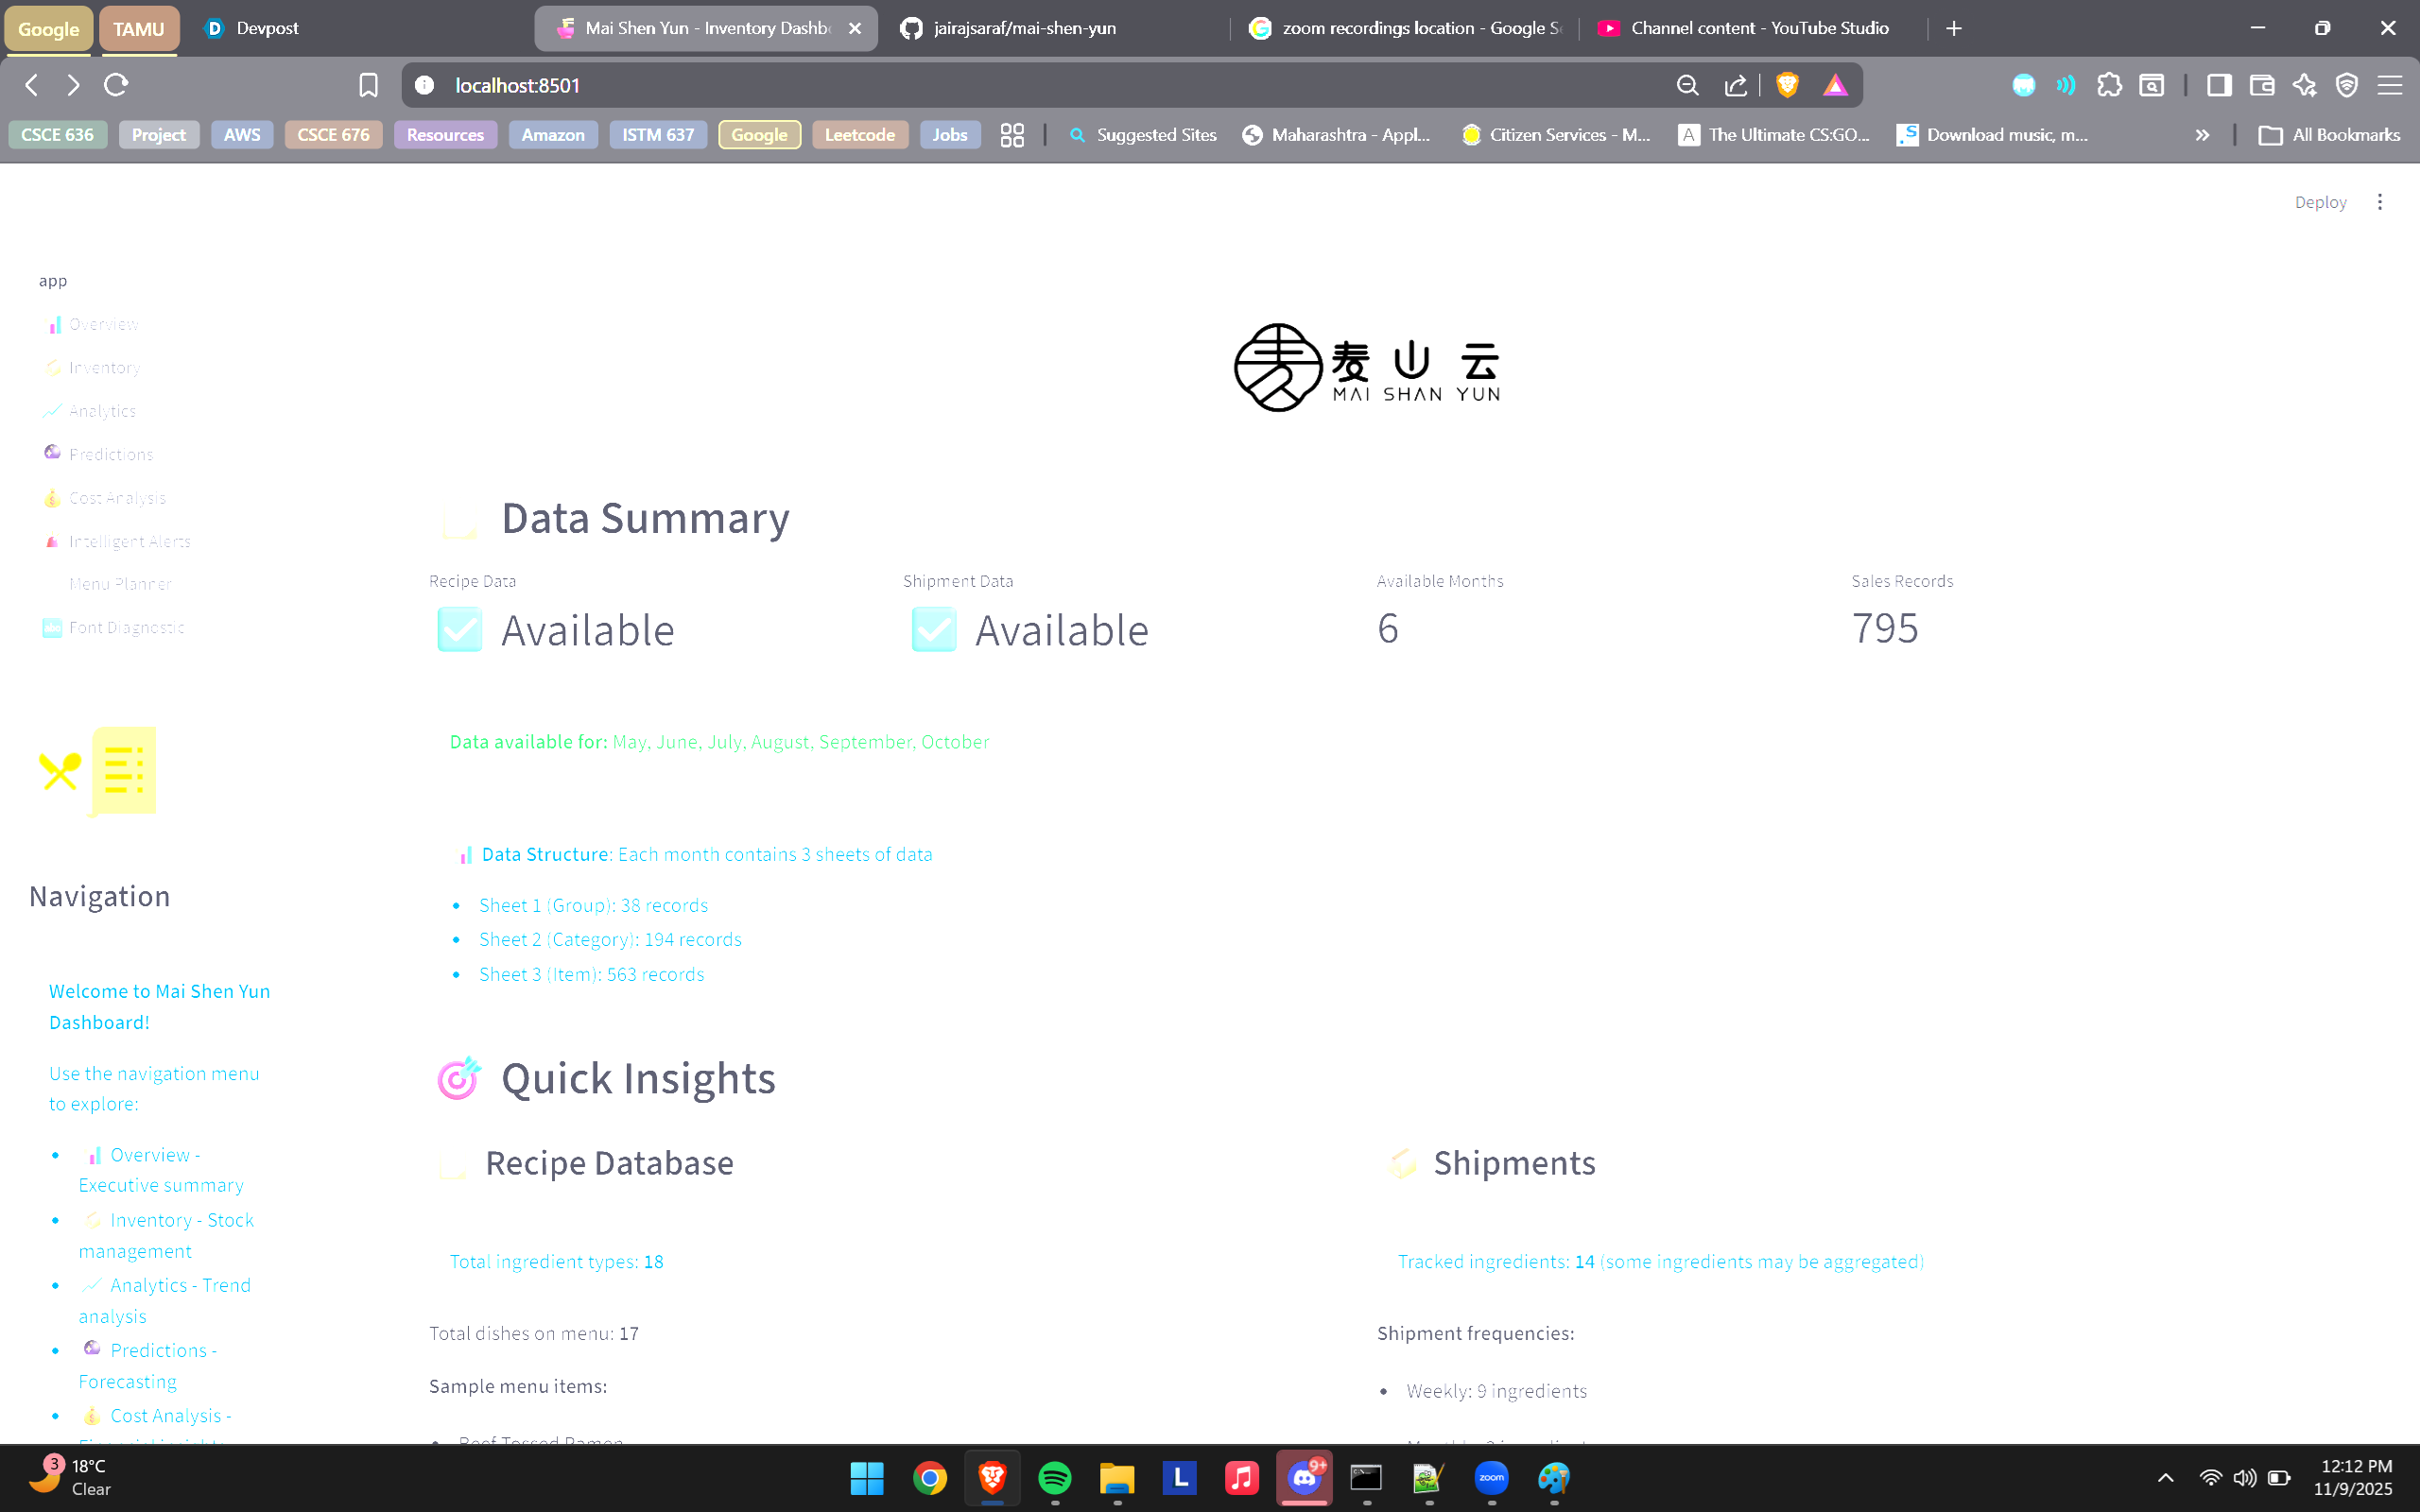
Open your browser and navigate to http://localhost:8501 📊 Data Format Ingredient Data (MSY Data - Ingredient.csv) Item name,braised beef used (g),Braised Chicken(g),Braised Pork(g),Egg(count),Rice(g),... Beef Tossed Ramen,140,,,0.5,,1 Beef Fried Rice,100,,,1,350 ... Shipment Data (MSY Data - Shipment.csv) Ingredient,Quantity per shipment,Unit of shipment,Number of shipments,frequency Beef,40,lbs,3,weekly Chicken,40,lbs,2,weekly ... Monthly Data (Excel files) Excel files containing monthly sales or usage data. Format should match the ingredient data structure.
🎯 Key Algorithms Inventory Optimization Reorder Point Calculation
Reorder Point = (Lead Time × Average Daily Usage) + Safety Stock Economic Order Quantity (EOQ)
EOQ = √((2 × Annual Demand × Ordering Cost) / Holding Cost) Safety Stock
Safety Stock = (Max Daily Usage × Max Lead Time) - (Avg Daily Usage × Avg Lead Time) Forecasting Methods Moving Average: Simple average of recent periods Exponential Smoothing: Weighted average favoring recent data Weighted Moving Average: Customizable weights for different periods Linear Regression: Trend-based prediction Ensemble: Combines multiple methods for robust forecasts ABC Classification A items: Top 20% (80% of value) - Tight control B items: Next 30% (15% of value) - Moderate control C items: Remaining 50% (5% of value) - Simple controls 📖 Usage Guide Navigation Use the sidebar to navigate between different pages:
📊 Overview: Start here for a high-level summary 📦 Inventory: Monitor and manage stock levels 📈 Analytics: Explore trends and patterns 🔮 Predictions: View forecasts and reorder schedules 💰 Cost Analysis: Optimize spending and reduce costs Filtering and Search Use sidebar filters to focus on specific data segments Search bars allow quick ingredient lookup Date ranges can be adjusted for time-based analysis Exporting Data Download buttons are available on most pages Exports are in CSV format for easy analysis in Excel Reports include all filtered data Interpreting Alerts 🔴 Red/Critical: Immediate action required (low stock) 🟡 Yellow/Warning: Monitor closely (overstock, approaching reorder) 🟢 Green/Normal: Stock levels are healthy 🔧 Customization Adjusting Thresholds Edit src/data_processor.py to modify:
Reorder point calculations Safety stock multipliers Overstock thresholds Adding New Visualizations Add new chart functions to src/visualizations.py:
def plot_custom_chart(self, df: pd.DataFrame) -> go.Figure: # Your custom Plotly chart fig = go.Figure(...) return fig Custom Forecasting Models Extend src/predictions.py with new forecasting methods:
def custom_forecast(self, data: pd.Series, periods: int) -> pd.Series: # Your forecasting logic forecast = ... return forecast 📈 Performance Optimization Caching: Streamlit's @st.cache_data decorator is used extensively Data Loading: Files are loaded once and cached Lazy Loading: Pages load data only when accessed Efficient Processing: Pandas vectorized operations for speed 🐛 Troubleshooting Common Issues Module not found errors
pip install -r requirements.txt --upgrade Data files not loading
Check file paths in data/raw/ Verify file formats (CSV encoding, Excel version) Visualization not displaying
Clear cache: Click menu → Clear cache Refresh browser Performance issues
Reduce forecast periods Limit data to recent months Close unused browser tabs 🤝 Contributing Contributions are welcome! Please:
Fork the repository Create a feature branch (git checkout -b feature/AmazingFeature) Commit your changes (git commit -m 'Add some AmazingFeature') Push to the branch (git push origin feature/AmazingFeature) Open a Pull Request 📝 Future Enhancements Database integration (PostgreSQL/MySQL) User authentication and role-based access Email alerts for critical stock levels Mobile-responsive design Integration with POS systems Supplier management module Recipe cost calculator Multi-location support Advanced ML models (LSTM, ARIMA) Real-time data streaming 📄 License This project is licensed under the MIT License - see the LICENSE file for details.
👏 Acknowledgments Built with Streamlit Visualizations powered by Plotly Forecasting using Prophet and scikit-learn 📞 Support For questions or issues:
Open an issue on GitHub Email: support@maishenyu n.com Documentation: Wiki 🌟 Star History If you find this project useful, please consider giving it a star ⭐
Built with ❤️ for efficient restaurant inventory management
Last Updated: 2025-11-08 Version: 1.0.0
Built With
- plotly
- prophet
- python
- scikit-learn
- streamlit

Log in or sign up for Devpost to join the conversation.