-
-
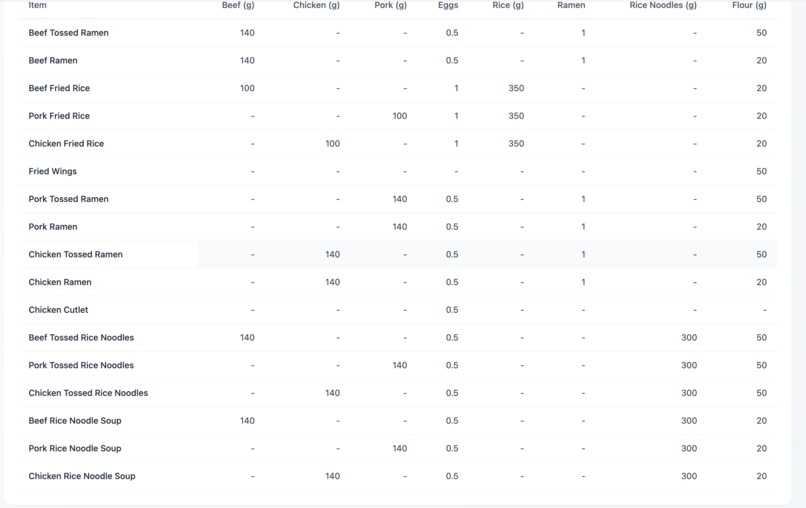
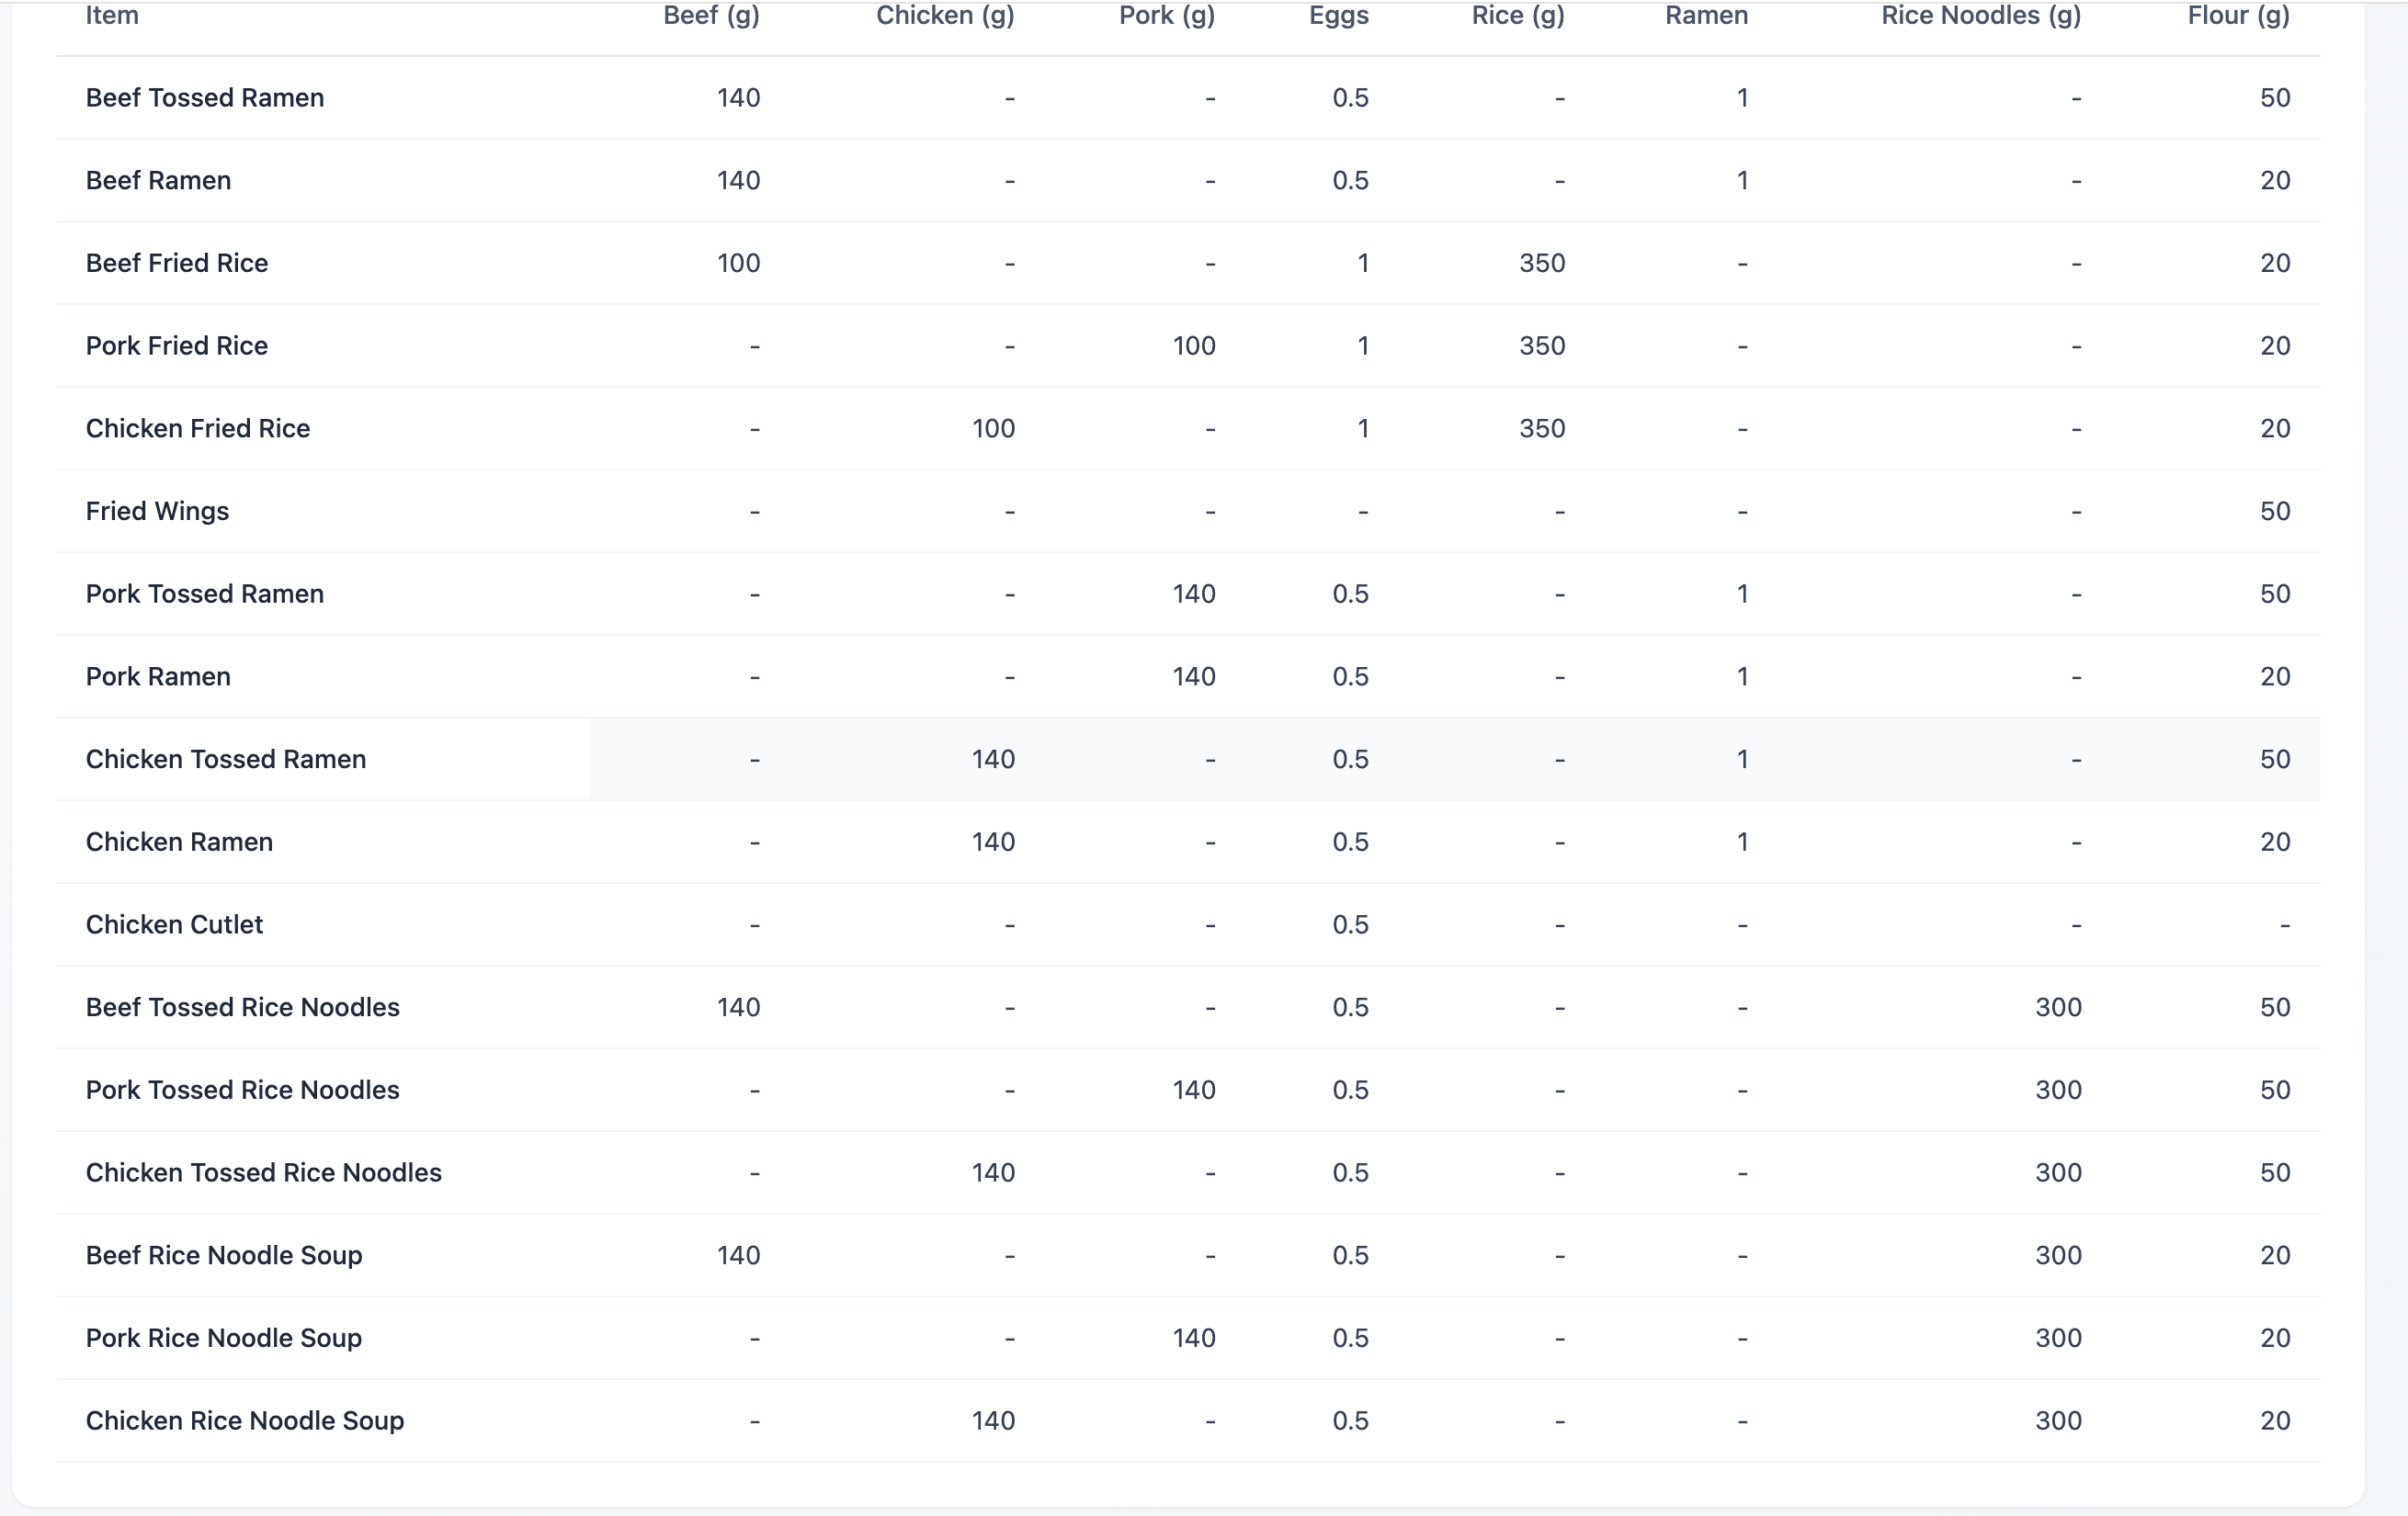
Table with all the ingredients for each dish.
-
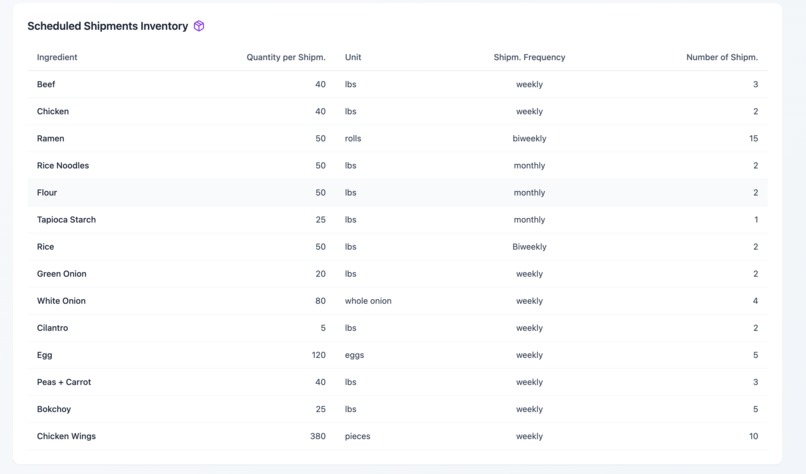
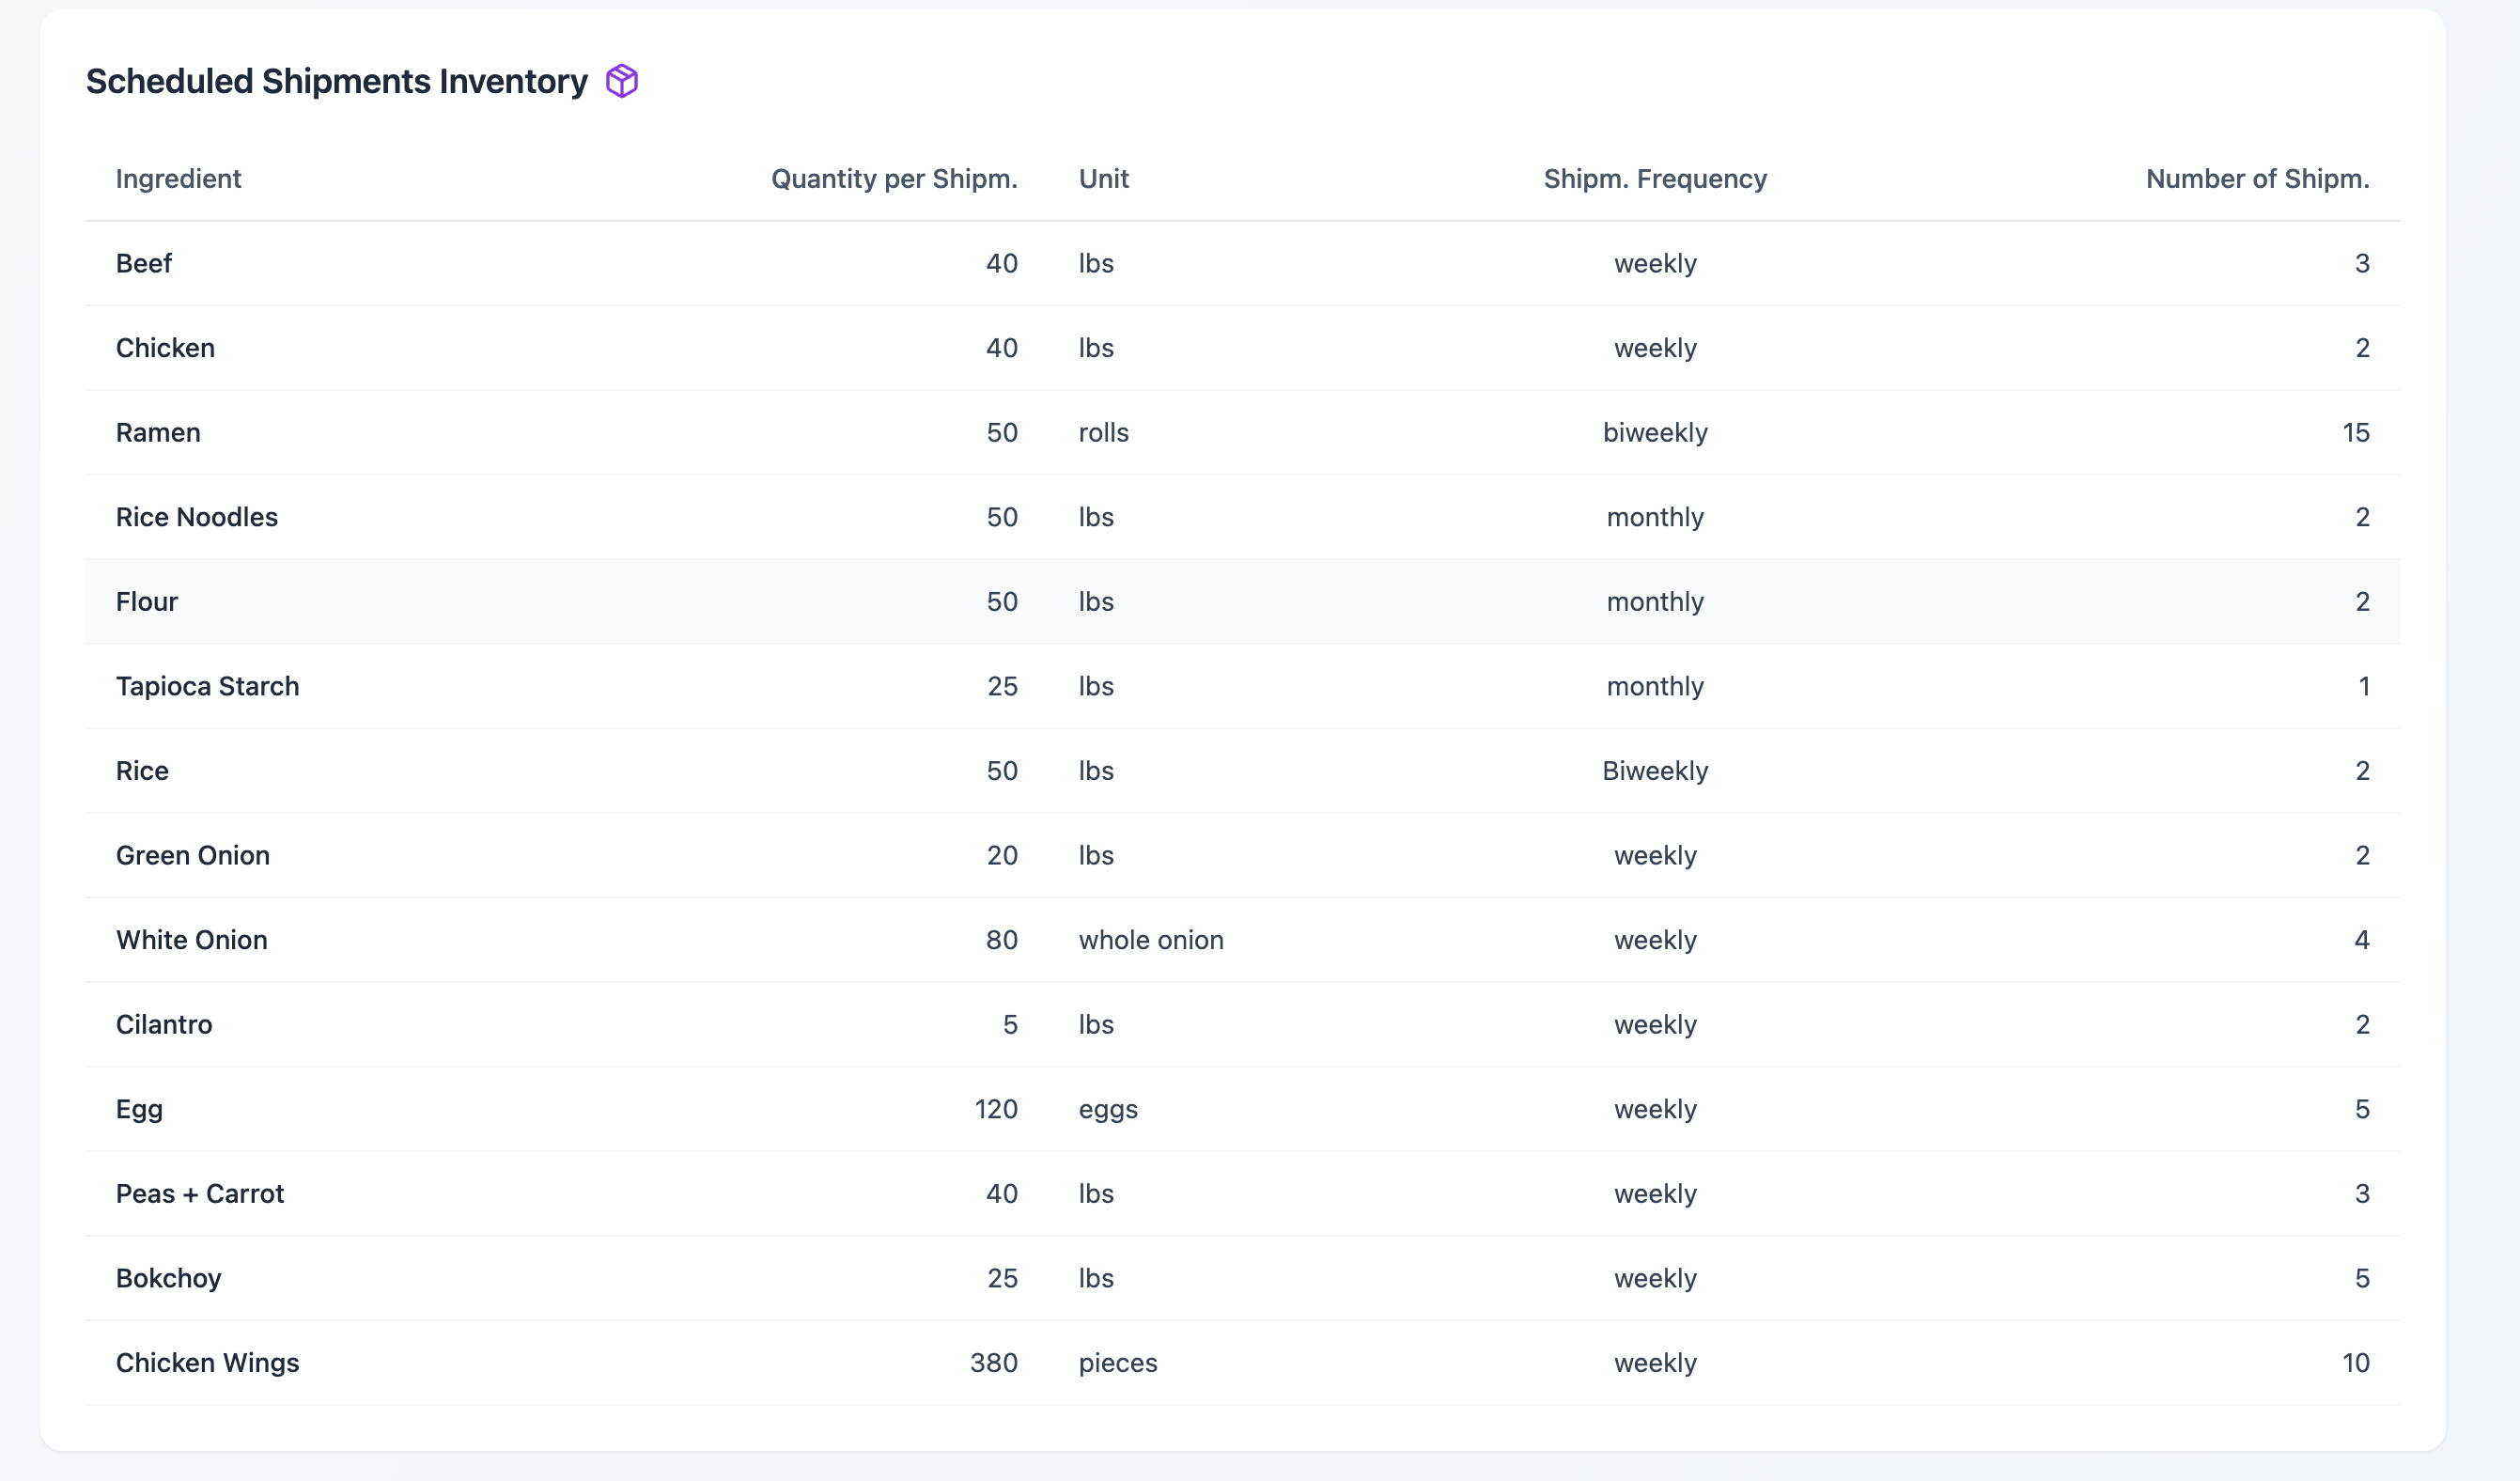
The shipment schedule
-
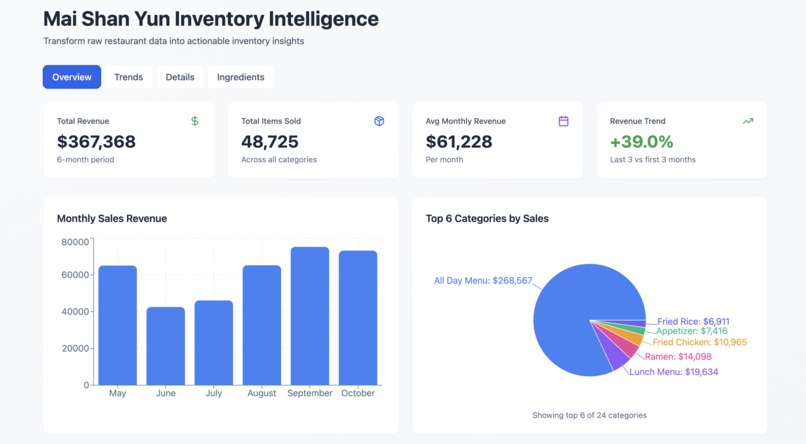
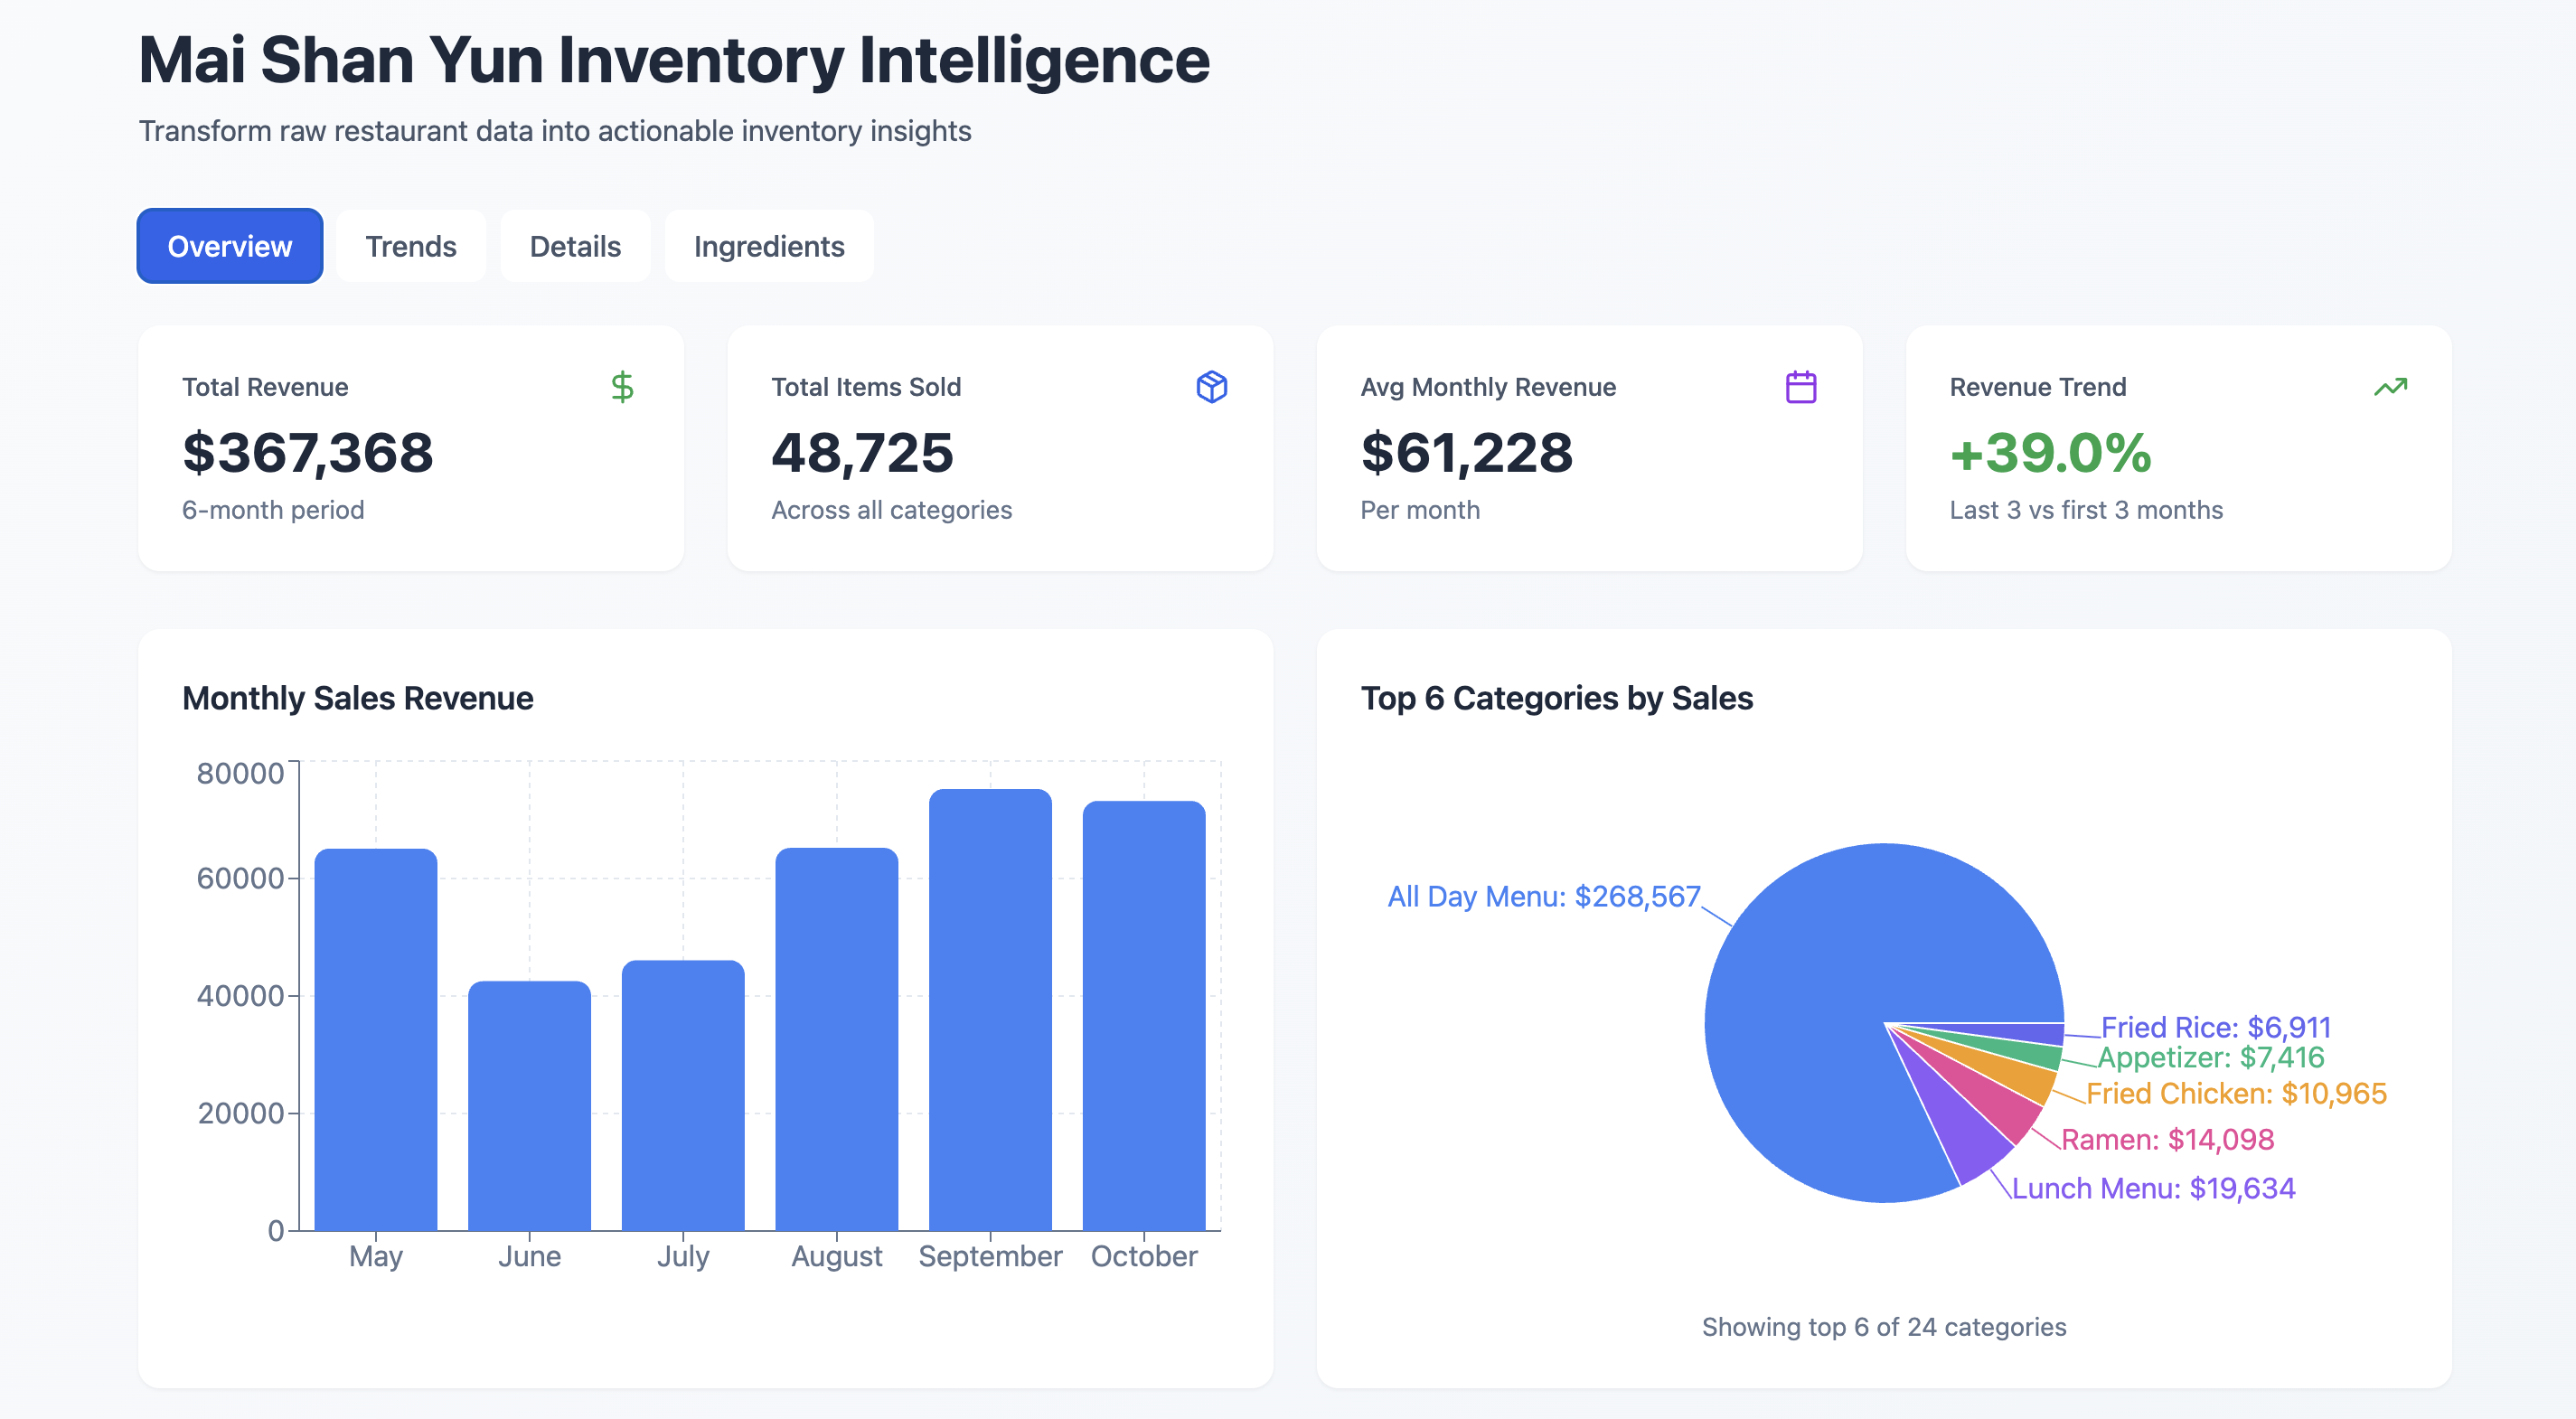
An overview of the businesses income over the few months
Inspiration
Inspiration came from the desire to work with something familiar with being able to create a dashboard with html, however ultimately showed itself as being a challenge for all of us.
What it does
The program displays the data that it collected from the csv and xlsx files given by the company and displays graphs and tables, using predicted trend lines, all as a webpage.
How we built it
Using html and javascript as well as formatting with css all as separate files.
Challenges we ran into
being able to
Accomplishments that we're proud of
Accomplishments that we were proud of was being able to have the tables and data show and be formatted correctly from the external files
What we learned
With previous experiences using html, css, and javascript, it was mainly a learning experience trying to remember how to use the scripting languages, especially javascript
What's next for Mai Shan Yun Inventory Intelligence
For the inventory intelligence, would probable be able to export the raw data collected as xlsx files that are properly organized and formatted and be able to include the expected trends in what foods were more popular and expected revenue or order counts in upcoming months.


Log in or sign up for Devpost to join the conversation.