nspiration
Restaurant managers often struggle to make data-driven decisions due to scattered data in multiple Excel and CSV files. Manual analysis is time-consuming and error-prone. This project creates a unified dashboard that consolidates all restaurant data, providing insights for sales optimization, inventory management, and growth. The goal is to help Mai Shan Yun understand patterns, optimize inventory, reduce waste, and improve profitability with data visualization and AI insights.
What it does
The dashboard includes three key views:
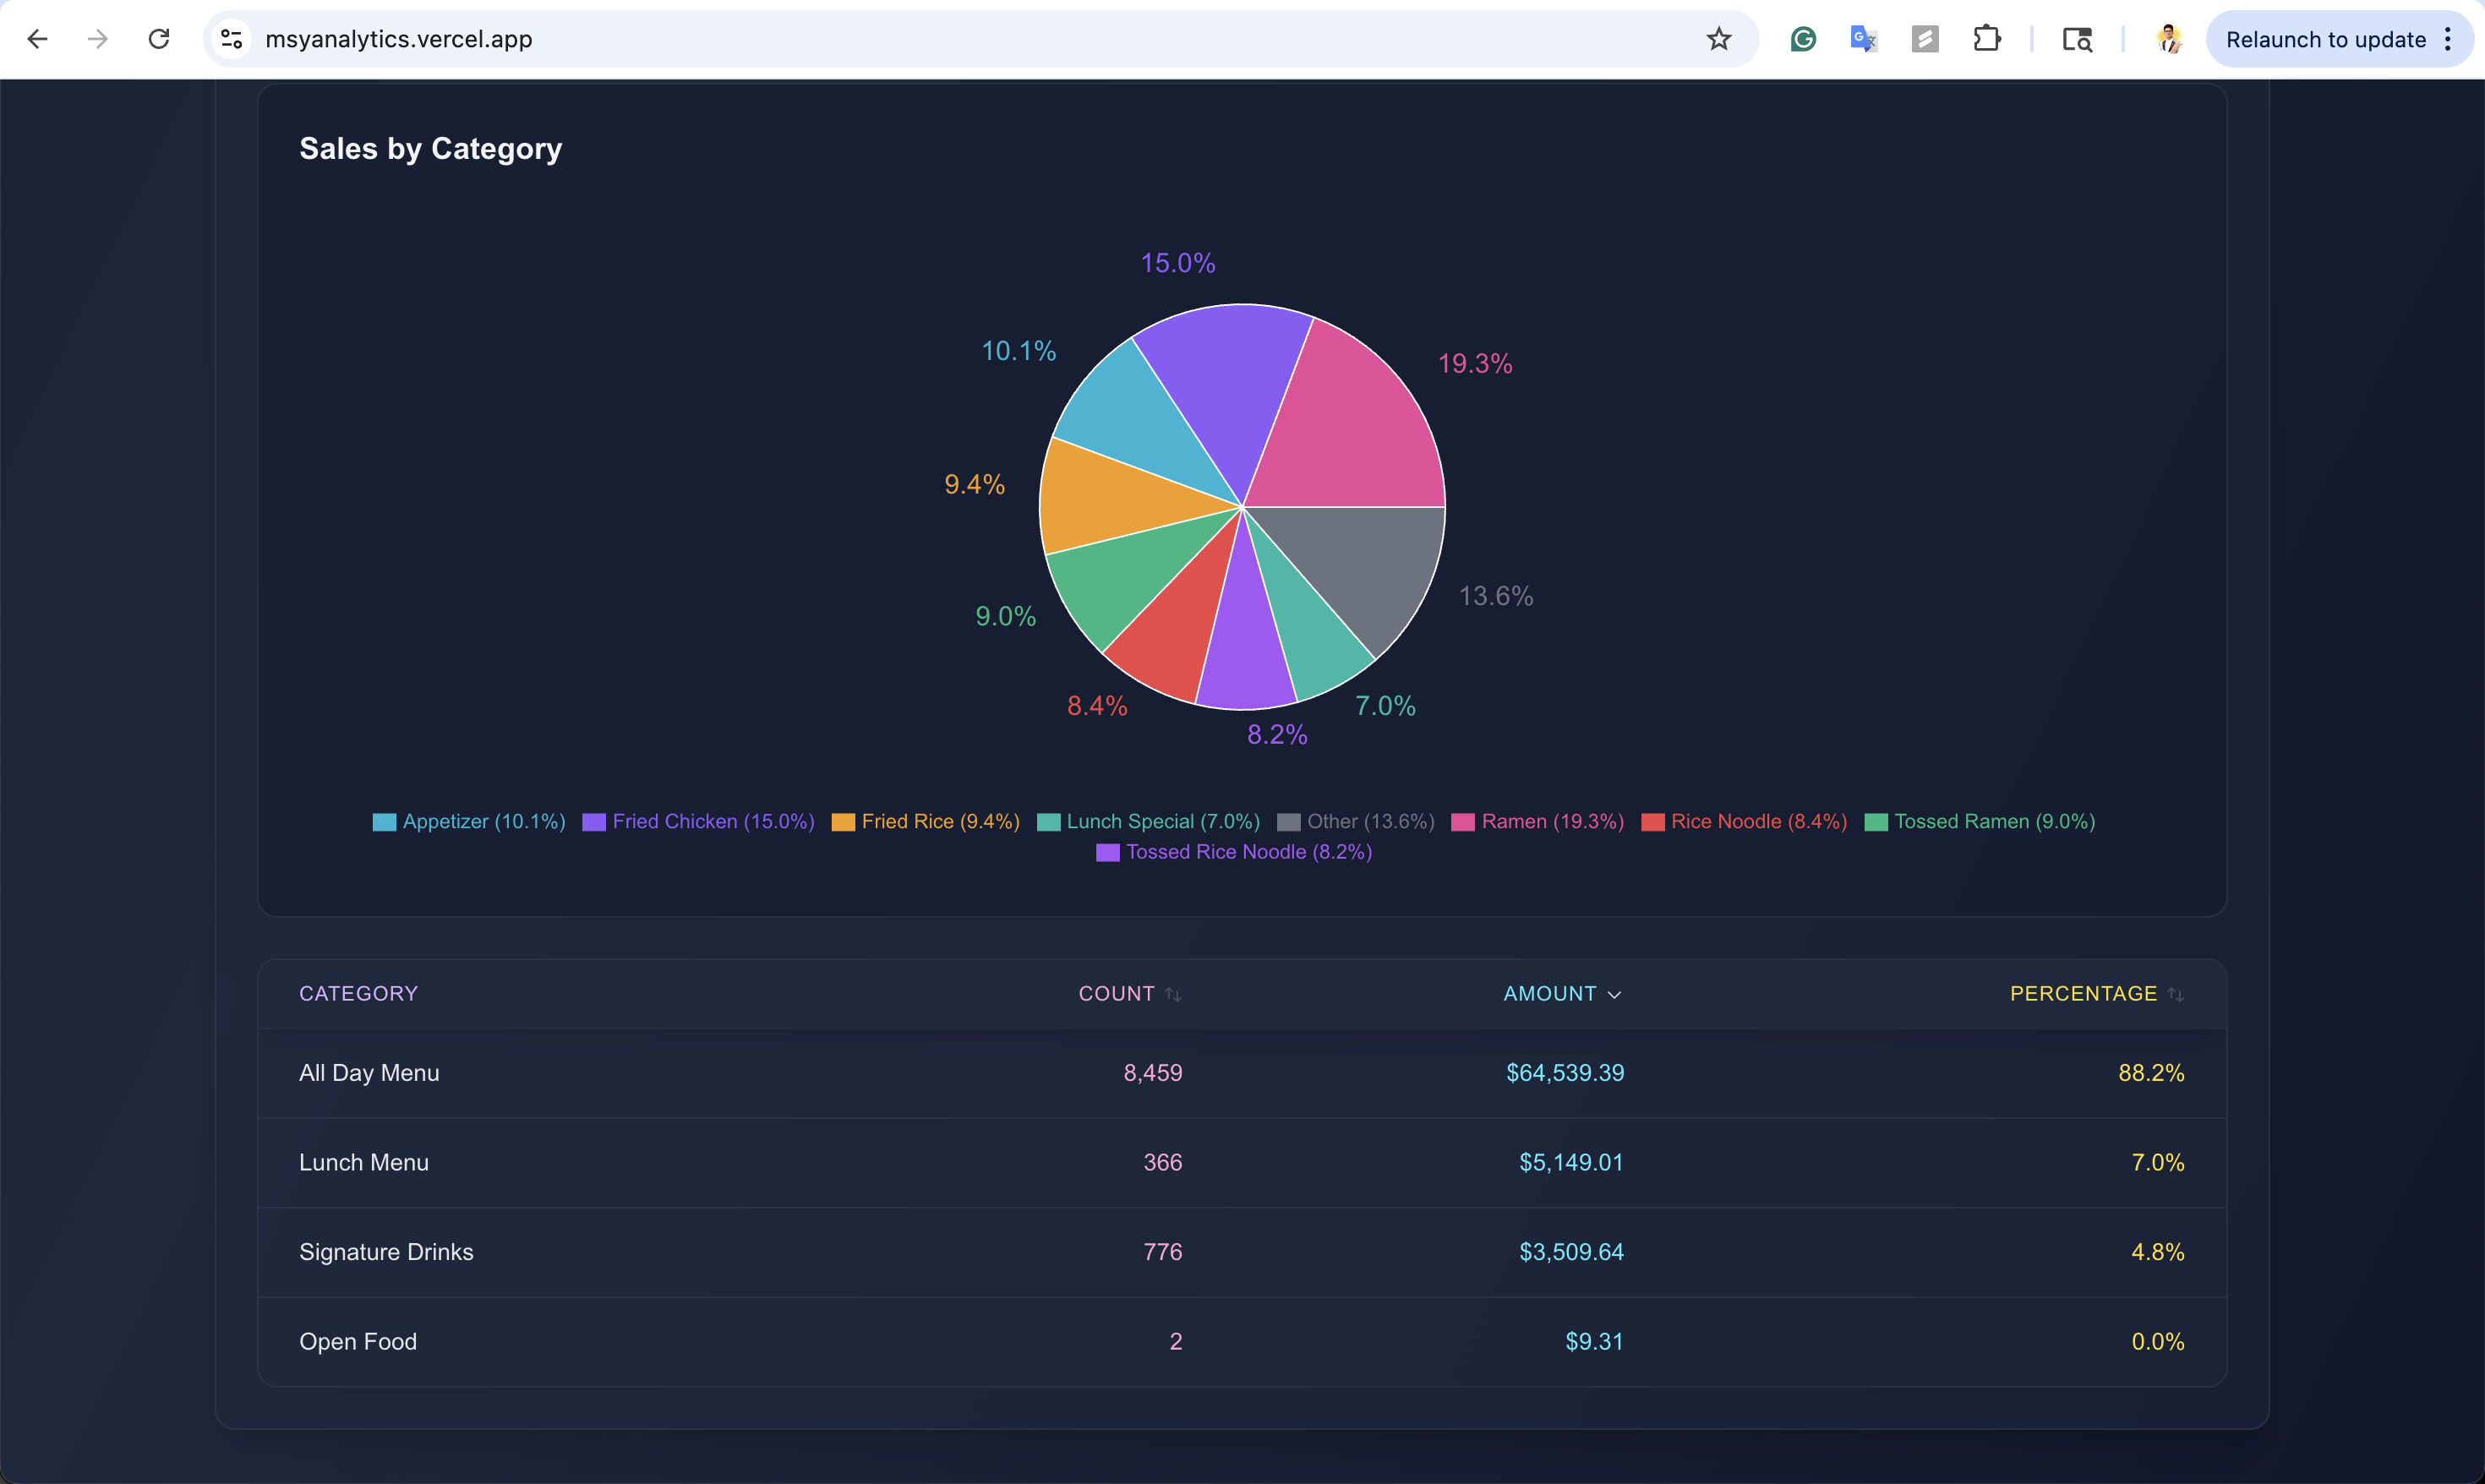
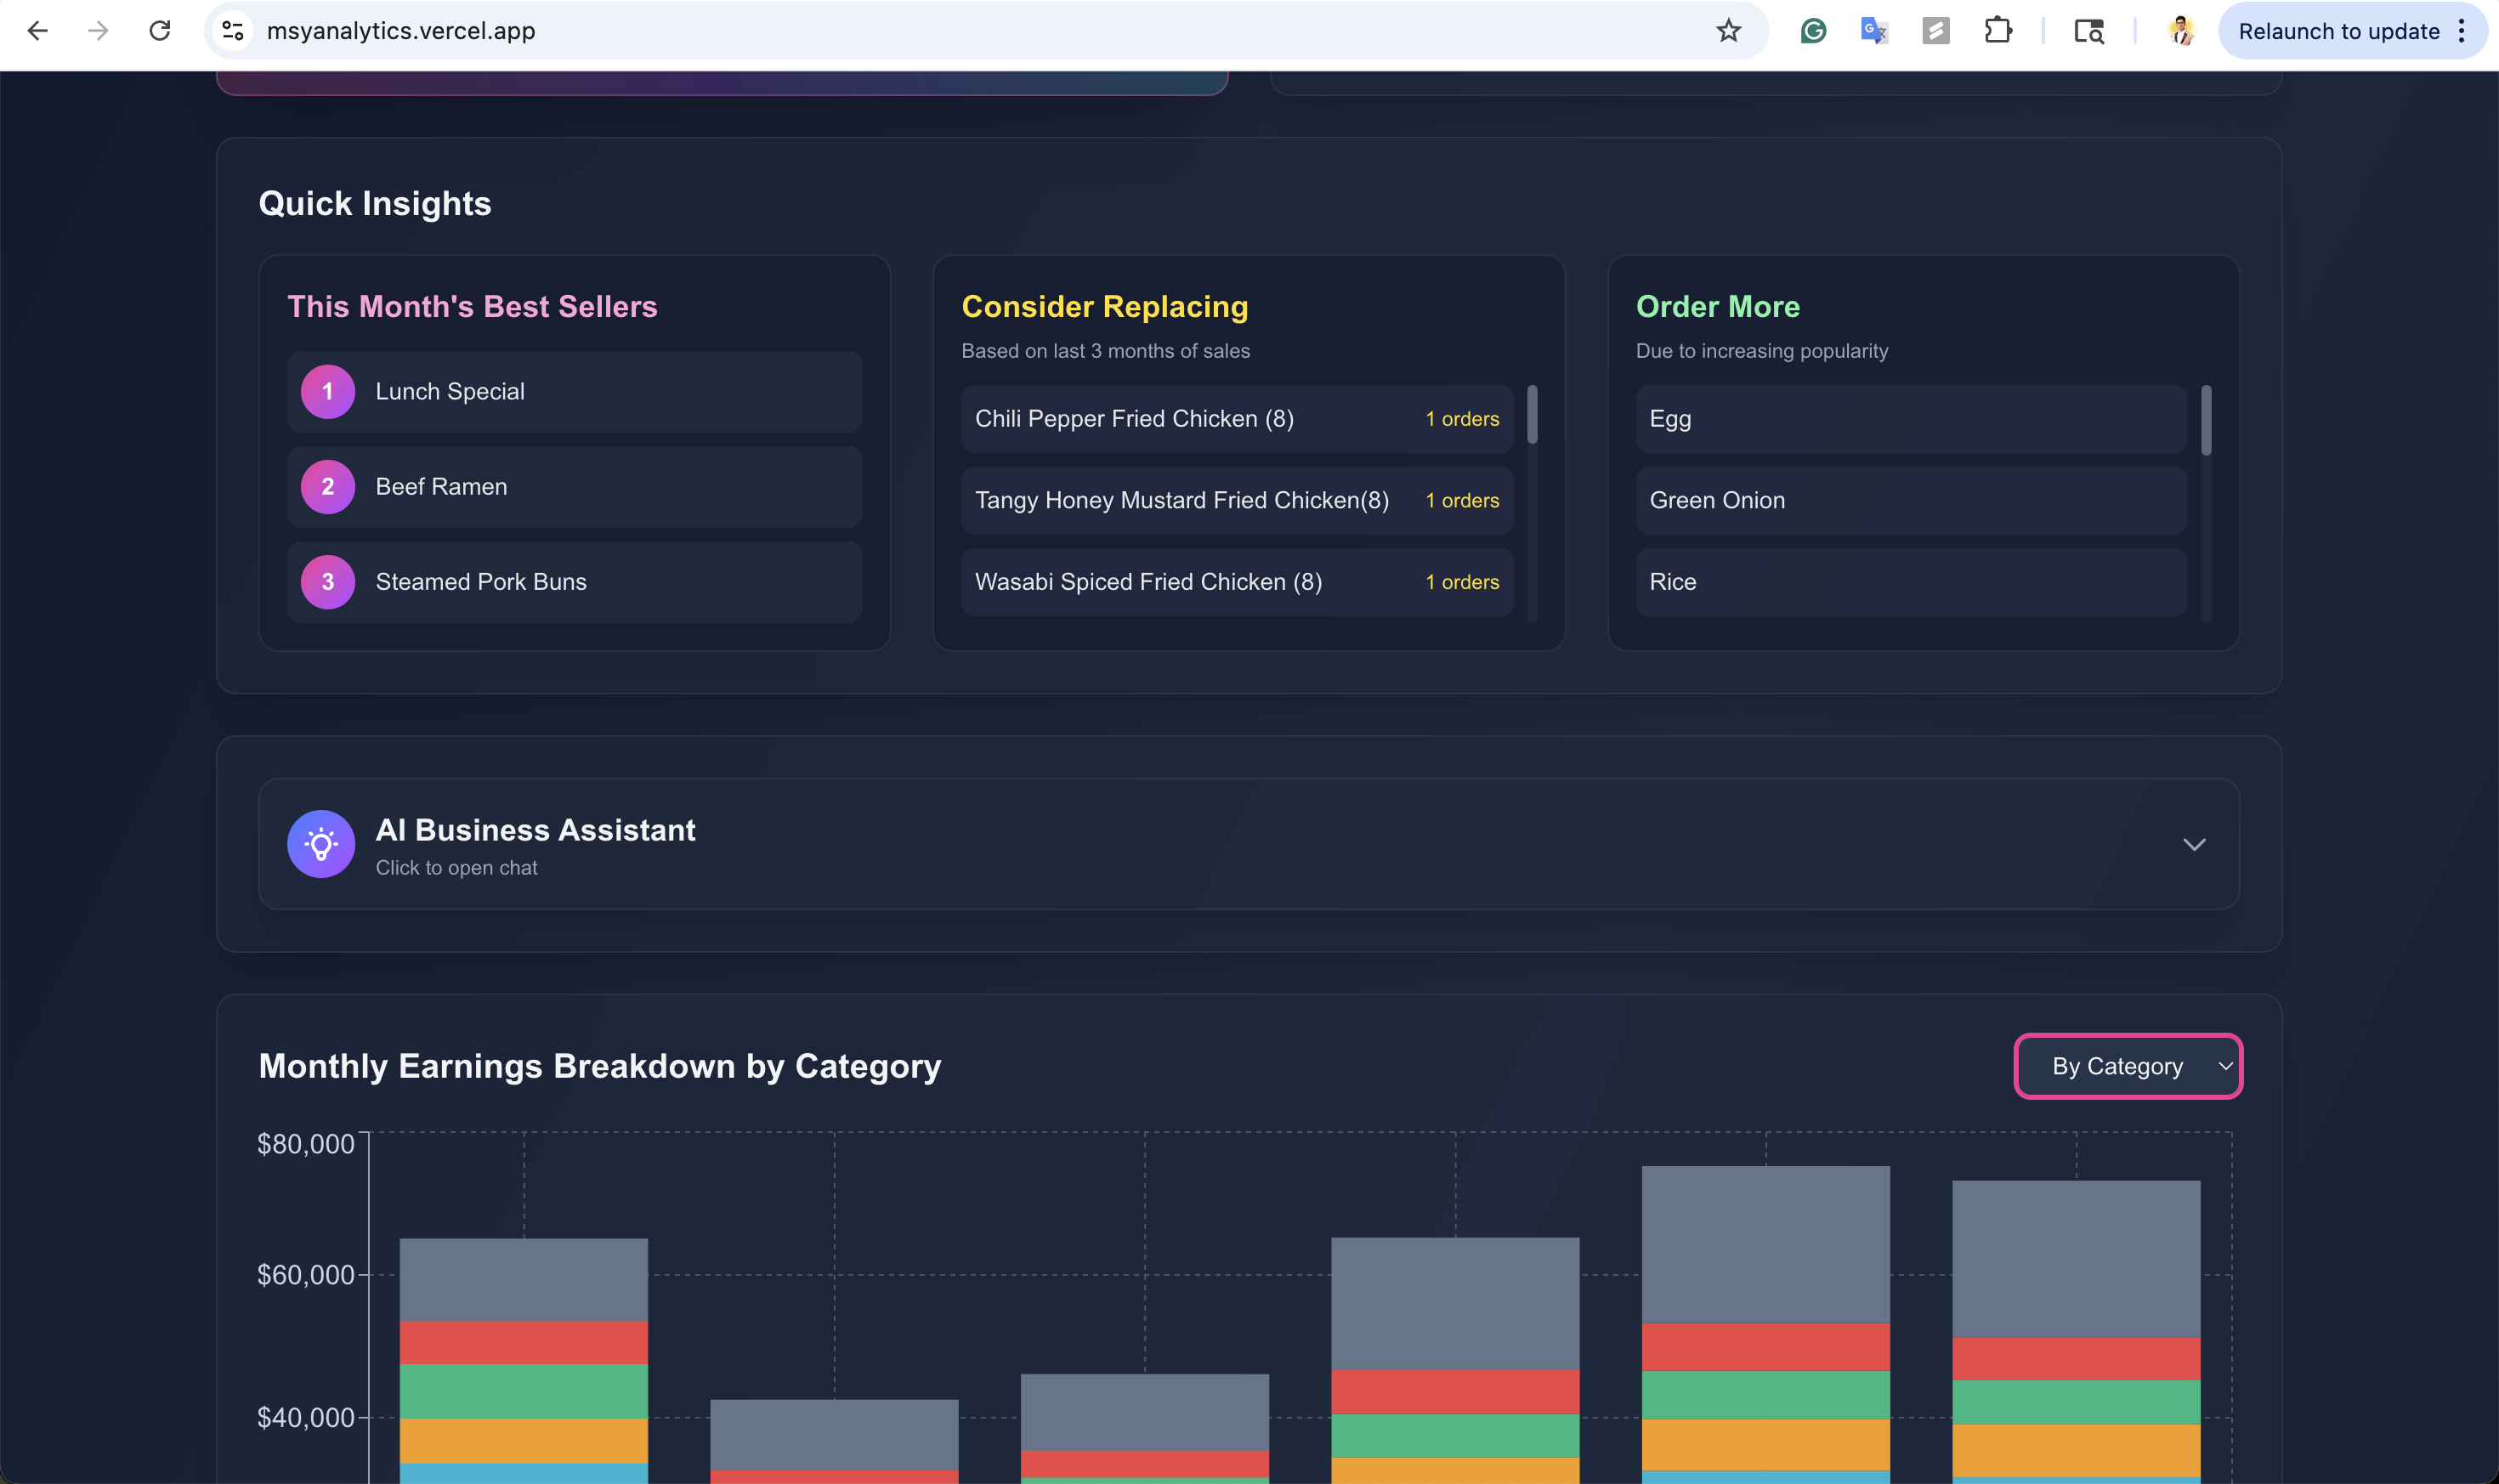
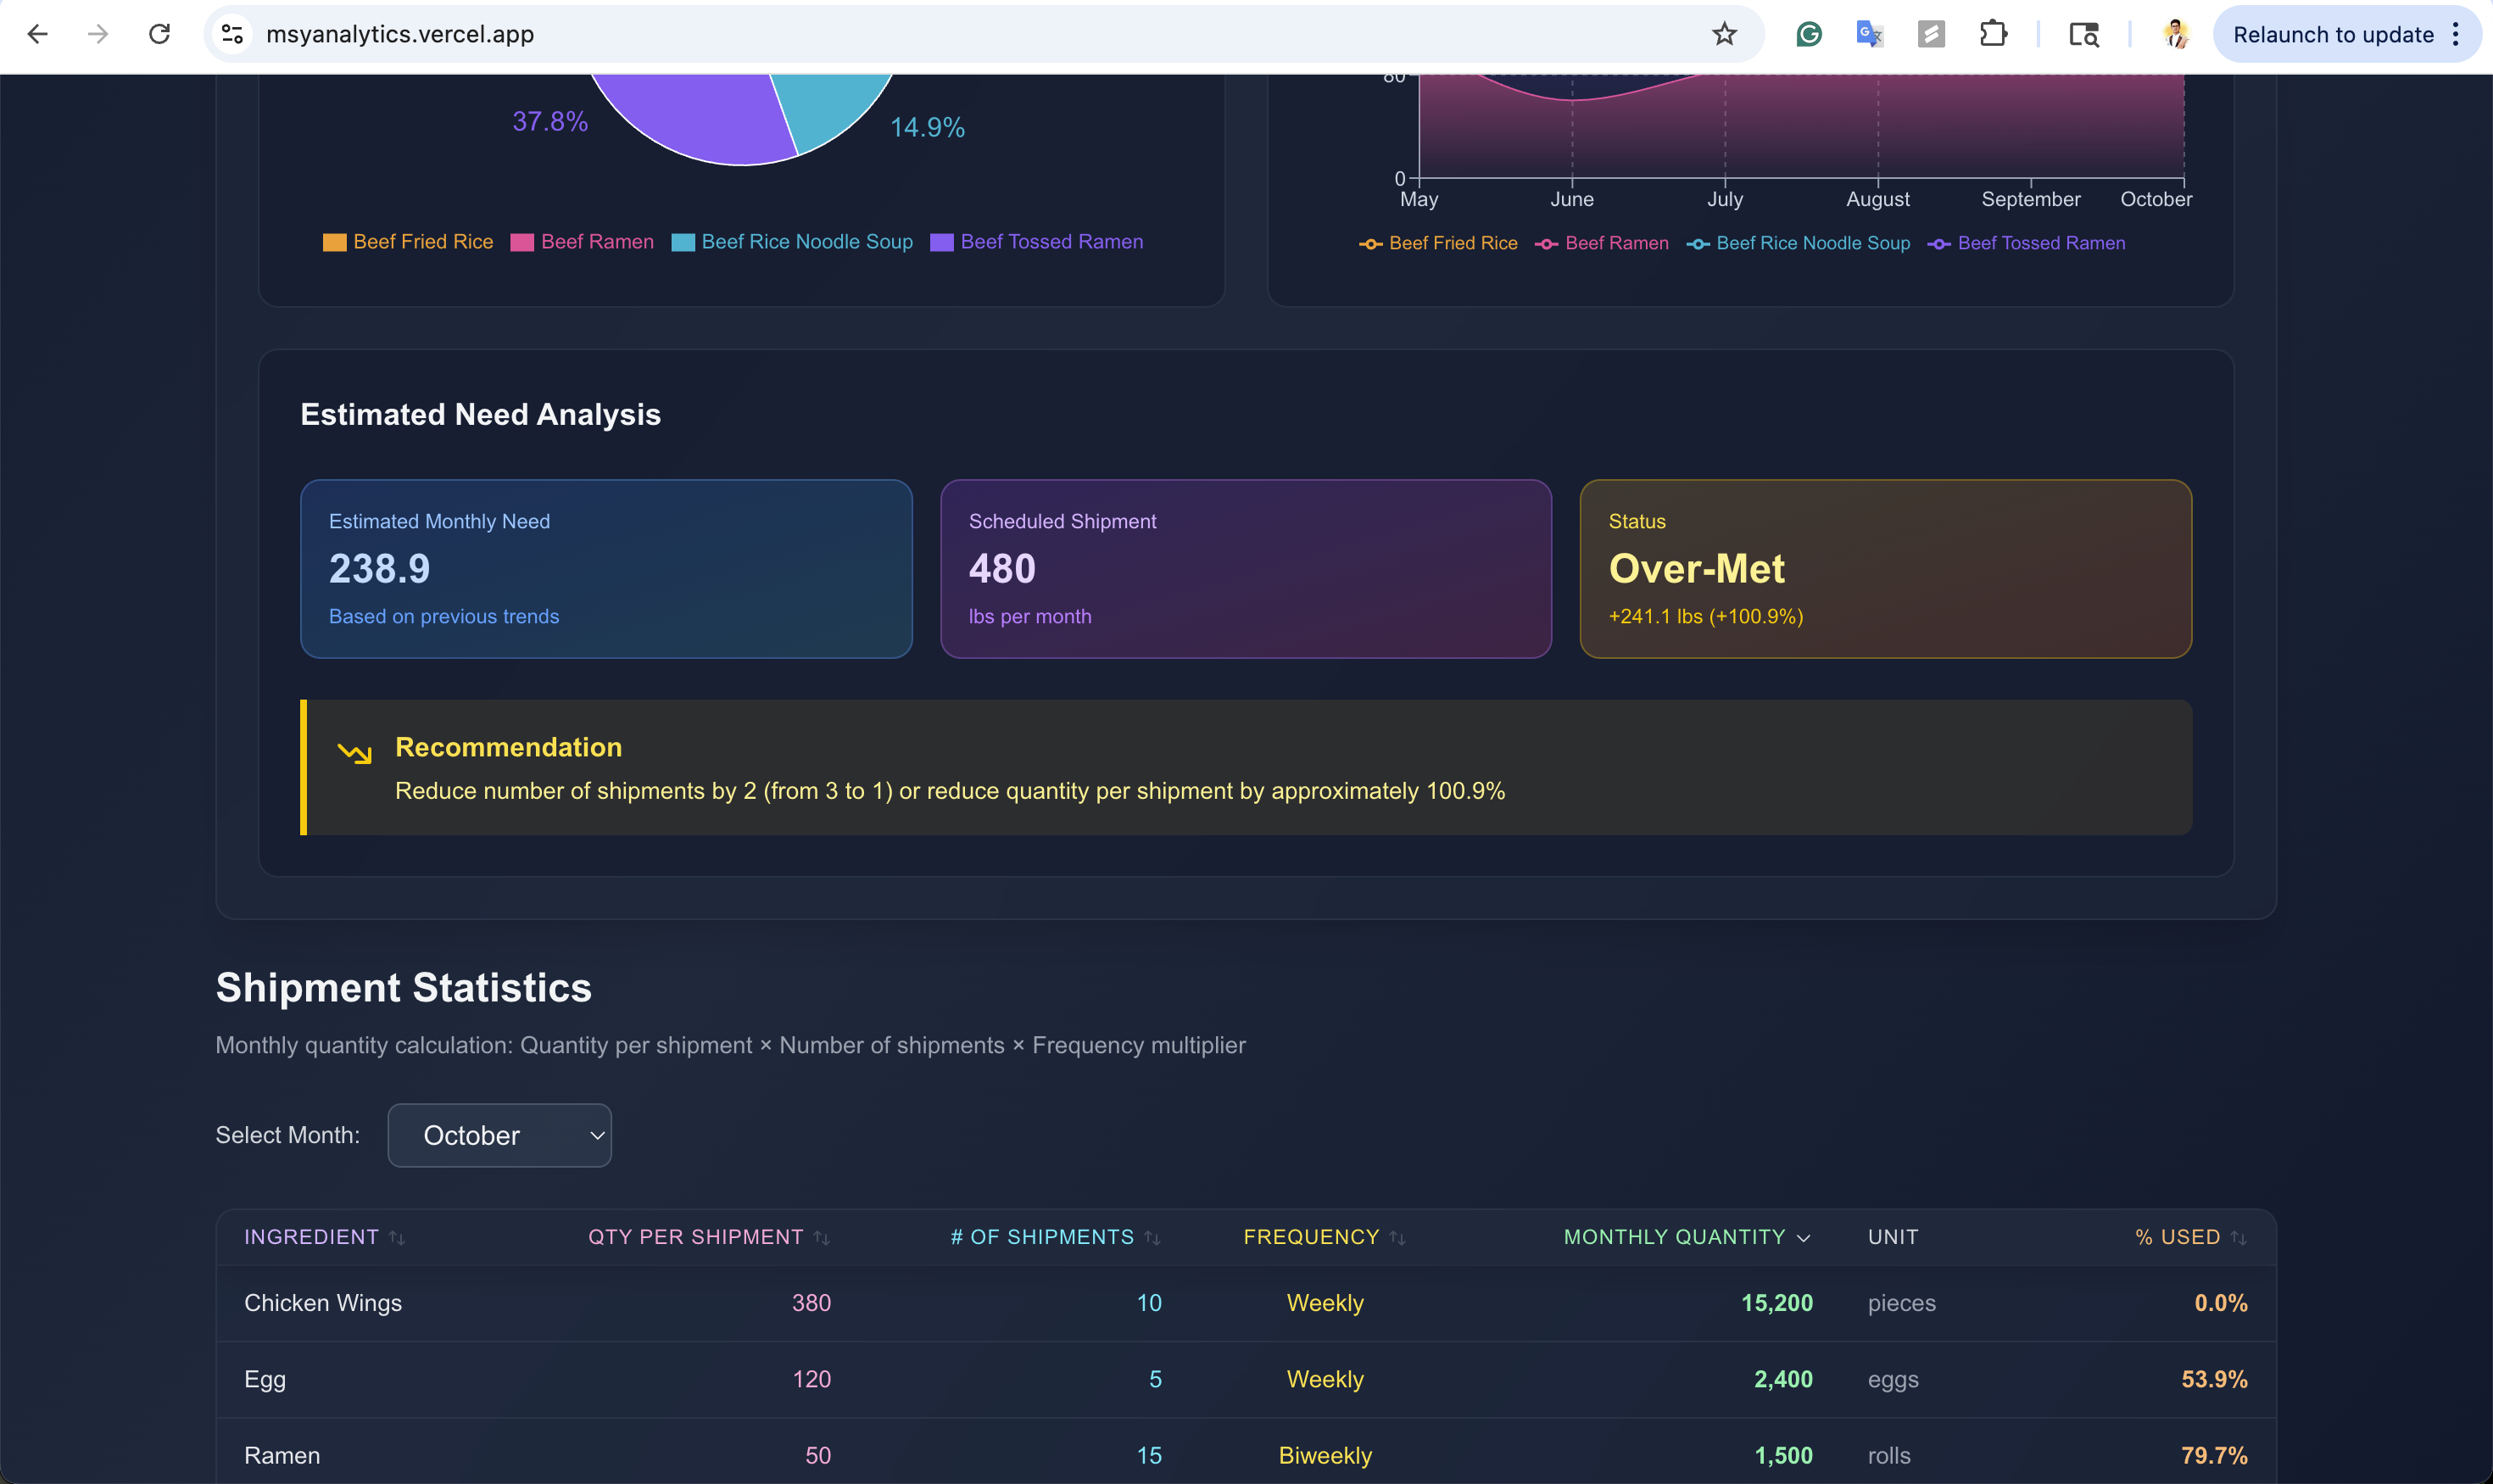
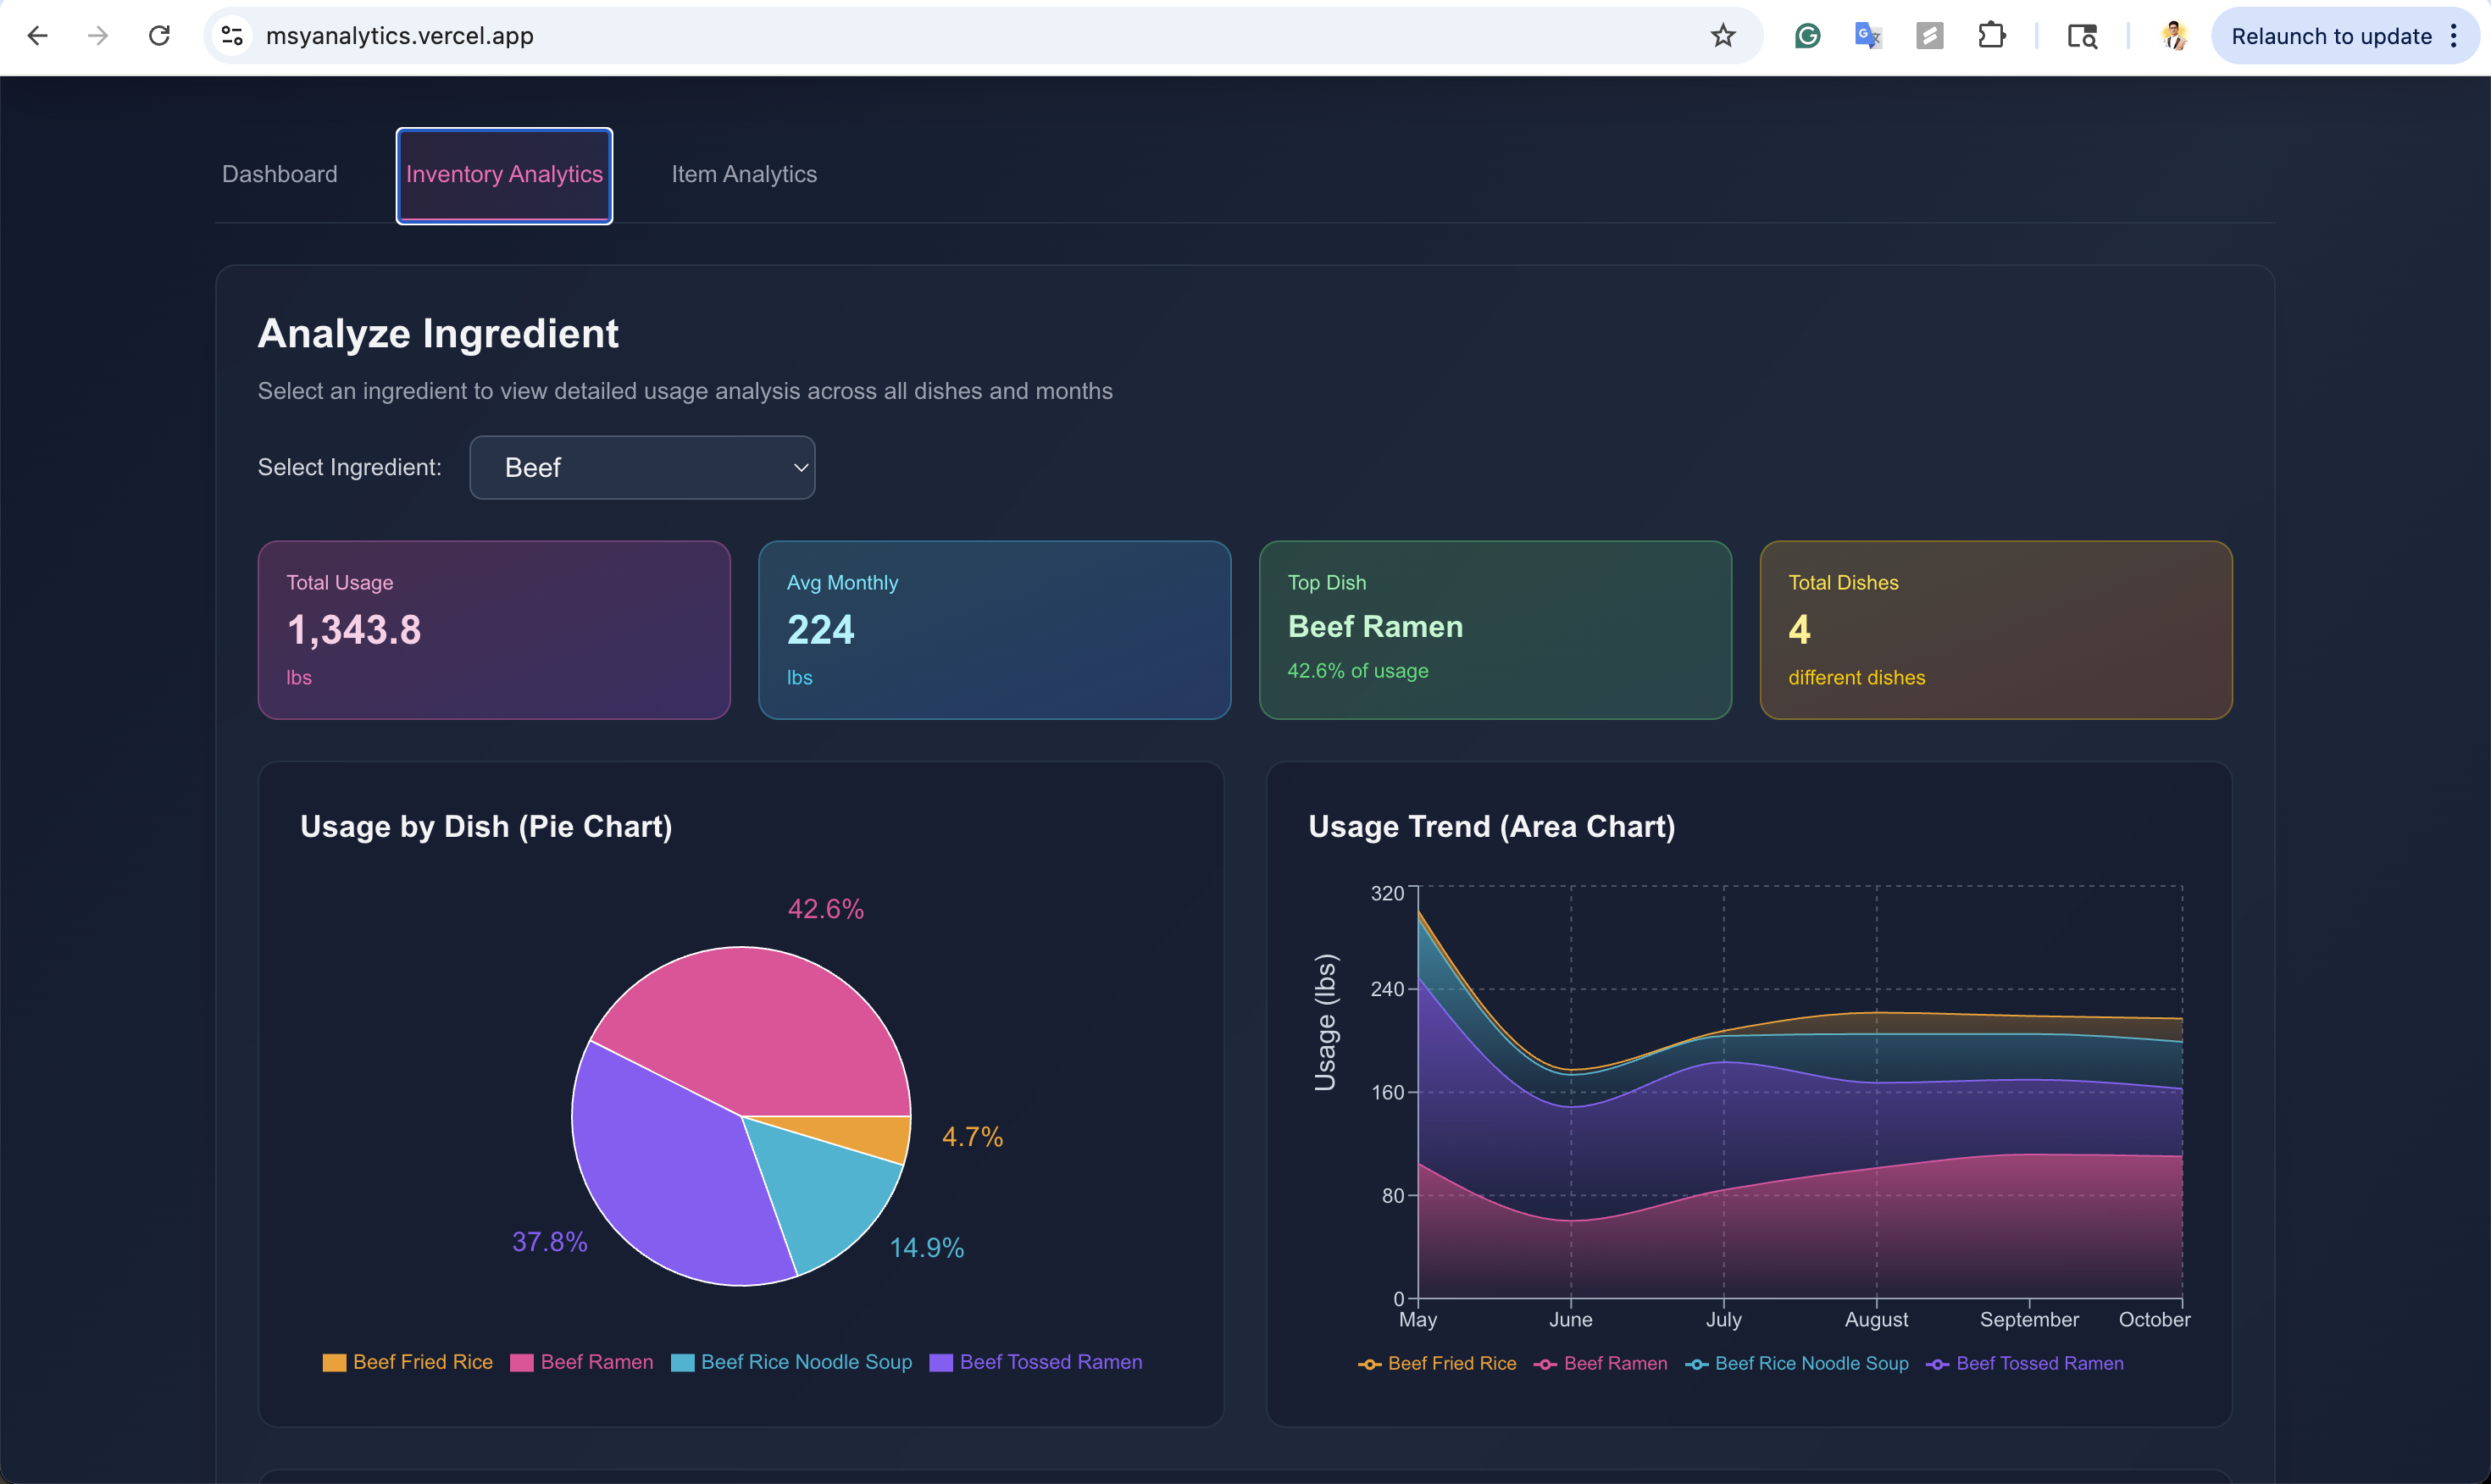
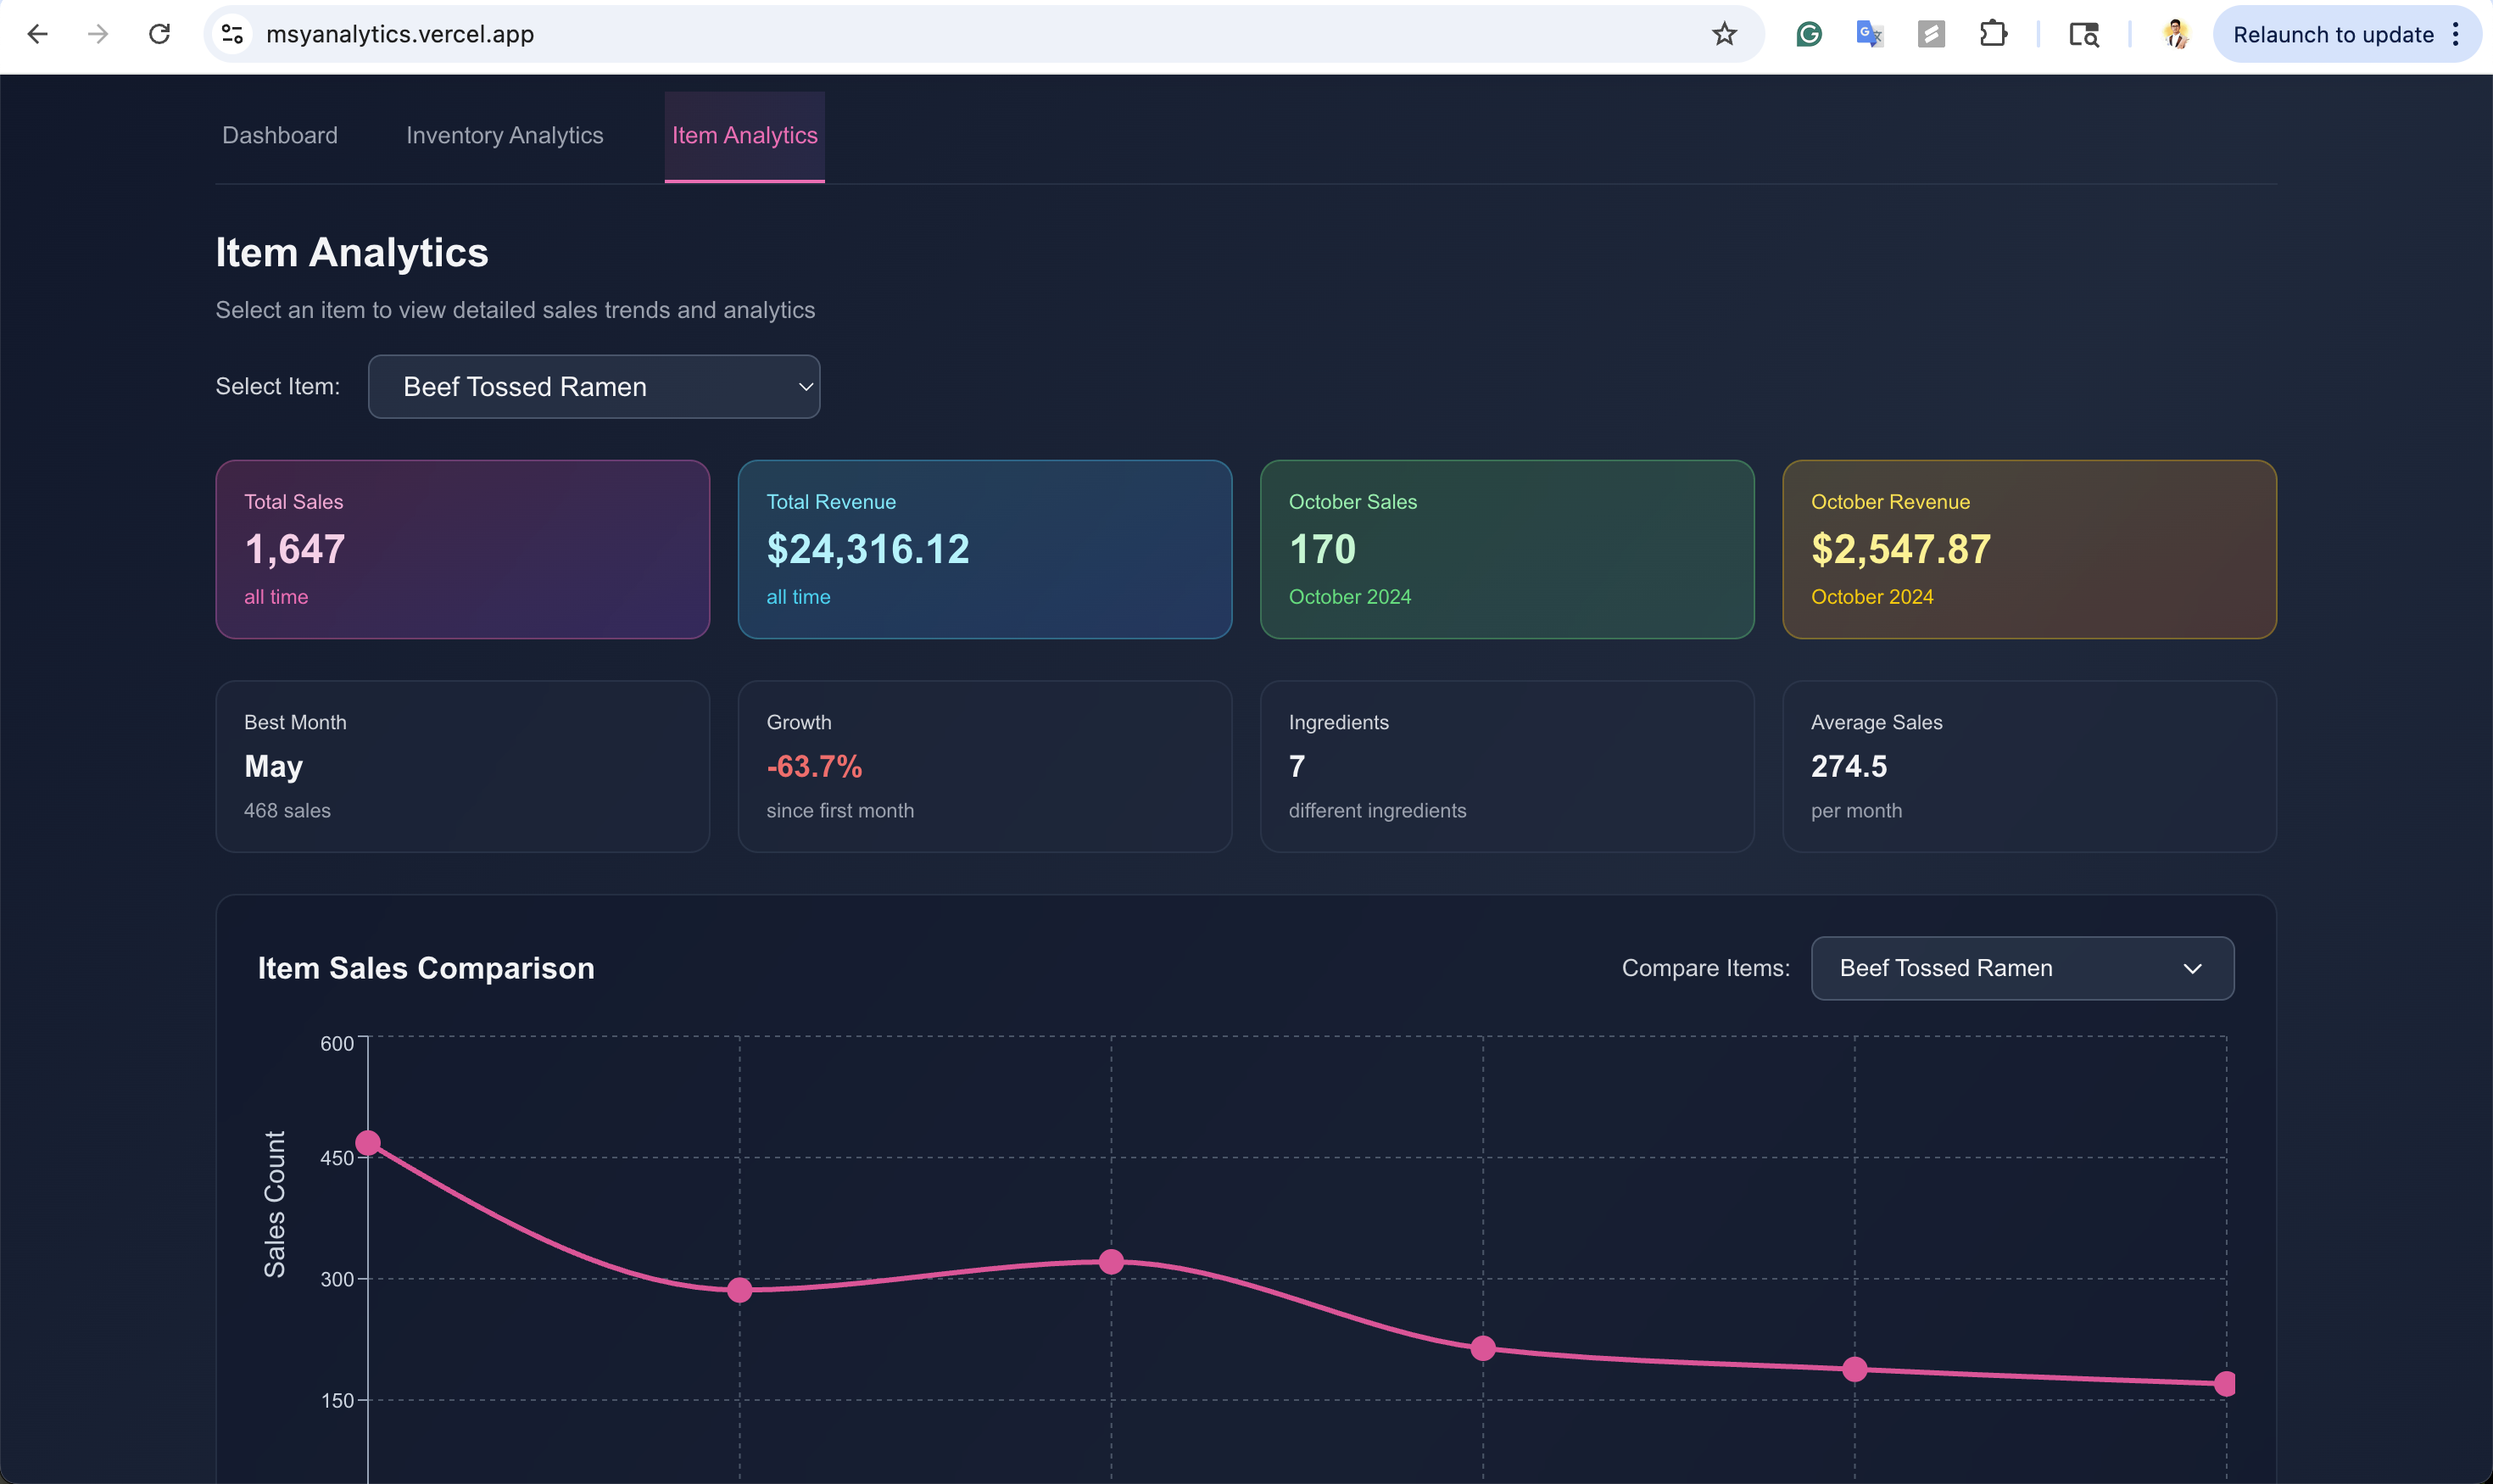
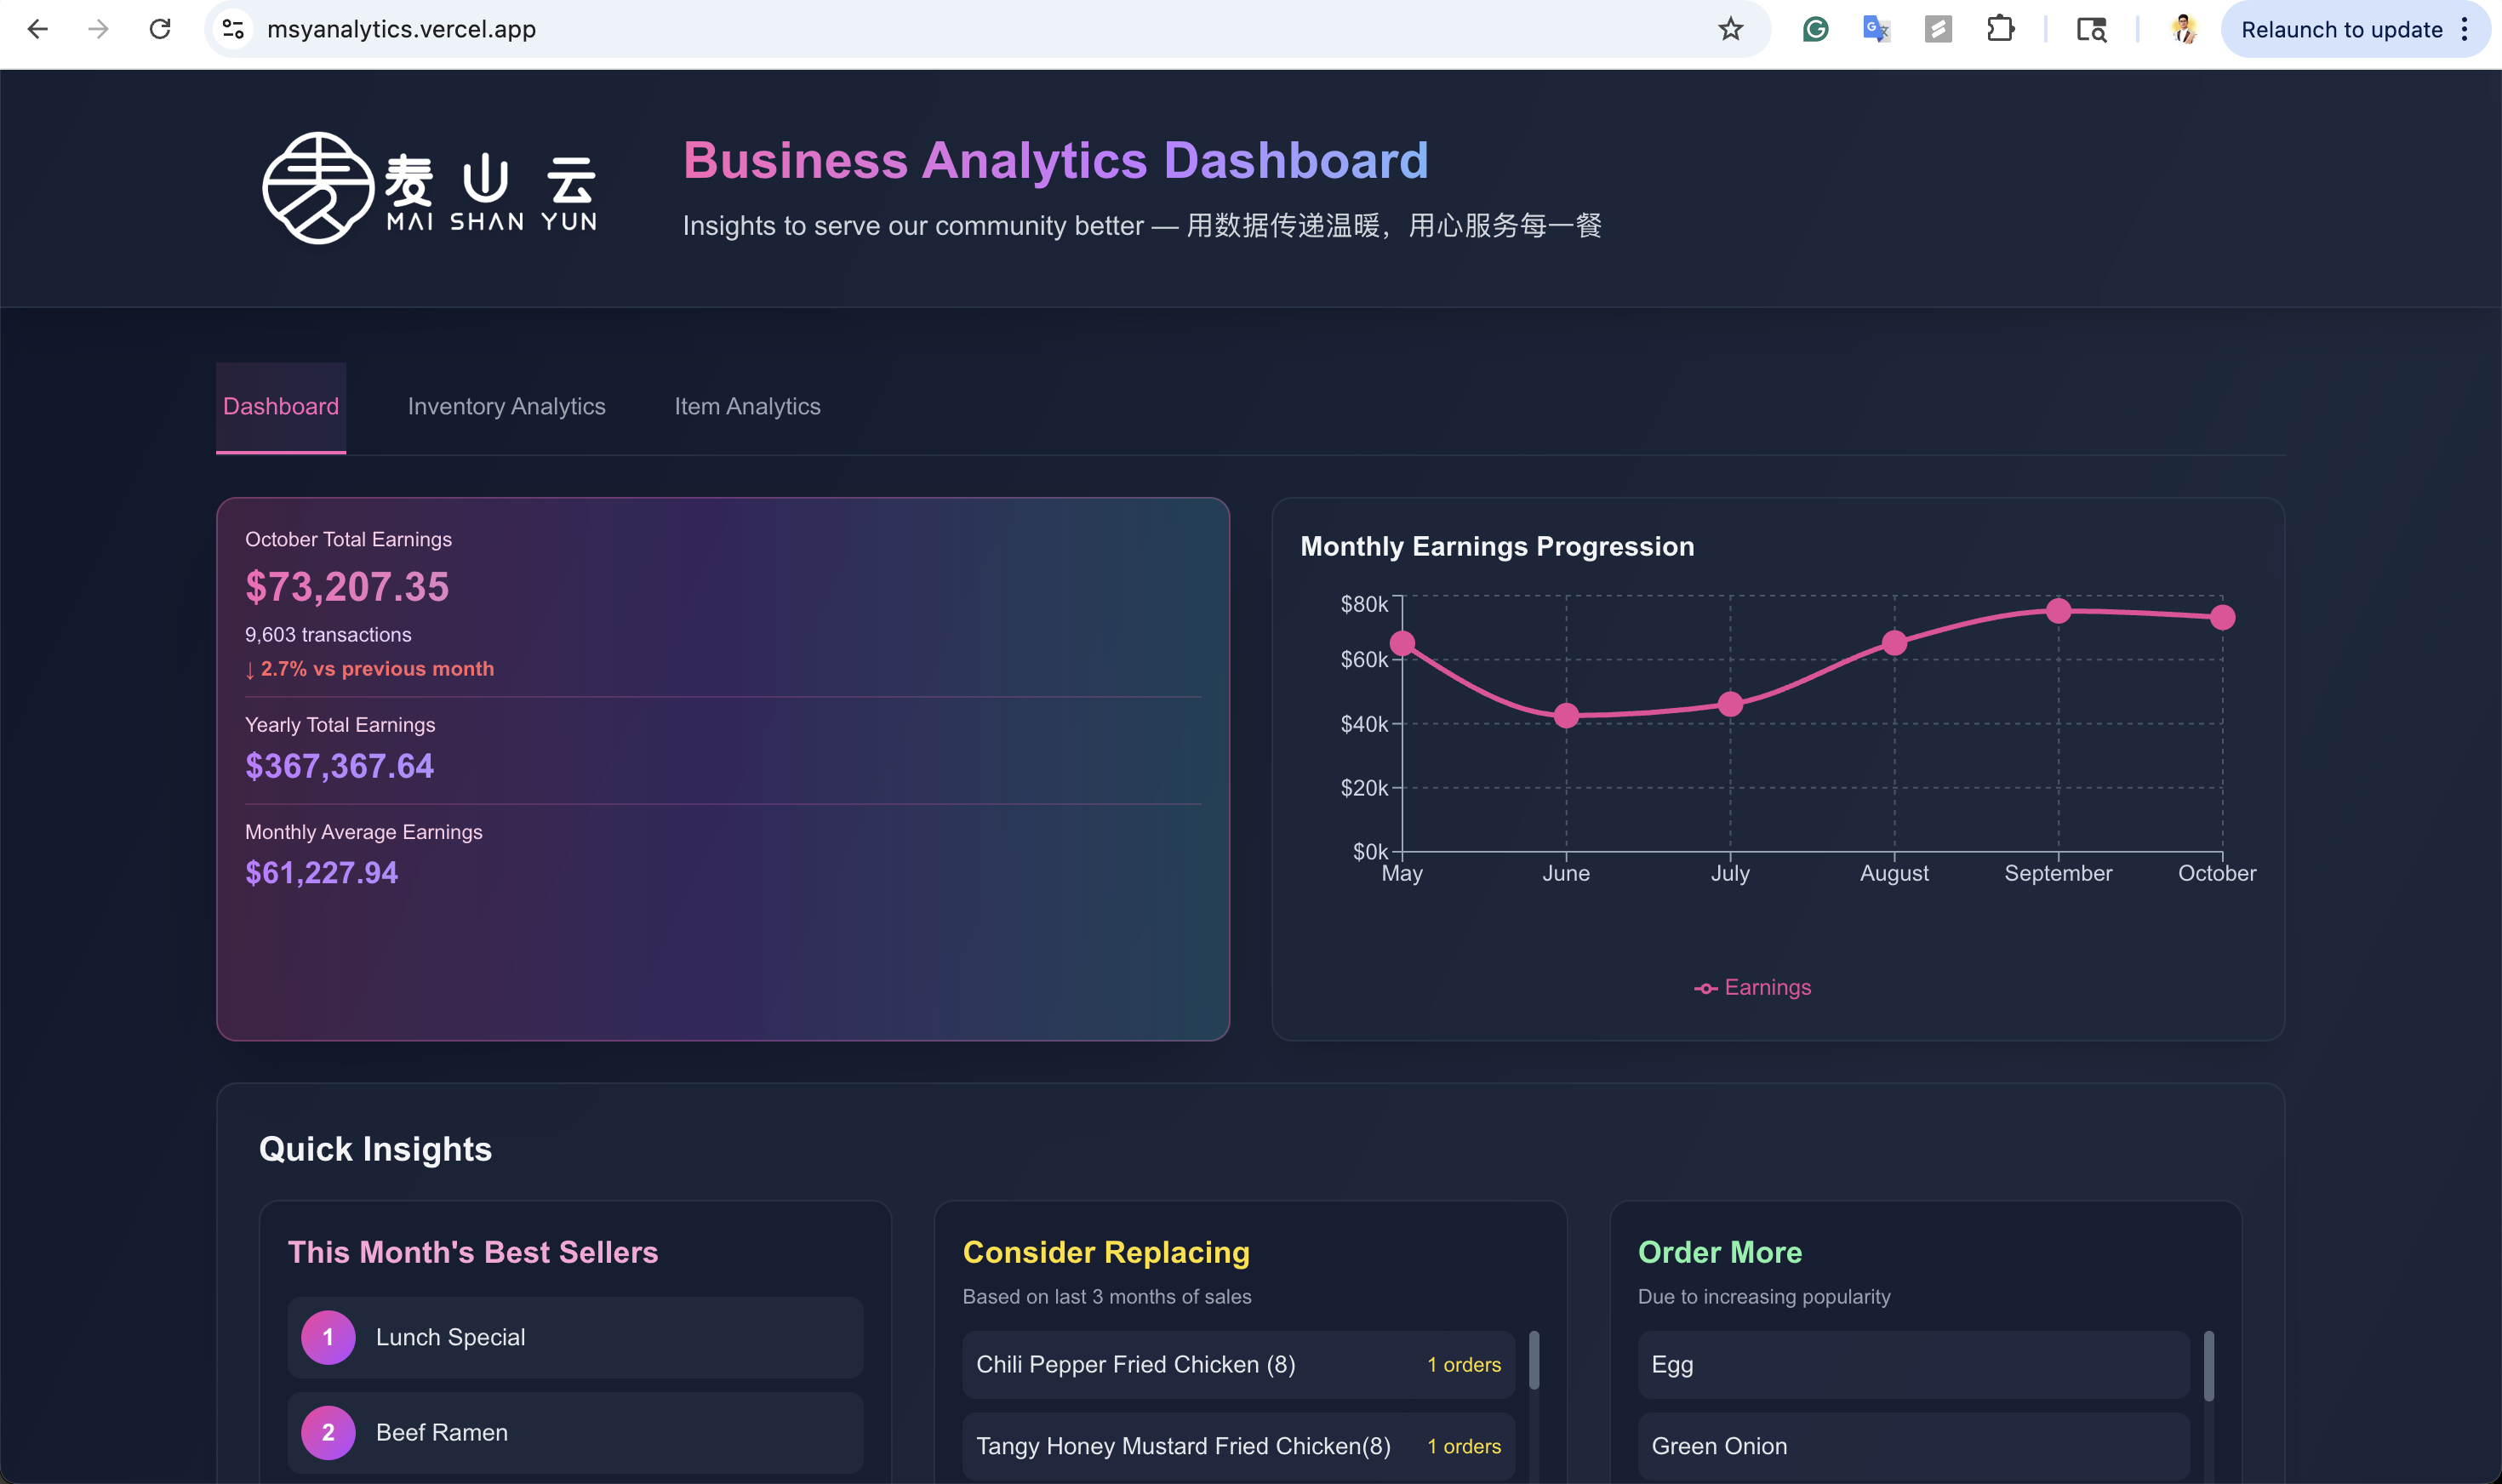
Dashboard tab – Displays monthly earnings, growth trends, top and low performers, and an AI Business Assistant that answers questions and provides market intelligence. Inventory Analytics tab – Tracks ingredient usage, forecasts needs, and gives shipment stats and inventory recommendations. Item Analytics tab – Monitors individual item sales and revenue, compares items, and offers performance recommendations.
The AI Business Assistant, powered by Google Gemini, answers business questions, explains seasonal trends, suggests menu changes, and analyzes ingredient markets.
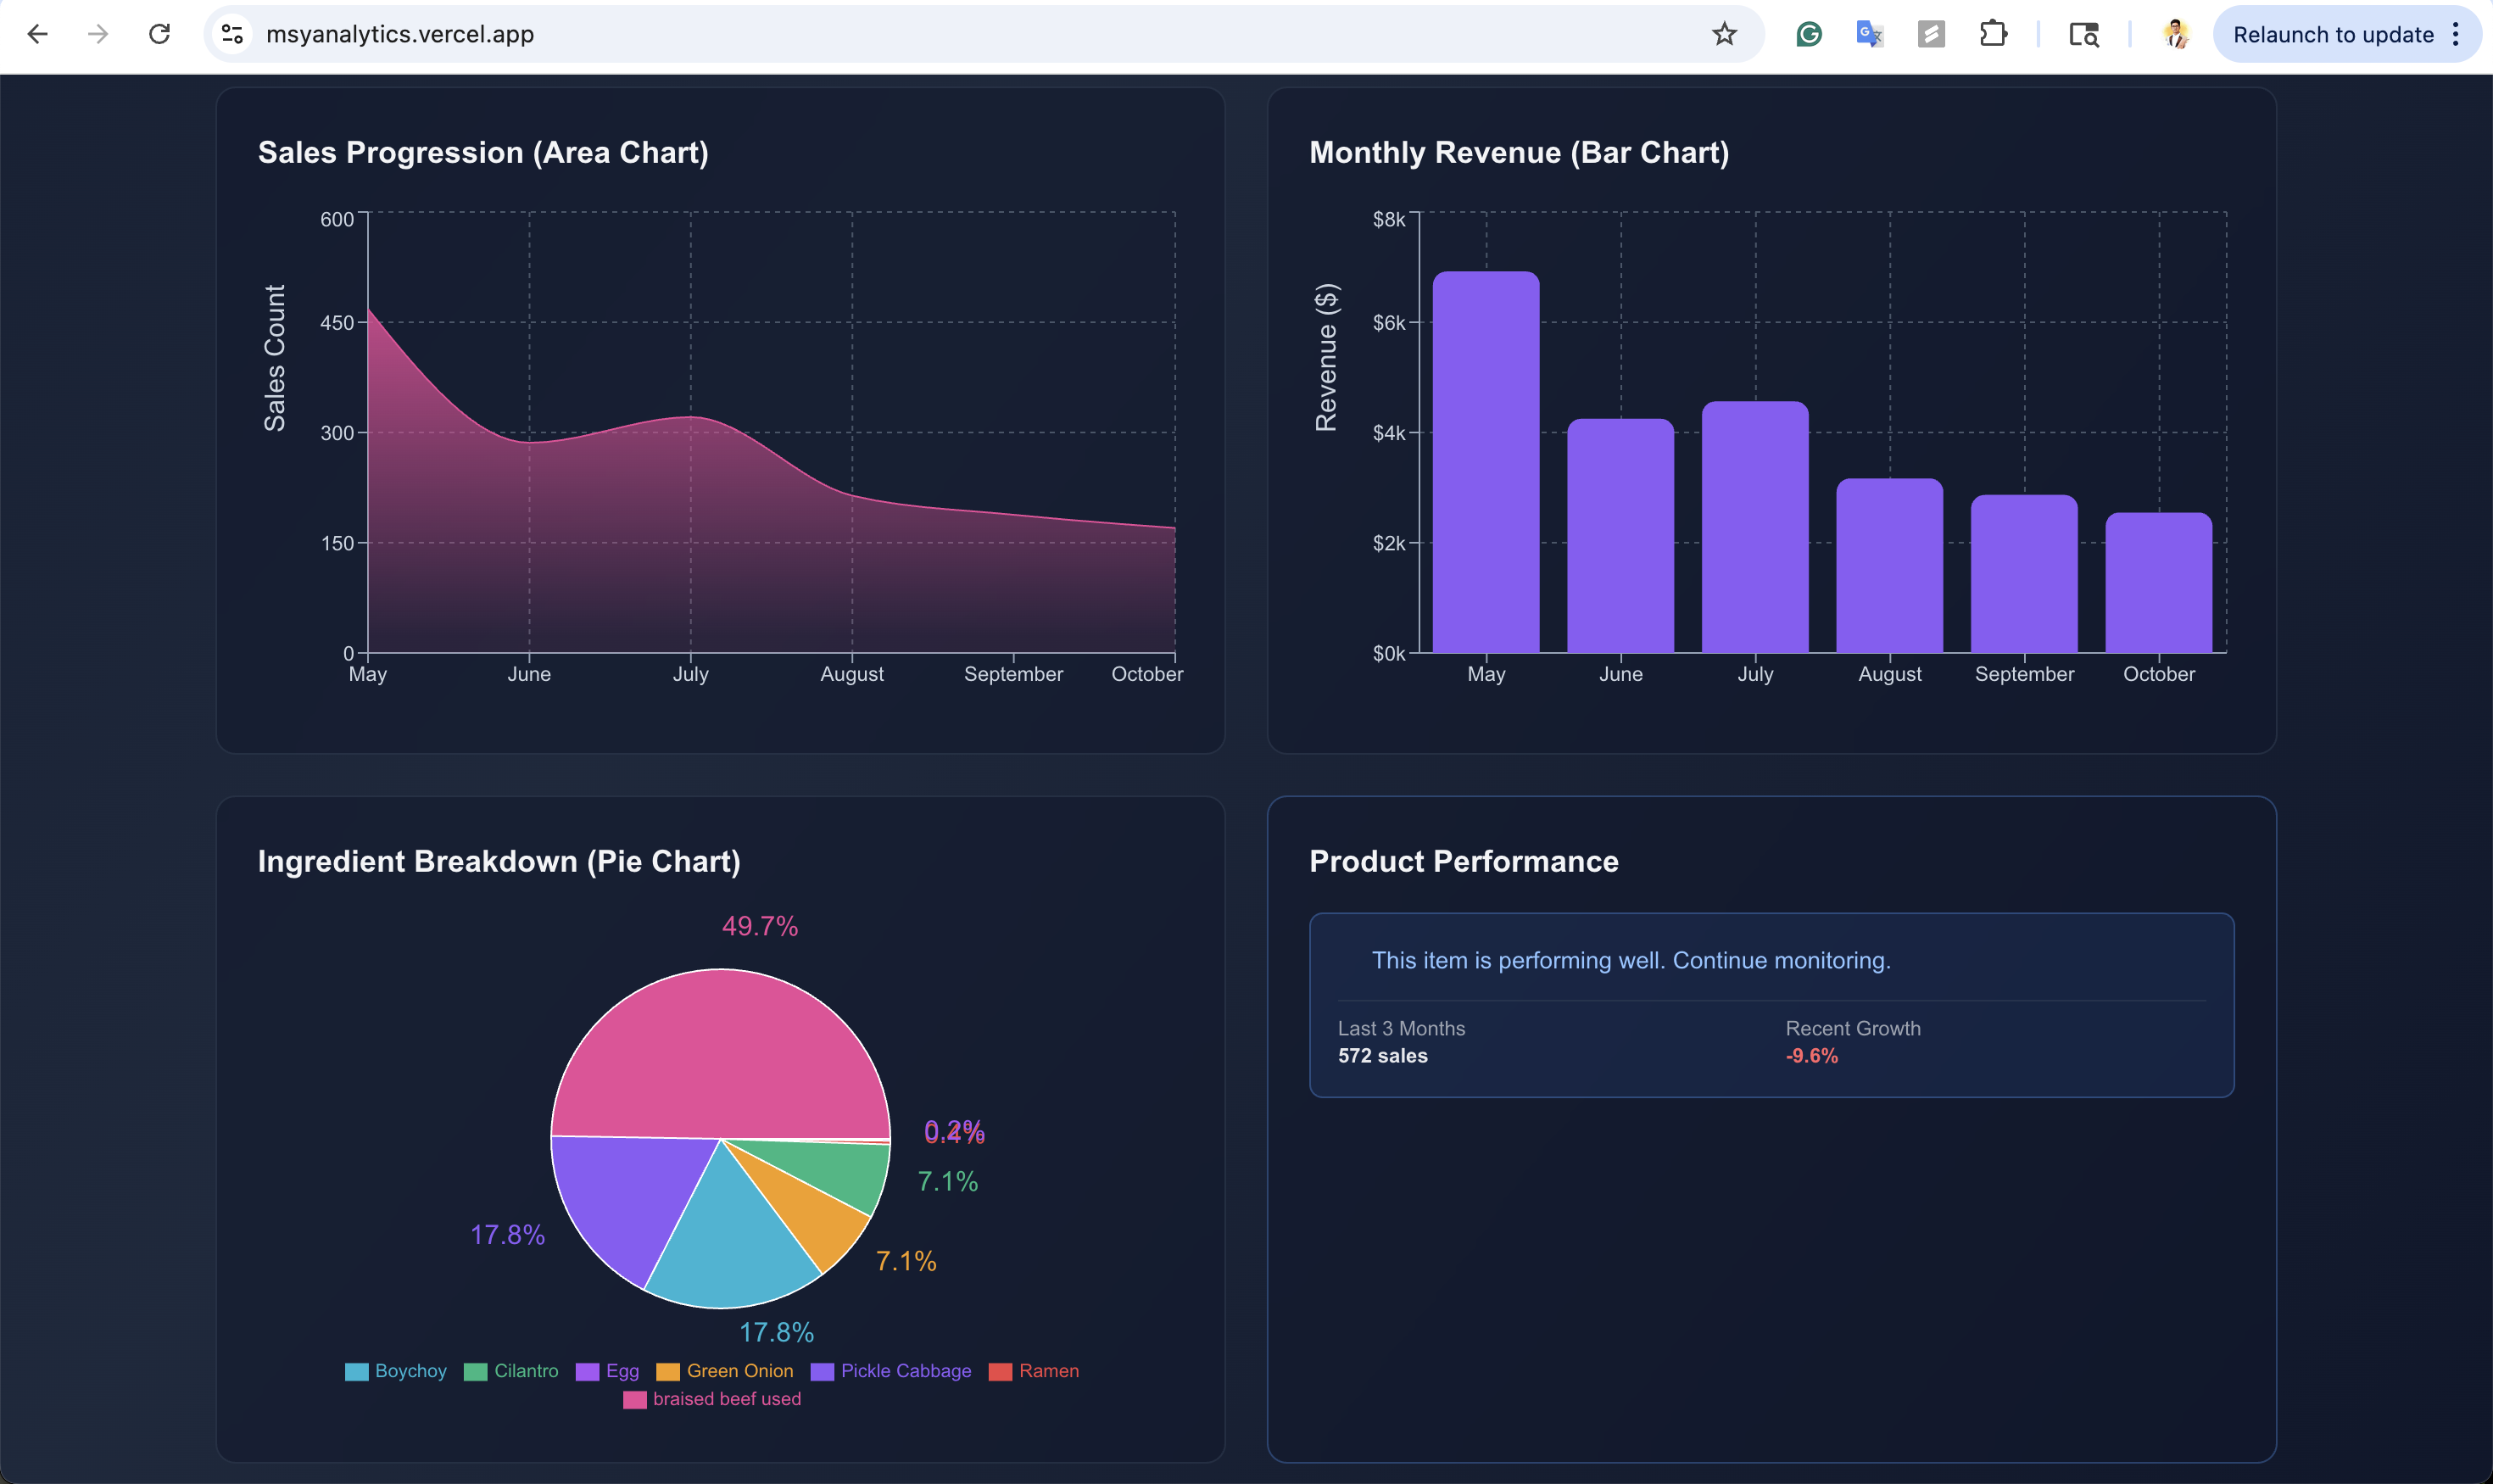
How we built it
Built with Next.js 16, TypeScript, and React, styled with Tailwind CSS, and visualized with Recharts. Data integration uses PapaParse and XLSX for parsing, with custom loaders that aggregate data, map items to ingredients, and calculate usage. Unit conversions handle mixed measurements. A Next.js API route manages AI chat requests using Gemini with restaurant-specific context. React hooks (useState, useEffect, useMemo) improve performance and UI responsiveness.
Challenges • Handling multiple file formats and inconsistent data. • Fuzzy matching item names between sales and ingredient data. • Performance issues with large Excel files. • AI model availability and API reliability. • Maintaining smooth UI during real-time data updates. • Ensuring accurate unit conversions. • Optimizing charts for large datasets.
Accomplishments • Unified data from multiple sources into one dashboard. • AI Assistant that provides actionable insights and market intelligence. • Robust data pipeline with normalization and forecasting. • Clear, interactive visualizations and a responsive UI. • Multi-item comparison and seasonal pattern detection. • Seamless Gemini AI integration with context-aware prompts.
What we learned • Data normalization and validation are critical. • React performance tuning (memoization, dependency management) matters. • AI requires solid fallback and error handling. • User experience improvements like loading states and smooth transitions enhance usability. • Business understanding is key for meaningful analytics. • Recharts is powerful but needs careful optimization.
What’s next • Real-time POS integration for automatic updates. • PDF/Excel export features. • Custom date range analysis. • Predictive analytics for sales and inventory. • Alerts for low inventory or sales shifts. • Integration with ordering and supplier systems. • Mobile app access. • Advanced filtering and year-over-year comparisons.
Built With
- ai
- gemini
- next.js-16
- react
- tailwind
- typescript


Log in or sign up for Devpost to join the conversation.