-
-
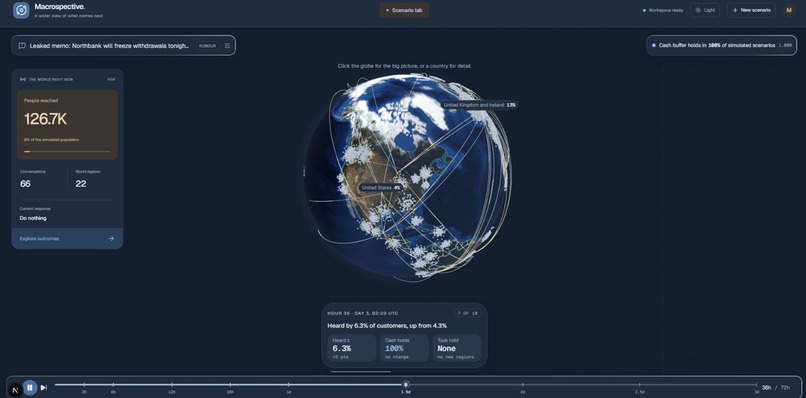
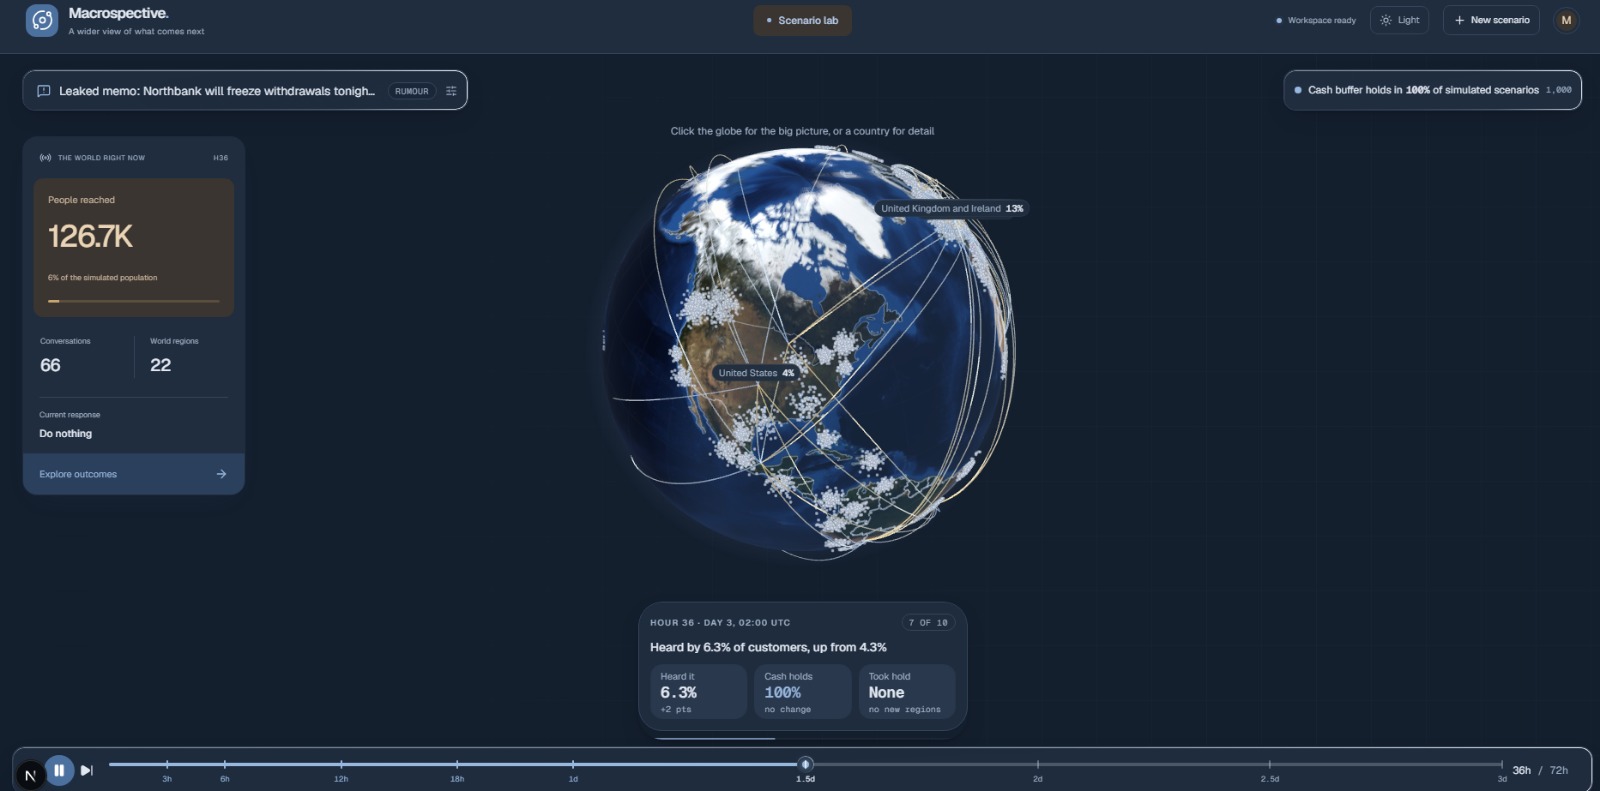
Main page (dark mode)
-
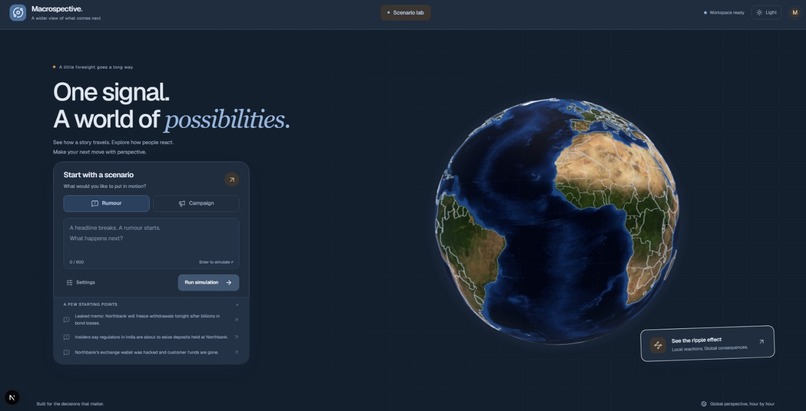
Landing page
-
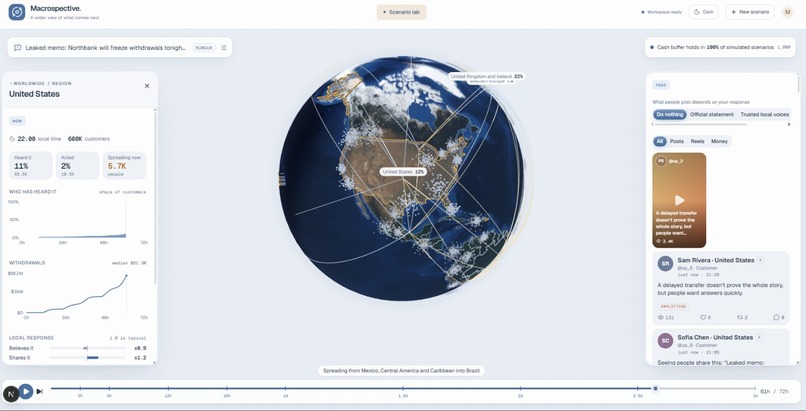
Main page (light mode)

Inspiration
In March 2020, my father worried about whether he would have access to his own savings. His money was in Yes Bank. When authorities imposed withdrawal restrictions, the balance on his account stopped feeling like money our family could depend on. He had spent years saving. Suddenly, he had to think about which payments mattered most and how long the restrictions would last. Every headline brought another reason to check his phone. Official updates competed with forwarded messages, and our family struggled to separate reliable information from speculation. Yes Bank entered a moratorium on March 5, 2020. For families like ours, a banking crisis became a question of paying bills and protecting savings. Reserve Bank of India Years later, I recognized the same fear in the United States. Silicon Valley Bank lost more than $40 billion in deposits on March 9, 2023. The Federal Reserve described coordinated withdrawals among connected investors and technology companies, fueled by social media. Federal Reserve Months earlier, customers withdrew around $6 billion from FTX within 72 hours, according to an internal message reviewed by Reuters. FTX operated globally, with consequences reaching American customers too. Reuters These institutions faced different financial problems. Across each crisis, customers faced uncertainty about access to their money, while information spread faster than teams managed their response. My father’s experience gave our project a personal purpose. We wanted financial companies to examine how customers might react before a crisis escalates. We built Macrospective to simulate how a rumor spreads, how people respond, and how different company responses affect outcomes. Teams compare scenarios, examine regional reactions, and identify early signals of financial pressure. Our goal is to help teams make better decisions while families still have time to make theirs.
What it does
Financial companies face a specific problem when misinformation spreads. A claim about a failed audit, restricted withdrawals or missing funds gives customers a reason to move their money before anyone establishes the facts. Banks, fintech platforms and cryptocurrency exchanges face financial consequences from these decisions, even when the original claim lacks evidence. Withdrawals reduce available cash, transfers move funds to competitors, and public posts encourage further customers to act. For listed companies, falling investor confidence also creates pressure on share prices.
The message alone does not determine the outcome. The identity of the person sharing the claim, their audience, their credibility and their decision to withdraw all influence how others respond. A private forward from a worried customer creates a different situation from a finance creator publicly transferring their entire balance. Customers also respond differently according to their trust in the company, financial exposure, anxiety and awareness of deposit protection. The company’s deposits, cash buffer and insured share influence how much pressure the business withstands as concern spreads.
Public responses introduce another source of uncertainty. A denial reassures some customers while raising doubts among others, especially when the wording lacks supporting evidence. A withdrawal guarantee depends on financial capacity and public credibility. Direct outreach reaches a different audience from a press statement, while confirmation from regulators introduces a separate source of authority. Timing matters because a response issued before a widely shared withdrawal post faces different conditions from the same response issued several hours later.
Companies launching campaigns face a related challenge. Teams choose a message, audience and release strategy before observing how people interpret and share the campaign. Audience sentiment, geography, social connections and competing messages influence the result. Across both campaigns and rumours, companies need a way to examine how public reactions develop and compare possible actions before committing to a response.
Macrospective addresses this problem through a contagion simulator for companies. A bank treasurer, communications lead or fintech founder enters either a rumour, such as “Kaveri Digital Bank is capping withdrawals after a failed audit,” or a campaign intended for public distribution. The user adds company figures, including deposits, available cash and the insured share of deposits. These inputs connect the social simulation to the company’s financial position, giving customer actions a measurable consequence.
Users also upload their customer locations to reflect the company’s geographic footprint. The input accepts a simple numbered list, such as “1. Bangalore, Karnataka, 2. Mountain View, California.” Claude assigns each location to a world region so the simulation follows the company’s customer distribution. This grounds regional activity in the supplied customer list and helps users examine where concern spreads and where financial pressure develops.
Claude first reads the message and company context, then builds the simulated population. The population includes retail depositors, finance creators with audiences reaching 600,000 followers, journalists, regulators, rival banks and the company itself. Each agent receives a region, biography, balance and behavioural characteristics, including anxiety, herd instinct, trust and time spent online. These differences give agents distinct reasons to believe a message, question a claim, share a post or move funds.
Claude also prepares realistic responses for the company to test. Options include a public denial, a withdrawal guarantee, confirmation involving regulators and the press, and direct customer outreach. Each response includes the proposed wording, starting hour and target regions. The simulation therefore tests specific actions with defined messages and timing, giving users a concrete basis for comparison.
Macrospective runs five to ten complete simulations, with seven as the default. Each simulation represents a separate future built through a full OASIS social-network run. Agents read feeds, publish posts, reply, repost, quote and like content. Their financial actions include withdrawing funds, transferring money to a rival bank and depositing money. These actions use demo money and connect the spread of information to changes in the simulated company’s financial position.
Every proposed response runs inside every simulation, alongside a baseline where the company takes no action. The response branches begin from the same seed within each simulation, providing a consistent starting point for comparison. This structure helps users examine how a response changes a particular future and how the same response performs across different futures. The system presents a small set of complete runs whose events users inspect directly.
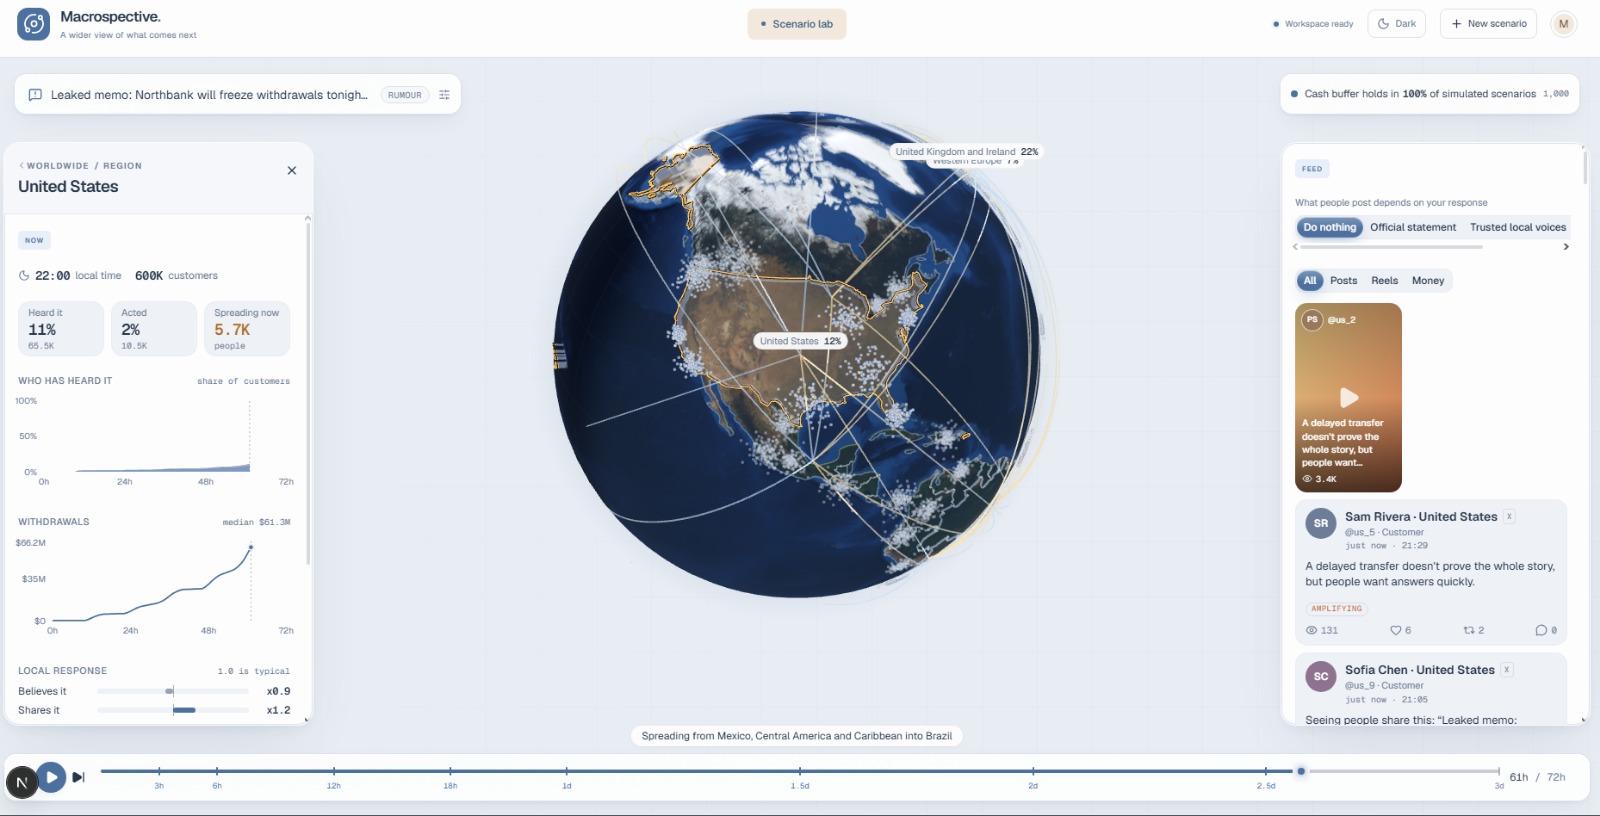
An interactive globe plays back each simulation hour by hour. Regional heat shows how activity spreads, while a live feed displays the agents’ posts. A moving day and night boundary follows the simulated clock. Users pause playback, scrub through the timeline and jump to checkpoints, connecting regional changes with the conversations and financial actions occurring at the same time.
Each simulation also identifies a lynchpin, the event presented as decisive in shaping the outcome. In one completed run, @fatima_hyd_eats, a creator with 185,000 followers, transferred her full balance to Harbour Bank at hour 11 and posted about the move. Her public action turned a forwarded claim into a visible withdrawal event. In another run, @devmehra_money, with 640,000 followers, publicly moved his money and withdrew $5,000 at hour 21. These examples show users the specific people, posts and transactions associated with a change in the simulation.
Every lynchpin includes a counterfactual explanation describing how the simulated outcome would differ without the event. A “Jump to hour” link moves the globe to the relevant moment for inspection. Rather than reducing the results to a statement such as “cash runs out in 80% of scenarios,” Macrospective shows the seven futures completed, the events shaping each future and the explanation attached to those events.
A separate AI judge reads the simulations, their lynchpins and the company context. The judge assigns external confidence to each simulation, expressing its assessment of how plausible the future appears in real life. The judge also assigns internal confidence to every response within every simulation, expressing its assessment of whether the response suits the conditions of that particular future. These two scores separate the plausibility of a path from the suitability of an action along the path.
Users switch between two judging modes. Mode A, bare, supplies the simulation data with a direct instruction to score the likelihood of the particular simulation happening in real life. Mode B supplies the same data alongside a weighted rubric. The simulation rubric examines base rates against real bank runs, lynchpin plausibility, fit with company fundamentals, realism of agent behaviour, robustness and fragility. The response rubric examines feasibility, credibility, fit with the lynchpin, backfire risk and precedent. The toggle exposes how the judge’s assessment changes when explicit evaluation criteria guide the scoring.
Macrospective then combines the confidence scores with the severity points each response saves against the no-action baseline. For every response, the calculation multiplies each simulation’s external confidence by the response’s internal confidence and its severity gain in the simulation. The system adds these products across simulations and divides the total by the sum of external confidence scores.
For example, a response supported at 56% confidence within a simulation assigned 78% external confidence receives a combined confidence weight of approximately 0.44. Another response supported at 80% confidence within a simulation assigned 70% external confidence receives a weight of 0.56. With equal severity gains, the second combination contributes more to the expected-benefit calculation. The full comparison also accounts for how much severity each response saves across all completed simulations.
A final decider uses a rubric to select the recommended action. The decider considers expected benefit, robustness across futures, downside if the choice proves wrong, feasibility, agreement between the judging approaches and reversibility. This step gives weight to responses performing consistently across different conditions and to the consequences of choosing poorly. The output includes a selected response, a runner-up, the decider’s confidence, a plain-language reason and an observable signal for switching to the runner-up.
The “What to do” view presents the decision, while “What this means” expands each response into wording, timing, channel and target regions. Users receive an executable communications proposal tied to the simulation results. The switching signal also gives the team a condition to monitor as events develop, connecting the initial recommendation to a possible change in course.
Claude builds a wider action plan around the selected response. The plan covers hedging, liquidity, funding lines, customer retention, operations, legal matters, regulators, partners and monitoring. Every action includes an owner, practical steps and a trigger. This connects the public message with the financial and operational work supporting the response, including responsibilities outside the communications team.
The bank ledger connects the selected response’s withdrawals to Capital One Nessie demo accounts. The system mirrors the withdrawals into those accounts and reads the resulting information through Chalk online features, displaying cash left, drawdown and stress by region. Users therefore inspect both the social events driving the run and the corresponding demo-account effects. An integrated Factory Droid analyst, available through “Ask Droid,” answers follow-up questions about the run.
Macrospective gives a treasurer or crisis team a rehearsal of the next 72 hours within minutes, before the rumour reaches a wider audience. The team sees the completed futures, the specific post, financial action or absence of a response associated with each turning point, and the judge’s assessment of each path. The resulting recommendation combines expected benefit with robustness, downside, feasibility and reversibility, then provides the message, supporting actions and observable condition for changing course.
How we built it
Macrospective uses Next.js 16 with the App Router, Turbopack and React 19 for the frontend. TypeScript supports the application logic, Tailwind CSS v4 handles styling, and shadcn and Radix provide interface components. A script applies the selected dark or light theme before the first paint, preventing a flash of the wrong theme during loading. The globe uses react-globe.gl and three.js. Light mode displays NASA satellite daylight imagery, while dark mode displays night lights. A day and night boundary follows the simulated hour, and transparent regional heat overlays show how activity develops across the world. Country boundaries come from world-atlas and topojson-client. Recharts supplies the charts and loads after the first simulated hour arrives, keeping chart code outside the initial page load. The interface applies a Liquid Glass material to the heads-up display controls. SVG displacement creates a lensing effect, while a cursor-lit rim and specular highlight respond to pointer movement. Data stays on solid cards to preserve readability. Zod defines the contract between the interface and the simulation engine. Both sides validate progress messages, simulation starts, hourly frames and completion events against shared schemas. The engine streams these events as newline-delimited JSON, or NDJSON, allowing the globe to begin playback while the engine continues simulating later hours. The engine has three layers: a world model, OASIS social simulations and a population model. The world model uses Claude Sonnet 5.5 and Haiku 5.5 to profile the company, assess regional believability and shareability, write hostile variations of the rumour and prepare company responses. The model also creates the agents, assigning followers, financial stakes and behavioural leanings. All world-model calls use messages.parse with Zod-derived JSON schemas for structured outputs. The schema restores enumerated values for valid region, post and strategy identifiers, restricting references to identifiers present in the run. This keeps model outputs consistent with the records the application uses for playback and analysis. Each storyline runs through a Python service built with camel-oasis 0.2.5, camel-ai and FastAPI. OASIS runs the social simulation, with Haiku driving agent decisions. Each agent has a bank account and tools for withdrawing funds, transferring money to a named rival and depositing funds. The service introduces the company response at its assigned start hour and adds scripted rumour twists on schedule. As the simulation progresses, the service streams rounds of posts, likes and money movements. The simulation uses a non-uniform schedule of rounds. Early hours receive closely spaced rounds, while later hours use wider intervals. OASIS_EARLY_ROUND_HOURS and OASIS_LATE_ROUNDS control this schedule. The change reduced the runtime for a 72-hour simulation from roughly seven minutes to under five minutes while retaining more frequent interactions during the early stages. A TypeScript population model translates the small agent population’s behaviour into regional outcomes at a larger scale. Each region tracks five compartments: unaware, heard the message, acted quietly, spreading and stopped. A mixing matrix connects regions, while hourly activity curves account for local time. These inputs represent both cross-region spread and differences in audience activity throughout the day. Each storyline produces a social pulse from recent posts and financial actions. Positive and negative post weights combine with pressure from money movements to influence the population model. Every storyline drives its own slice of simulation draws, and the engine reads each slice separately. This preserves a distinct result for every simulated future. The engine expresses severity on a scale from 0 to 100. The calculation assigns 40 points of weight to failure probability, 25 to median withdrawals relative to the cash buffer, 15 to worst-decile withdrawals relative to the buffer, 10 to the speed of the run and 10 to second-order effects. These second-order effects include inflows to rivals, lost customers and the level of alarm remaining in posts at the end. The score combines financial pressure, the pace of withdrawals and continuing customer concern. Daytona provides a separate sandbox for each storyline. Every sandbox starts from a snapshot whose name includes a hash of the OASIS service source. A source change produces a different snapshot name, preventing the system from silently reusing an outdated service image. Seven sandboxes run seven futures in parallel, keeping elapsed time close to the runtime of one future. The system divides LLM concurrency and rate-limit capacity across the sandboxes. Lynchpin analysis starts with a calculation rather than a model call. For each simulation, the engine identifies the tipping hour as the hour with the steepest increase in median withdrawals. The engine then gathers the most-viewed posts up to the tipping hour, every post from the preceding six hours, the largest money movements and the recorded events. Haiku reviews this evidence and selects the decisive event, with a requirement to cite a real post identifier. This connects the explanation to an inspectable record from the simulation. The confidence judges and final decider use Sonnet 5.5 through the /api/confidence endpoint. The bare judge and rubric judge run in parallel. Pure TypeScript code calculates the confidence-weighted evidence, with unit tests covering the weighting logic. The final decider then reviews the combined evidence and produces the decision. The system caches these results once per run and rate-limits the confidence workflow. Capital One Nessie supplies regional demo accounts for the banking integration. Withdrawal records carry a tag in the form macrospective::, making repeated submissions idempotent and preventing duplicate posting of the same withdrawals. A Python resolver deployed through chalk apply converts Nessie balances into Chalk online features for remaining cash, drawdown and stress. Factory Droid supports follow-up analysis through droid exec. The analyst runs with read-only access in a scratch folder containing the simulation as run.json. Follow-up questions resume the existing session, preserving the analytical context across questions. The testing setup includes a scripted agent brain and a fake storyline service, allowing npm test to exercise the complete stream offline. These tests check shared-schema validity, post and reply integrity, a company taking no action in the baseline and one lynchpin per storyline. Separate unit tests cover confidence weighting. A backtest harness replays 13 historical bank and cryptocurrency platform crises: SVB, Signature, First Republic, Northern Rock, FTX, IndyMac, WaMu, Wachovia, Bank of East Asia, PacWest, Continental Illinois, Celsius and Metro Bank. The cases sit across fit, holdout and blind sets, separating cases used for fitting from cases reserved for evaluation. The harness provides a way to examine simulation behaviour against historical events alongside the offline software tests.
Challenges we ran into
Running a full social network for each future created our largest performance and cost challenge. A single 72-hour storyline requires thousands of agent LLM calls. When we expanded from one simulation to seven, the system slowed to roughly 10 simulated hours in 10 minutes. Our shared concurrency cap divided across the sandboxes left each sandbox with only two LLM calls in flight. We rebalanced the concurrency and rate-limit budgets, ran storylines in parallel Daytona sandboxes and introduced closely spaced early rounds with wider intervals later. Each storyline also received a defined budget share to keep spending within the run’s allocation. Sandbox consistency created a separate problem. After a teammate changed the Python service, runs continued using an older snapshot without showing an obvious error. We changed snapshot naming to include a content hash of the service source. Source changes now produce a different snapshot name, linking each sandbox image to the corresponding service code. Python dependency compatibility required careful version control. Our camel-ai 0.2.78 setup broke with mcp versions 1.13 and above and pydantic versions 2.12 and above. We addressed the conflicts with a fully pinned Linux lockfile and a CPU-only torch build, giving the sandboxes a consistent dependency set. Model-generated references also needed constraints. LLMs sometimes returned invented identifiers, leaving citations without a matching post, agent, region or strategy. We generated strict JSON schemas with enums containing only valid identifiers from the current run. This restricted model references to existing records and kept citations connected to evidence users inspect. Changing the statistical model required work inside the engine. The original implementation pooled thousands of draws into aggregate statements such as “X% of scenarios.” Presenting each storyline separately required a median withdrawal curve and a spreading curve for every storyline, response plan and simulated hour. We added this tracking inside the numeric loop so each future retained its own results throughout the calculation. Rendering introduced problems across the WebGL globe, glass lensing and backdrop-filter effects. Filters or opacity animations on an ancestor of a glass layer prevented the layer from sampling the globe behind the interface. We had to account for these interactions when composing the visual layers. Some three-globe layers also pulled WebGPU and h3 into the bundle, so we stubbed those dependencies out. Integrating a teammate’s redesigned interface with the updated engine produced 13 merge conflicts because the two versions had diverged. We rebuilt the port by hand on top of main, connecting the redesigned interface to the current engine. The Nessie integration exposed a persistent API issue. Posting a withdrawal without a status field permanently broke the affected account’s withdrawal list. This made the status field a required part of our withdrawal payloads.
Accomplishments that we're proud of
We built a working pipeline from a single sentence to seven complete multi-agent social simulations. Each simulation produces its own outcome, lynchpin and results for every response. The judges assess the futures and responses, then the decider selects an action and states an observable condition for switching strategies. In one measured run, seven simulations covering 24 hours took 236 seconds and cost $0.38 in model spend. Judging and deciding required another 40 seconds. The lynchpin explanations connect each outcome to specific evidence from the simulated feed. They name the account, follower count and hour associated with the decisive event, giving users a concrete explanation to inspect. A linked playback control moves the globe directly to the relevant moment. We also exposed a substantial difference between the two judging approaches. On the same run, the bare judge assigned every simulation a likelihood of 12–15%, while the rubric judge assigned 70–80% and supplied a written assessment for each criterion. Displaying both assessments side by side shows how strongly evaluation instructions influence the scores and gives users access to the reasoning behind the rubric-based assessment. The final decision considered performance across individual futures, including the downside of choosing poorly. In this run, the decider selected the withdrawal guarantee with 80% confidence. The guarantee improved outcomes in all seven simulations and performed best in five, including the two the judge rated most likely. Even its weakest result showed a positive benefit. The runner-up, regulator and press confirmation, backfired in two simulations. The decider also reduced the guarantee’s assessment because reversing the commitment would be difficult. We backtested the system against 13 historical crises across fit, holdout and blind sets. The simulation correctly classified failure outcomes for SVB, Signature, Washington Mutual, PacWest, Northern Rock, First Republic and Metro Bank. Some withdrawal estimates approached the historical figures. For Northern Rock, the simulation estimated 3.8% withdrawn within 24 hours, compared with 3.3% in reality. For PacWest, the estimate reached 8.7% by hour 52, compared with 9.5%. The pipeline also works with uploaded company data. A customer list reshapes the simulation’s regional distribution, connecting the simulated population to the company’s supplied footprint. Financial actions reach the Nessie banking API through demo accounts, and the system reads the resulting balances back as features for cash, drawdown and stress. The globe presents these results through satellite imagery, night lights, a day and night boundary tied to the simulated hour, regional heat spreading during playback and a live social feed. The interface also works on a phone, allowing users to inspect the simulation and its supporting evidence across screen sizes.
What we learned
We learned to treat LLM-based agent simulation as a separate engineering discipline. OASIS supplies a social network where agents recommend content, follow accounts and repost messages. Producing useful behaviour required us to design temperaments, banking tools, response injection and round schedules. Our focus shifted from generating individual replies to coordinating a population whose conversations and financial decisions influence one another. Working with seven explained futures also changed how we presented results. Each future gives users a sequence of events, an outcome and a specific turning point to inspect. This provides a clearer basis for assessing the simulation than an aggregate statement such as “80% of 10,000 draws.” Individual storylines also expose model mistakes, including implausible decisions or weak explanations hidden within pooled statistics. The confidence experiments showed how strongly evaluation instructions affect an LLM’s assessment. The bare judge and rubric judge produced scores around 13% and 75% on the same evidence. This gap taught us to give confidence scores explicit criteria and inspect the reasoning behind them. A rubric makes the assessment easier to examine, although a higher score alone does not establish greater accuracy. We also learned to separate a future’s assessed likelihood from confidence in a response within the future. A plausible future does not automatically support a particular action, and a suitable response for one future does not establish how likely the future appears. Multiplying the two scores gives each response a contribution reflecting both assessments. Combining this weight with the severity saved supports comparison across the completed simulations. Daytona introduced a new approach to parallel execution for our team. We launched heavy Python agent workloads from a Next.js route into disposable sandboxes, with each sandbox tied to a content hash of the service source. Running futures independently also required us to divide LLM concurrency, rate limits and spending across the sandboxes. Parallel execution depended on managing shared resources as carefully as the individual workloads. Strict structured outputs became another engineering lesson. We generated JSON-schema enums for each request using the valid post, agent, region and strategy identifiers from the run. Schema enforcement and validation restricted accepted references to existing records, preventing invented identifiers from reaching the interface as unresolved citations. Backtesting showed where the social model performed well and where further work belongs. We separated historical cases into fit, holdout and blind sets, then compared simulated outcomes with recorded events. The model performed better on first-day withdrawals at mid-size banks. Multi-week withdrawal patterns, including IndyMac and Washington Mutual, proved harder to reproduce, as did the rapid cryptocurrency withdrawals during FTX’s collapse. These differences helped us distinguish short-term withdrawal modelling from the separate challenges of prolonged deterioration and faster crypto-market behaviour.
What's next for Macrospective
Our next priority is calibration. The repository contains roughly 60 historical case folders, providing a broader basis for fitting the population model and evaluating the judges’ confidence scores. We plan to use the fit cases for adjustments and reserve blind cases for evaluation with Brier scores, which measure the difference between predicted probabilities and observed outcomes. The goal is to establish whether a rubric score such as 78% corresponds to a reliable probability.
We also plan to address the model’s known weaknesses. FTX-style cryptocurrency runs develop faster than our current withdrawal model allows, so these cases need faster withdrawal dynamics. IndyMac and Washington Mutual present a different challenge, with withdrawals continuing over weeks. Modelling these events requires a longer simulation horizon and declining attention over time. Live signal ingestion would connect simulations to events as they develop. We plan to seed runs with incoming public posts and repeat the analysis as new evidence arrives. The decider’s existing switching condition would then support an alert when observed activity meets the stated threshold. We want to evaluate the wider action plan inside the simulations. Public responses already receive comparisons across storylines, while hedging, liquidity and outreach actions form part of the supporting plan. Adding these actions to the simulated futures would help assess their effects alongside the communications response.
Larger agent populations form another development goal. We aim to support thousands of agents per storyline through prompt caching, batching and smaller models for background accounts. This work would expand the simulated population while controlling model costs and runtime. We also plan to extend the system to insurers, stablecoins, money-market funds and brands facing product-safety rumours. Each firm type needs assumptions suited to its financial structure and customer behaviour. Campaign mode already supports the opposite objective, examining the spread of a message the company wants audiences to share.
For teams, we plan to add saved scenarios, shareable runs and a tabletop-exercise mode for crisis drills. These features would help colleagues review the same evidence, compare decisions and practise their response before a live incident.
Built With
- anthropic-claude
- camel-ai
- capital-one-nessie
- chalk
- daytona
- factory-droid
- fastapi
- next.js
- node.js
- oasis
- pydantic
- python
- radix-ui
- react
- react-globe.gl
- recharts
- shadcn-ui
- tailwind-css
- three.js
- topojson
- typescript
- uvicorn
- world-atlas
- zod


Log in or sign up for Devpost to join the conversation.