MacroPaths
Inspiration
When people talk about inflation, they usually mean one number: "CPI came in at 3.2 % this month." But nobody's budget is hurt by one month. A delivery business is hurt when fuel stays above budget for nineteen months. A tenant with a CPI-indexed lease is hurt when inflation compounds for years. The damage is in the path, not the endpoint.
Two existing ideas inspired us:
- Weather degree-day futures (CME) settle on accumulated temperature above a threshold. That is a path statistic, and farmers and utilities have hedged with them for decades.
- On-chain CPI feeds (e.g. Frax's FPI) already put the CPI level on a blockchain.
No one combines the two and settles a payout on the inflation path, on-chain and at small size, for anyone with a wallet. We wanted to see whether that could be built honestly in a weekend: a payout that is exact, reproducible from public data, and with its worst case known before anyone pays in.
What it does
MacroPaths is a Solana program plus a web app.
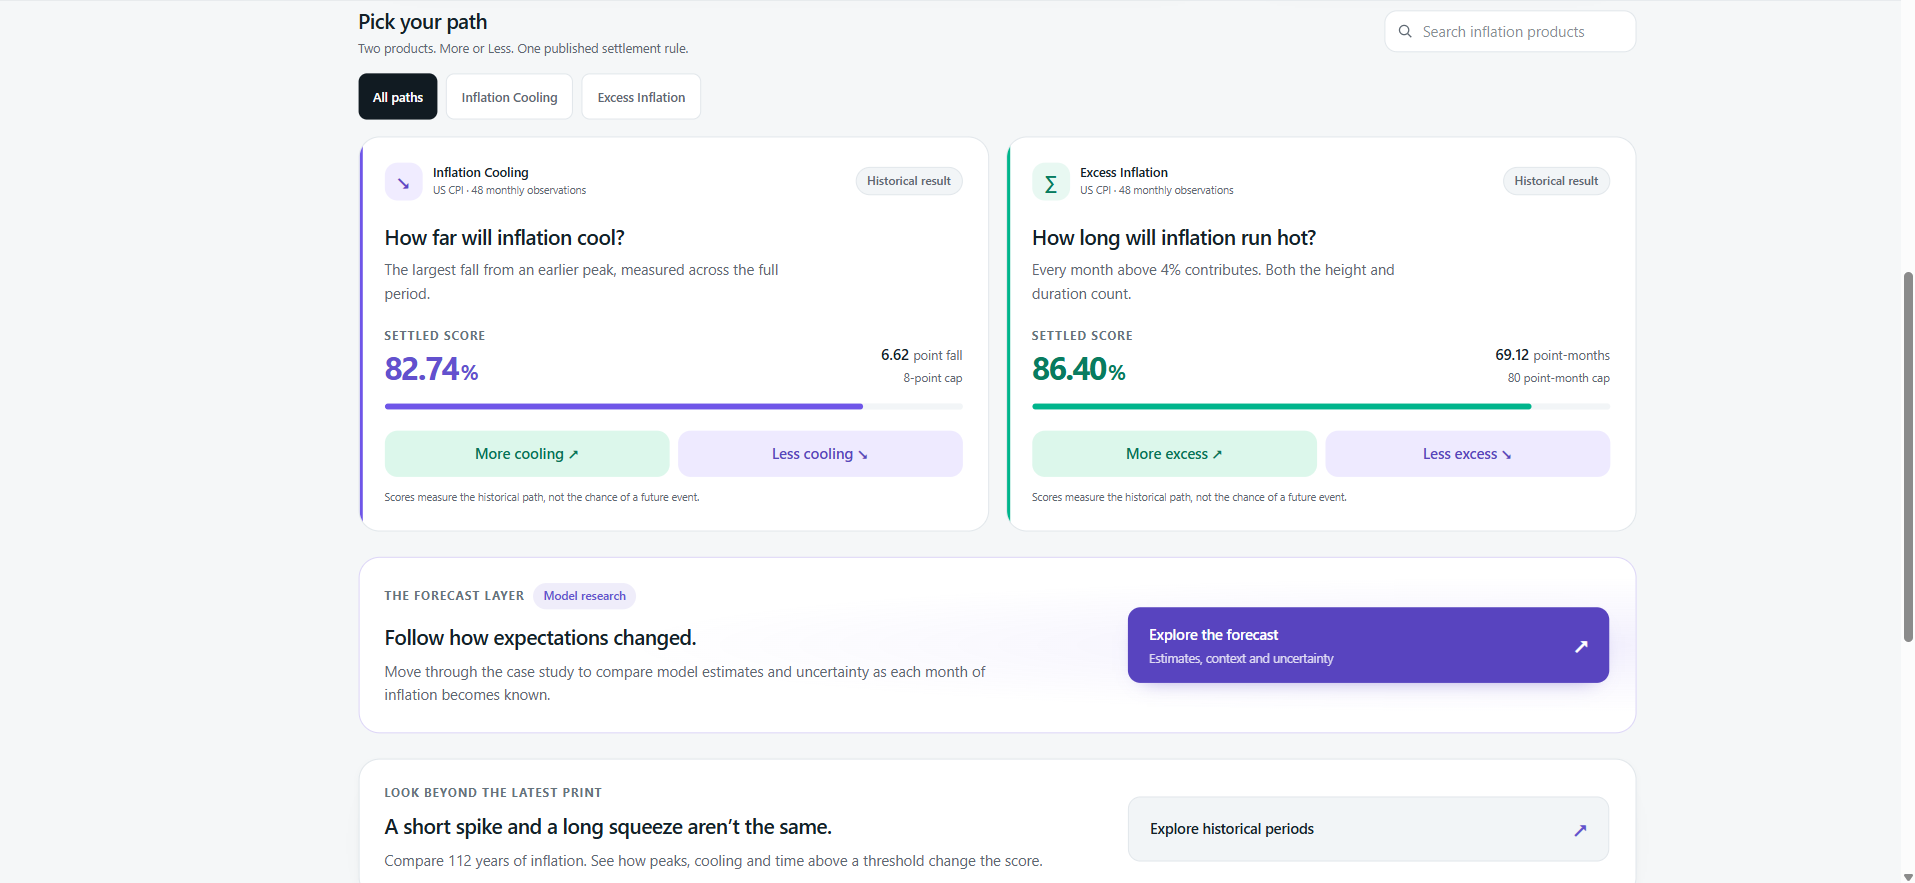
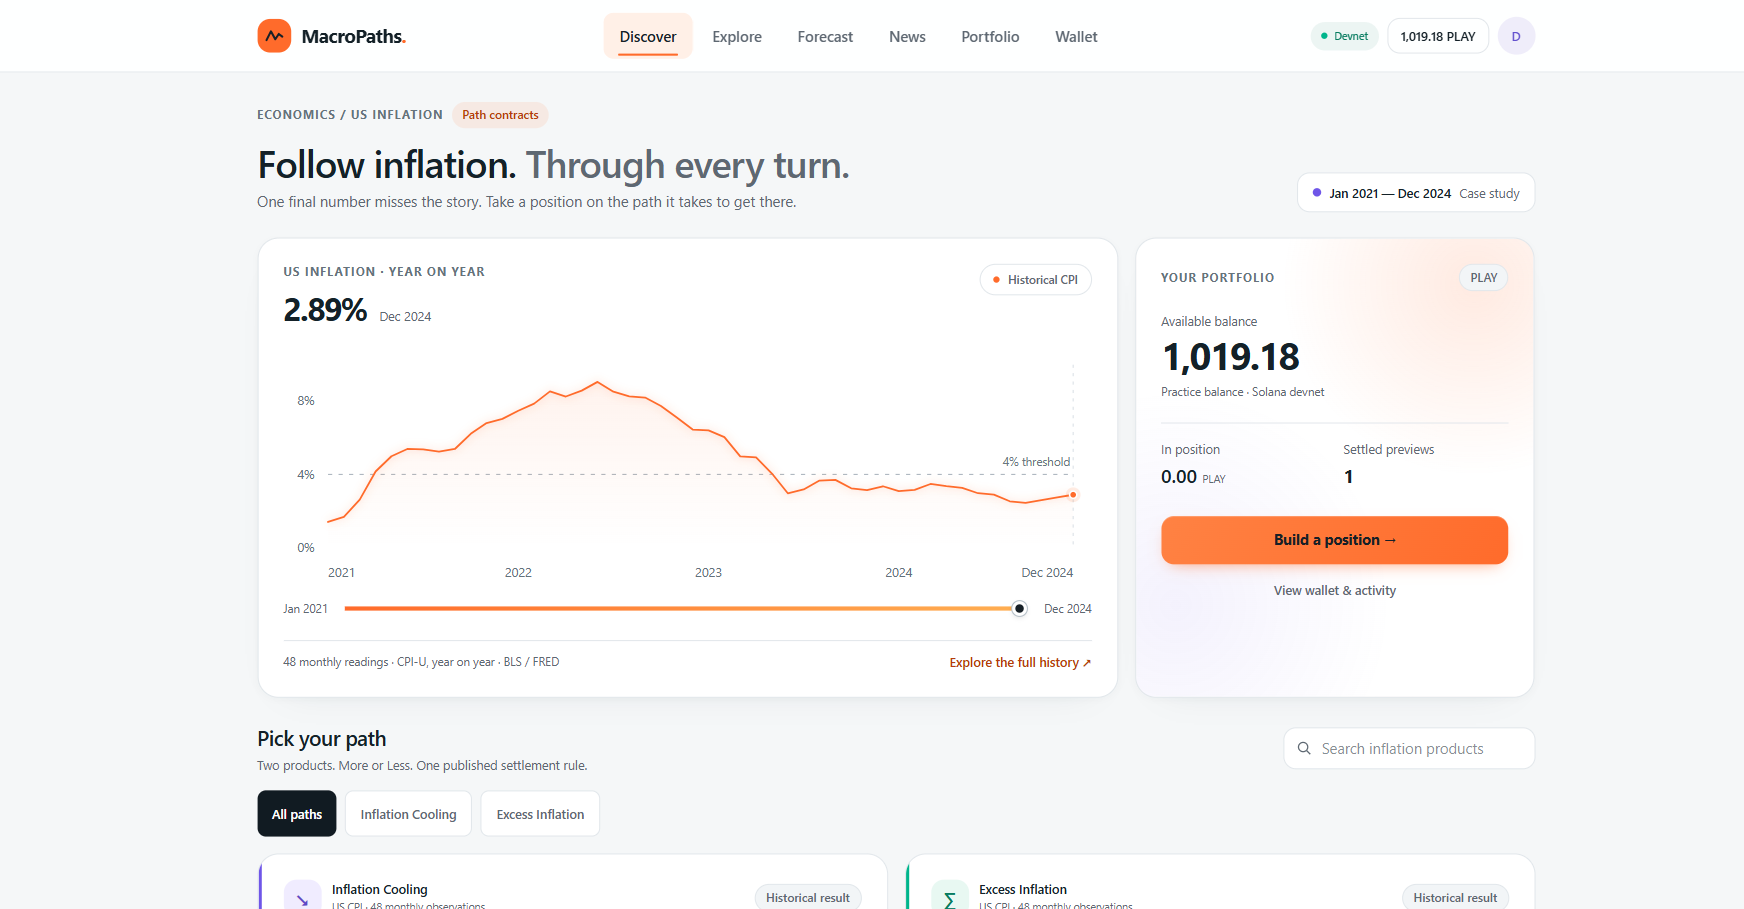
- A session replays 48 monthly observations of a public series (US CPI-U year-on-year, Jan 2021 – Dec 2024) into the program.
- Each month the program updates a path statistic in $O(1)$ with integer arithmetic:
- Inflation Cooling, the largest decline from a running peak: $$M_t = \max(M_{t-1}, x_t), \qquad D_t = \max(D_{t-1},\, M_t - x_t)$$
- Excess Inflation, how long and how far inflation stayed above $K = 4\%$: $$A_t = A_{t-1} + \max(x_t - K,\, 0)$$
- At settlement each statistic becomes a score in millionths: $$s = \left\lfloor \frac{\min(\text{stat}, \text{cap}) \cdot 10^6}{\text{cap}} \right\rfloor \in [0, 10^6]$$
- Cover pays $\lfloor s \cdot \text{units} / 10^6 \rfloor$. The buyer pays $\lceil p \cdot \text{units} / 10^6 \rceil$ at the seller's posted quote $p$, and the seller funds the rest. The worst case of the contract is known up front.
A planner sits on top. A business enters its monthly fuel exposure and a protection budget. The planner tests 21 choices against every four-year window of history since 1990 and says what to buy, how much, and what would still be uncovered.
How we built it
1. A commitment chain so the replay can't be altered
Before a session opens, the full data path is committed with a reverse SHA-256 hash chain:
$$\text{dataset_id} = H(\texttt{"PATH-DATASET-v1"} \,|\, \text{series} \,|\, \text{url} \,|\, \text{window} \,|\, \text{levels} \,|\, K \,|\, D_{\text{cap}} \,|\, A_{\text{cap}})$$
$$C_i = H(\texttt{"PATH-OBS-v1"} \,|\, \text{dataset_id} \,|\, i \,|\, \text{period}i \,|\, x_i \,|\, C{i+1})$$
The program accepts observation $i$ only if it hashes to the stored $C_i$, so the keeper cannot alter, skip or reorder a row. The same chain is implemented three times, in Python, TypeScript and Rust, and all three must agree byte for byte.
2. The program (Rust, Anchor 1.0.2)
We split the program into about 15 narrowly scoped tasks, each on its own branch: create session, deposit, lock/expire, observe, settle, claim/sweep, seller accounts, cover, security review, keeper bridge. Every task merged with LiteSVM tests: 117 passing at the deployed commit. Every token amount is u64/i64 with checked_* operations and u128 intermediates, and every division floors. We deployed to devnet and ran reference session A end to end: create, lock, 48 observes, settle. Its final scores are 827387 (Cooling) and 863980 (Excess).
3. Research: caps, forecast and price
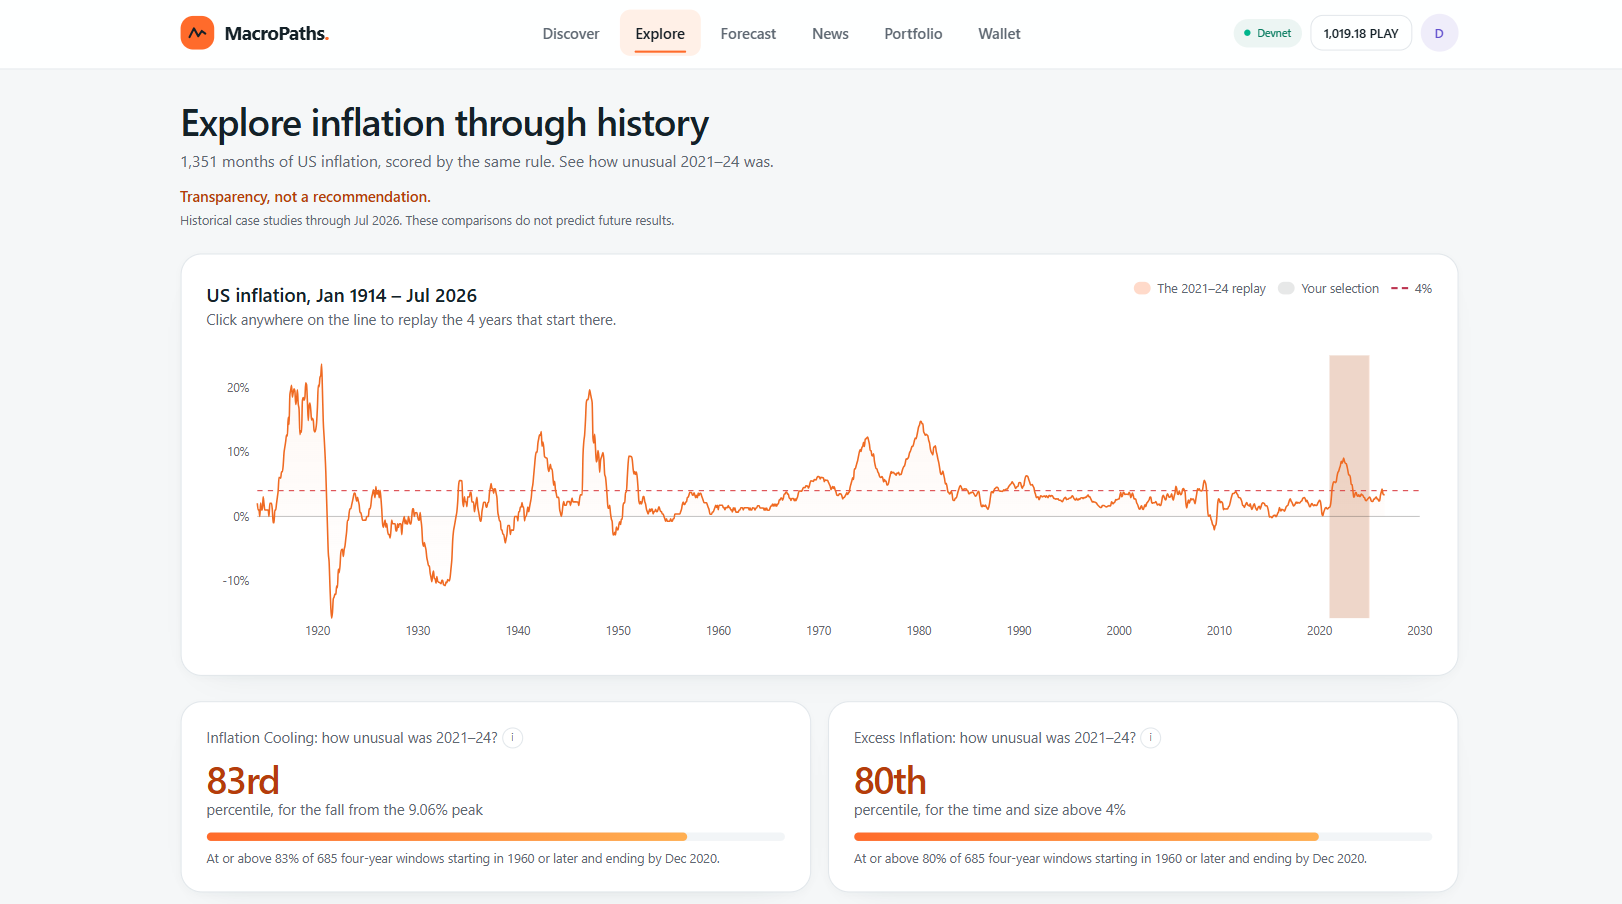
- Caps are a declared rule, not a fitted number. Each cap is the nearest-rank 90th percentile of its statistic over every 48-month window from 1960 to 2020 (gasoline from 1990).
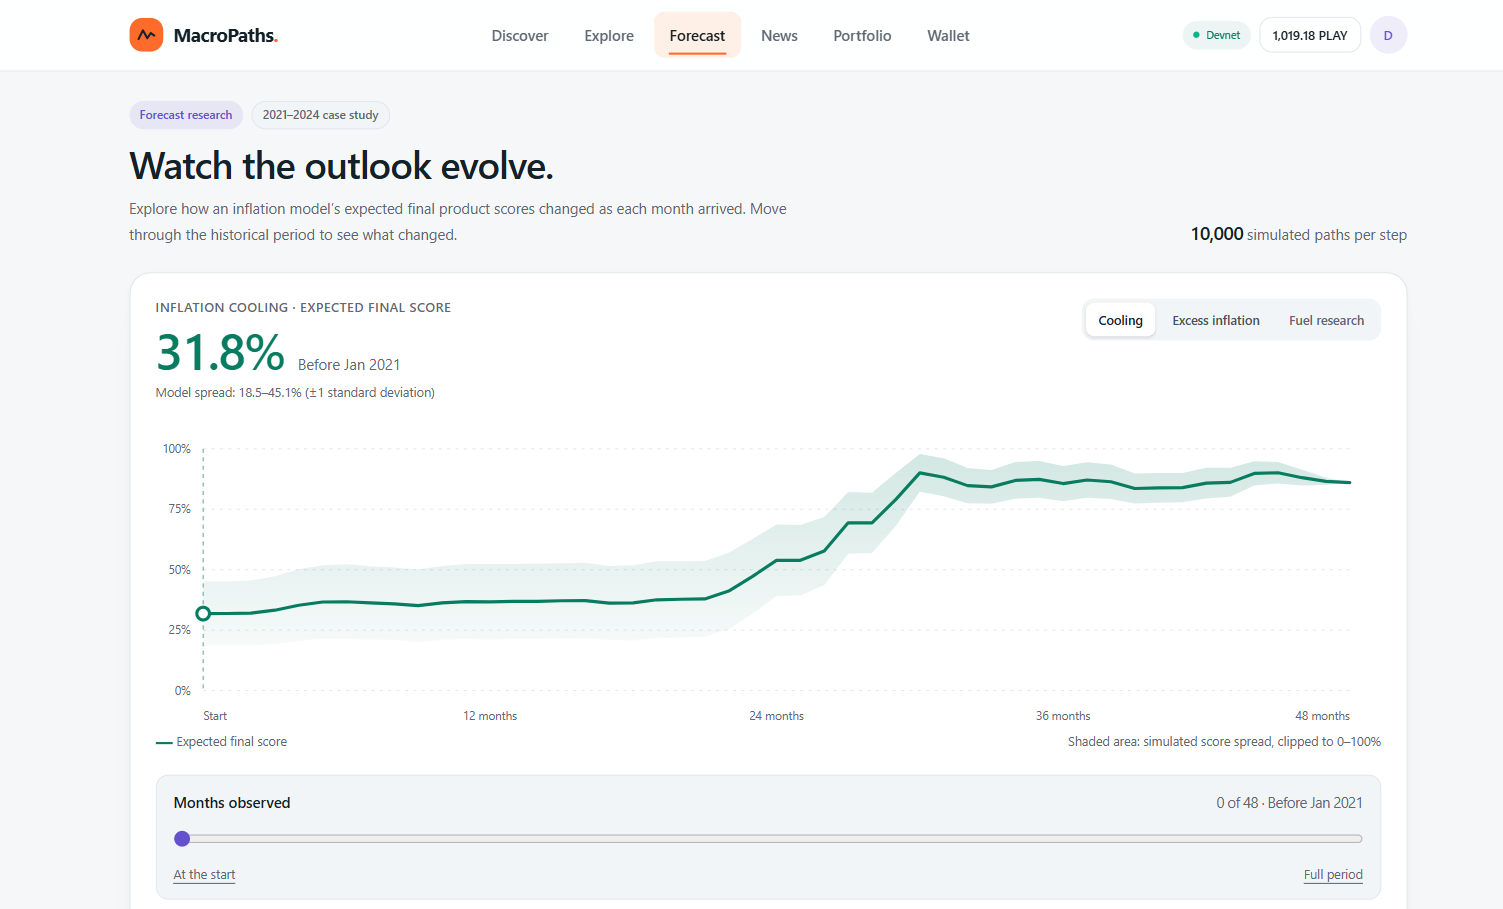
- Forecast. We fit an AR(1) model $x_{t+1} = a + b\,x_t + \varepsilon$ by OLS. We simulate 10 000 integer paths and run each through the same integer recursions as the chain, which gives an expected score $V_0$ and its spread $\sigma_0$. A random-walk benchmark is reported beside it.
- Price. The seller's quote is $$p = \operatorname{clamp}!\left(V_0 + \tfrac12\sigma_0,\; 0.05,\; 0.95\right)$$ The forecast is advisory only. Settlement always uses the realised path.
4. The decision model (the planner)
For each historical window $k$, with exposure $q$ gallons/month, budget price $G = \$3.50$, budget $B$, stake $c$ and quote $p$:
$$L_k = q \sum_t \max(g_{k,t} - G,\,0), \qquad H_k = \frac{c}{p}\, s_k, \qquad U_k = \max\big(L_k - (B - c) - H_k,\; 0\big)$$
The planner picks the policy with the lowest TailLoss95, the mean of the worst 5 % of shortfalls $U_k$. It also shows the expected cash left at the end, so premium wasted in calm years stays visible.
5. The web app: 15 parallel workers, one orchestrator
For the frontend we wrote a spec pack before writing any code: frozen interfaces, an ownership map and acceptance criteria. Then we ran 15 Claude Code workers in parallel, each in its own git worktree and branch, coordinated by an orchestrator that owned the shared contracts and did all the merging. The pieces were shared zod schemas with bigint-exact math, an RPC transport with retry and rate-limit handling, a Redis-backed transaction-history cache, session and wallet read APIs, a research bundle, a UI kit, glowing path charts, a shell with Phantom/Solflare connection, and four pages (Dashboard, Session, Activity, Products/Planner). A separate "product curator" agent reviewed every screen and asked one question of each element: does this belong here for the user? Its suggestions became the session walkthrough ("how a cover pays out"), the "explain this number" popovers and the labelled threshold band.
What we learned
- Hedge what actually hurts you. On real 2021–24 data, general inflation cover does worse than holding cash for a fuel bill, at every stake. CPI and gasoline didn't move together. Fuel cover tracked the bill. For a van using 100 gal/month with a \$200 budget, cash alone left \$528 uncovered; the recommended fuel cover left \$200.
- Caps are part of the honest story. In 2021–24 fuel cover hit its cap ($s = 1$) and still left about half the overrun uncovered. Showing that before purchase builds trust.
- The 0.5 price trap. A matched pool implies a price of 0.5. With a 90th-percentile cap the 2021–24 Excess score was only 0.367, so a hedger paying 0.5 would have lost money in the worst inflation in forty years. That is why protection is priced by a seller's quote.
- Our own forecast was wrong, and saying so was the point. The AR(1) baseline underestimated 2021–24 on every product. Cover bought at the quote paid out 2.2× to 9.2× per unit staked. The buyer was paying for exactly that error.
- Exactness has to hold end to end. If floats touch a chain value anywhere, one display can disagree with settlement. We kept every on-chain amount as a decimal-integer string through the API, and converted to
numberonly for chart coordinates. - Parallel agents need contracts first. The 15-worker build worked because the shared schemas and ports were frozen before launch, and every interface change went through one checkpoint process.
Challenges
- "Sealed" only applies to a replay. An external adversarial review pointed out that a reverse hash chain can only commit a path that has already happened. We changed our claims: the chain proves the 2021–24 replay is reproducible by anyone. A live contract would post each month from a named attester after the official release, and you would trust the attester, not the hash.
- Messy real data. The October 2025 CPI value is missing from the snapshot. We wrote a data rule (first-published, unrevised values, a Treasury contingency fallback, loud failure on any gap) instead of letting parsers skip it silently. Gasoline is weekly, so we defined a month-mean transform floored to $10^{-4}$ USD, with at least three weekly prints per month.
- Integer overflow and edge cases. Products like $a \cdot P_j$ and $2 \cdot M \cdot s$ can overflow
u64. Everything runs inu128with checked operations, zero caps are rejected, and empty sides cannot lock. - Deadline races and stuck sessions. We fixed lock-versus-deposit races, added
expire_incompleteso a session whose keeper disappears moves to refunds, and fixed a terminal lockup where the last observation had to reach the terminal commitment. - Integration under time pressure. The parallel frontend surfaced classic integration bugs. A React hook module was missing
"use client", which broke every route. A symlinked UI package couldn't resolve React types. The research-bundle hash was computed over CRLF copies on Windows while git stored LF. A production build failed only on the Windows-mounted filesystem. And an old dev server was sitting on the port we kept checking.
What's next
- Executable Fuel cover (v2). Two data rows per session (CPI and gasoline), per-product specs,
observe_v2, and a chain-v2 dataset ID binding both rows. - Transactions in the app. Buy cover straight from the planner's recommendation, then claim and refund, all signed from the wallet.
- Live mode. A forward hash log posted monthly by a named attester, with a fallback and dispute path.
- More products. Diesel Surcharge for trucking fuel surcharges, and Floating-Loan Rate for prime-linked small-business loans.
- A better model. Simulate monthly changes instead of overlapping year-on-year values, use fat-tailed shocks, and publish walk-forward validation beside the random-walk benchmark.


Log in or sign up for Devpost to join the conversation.