-
-
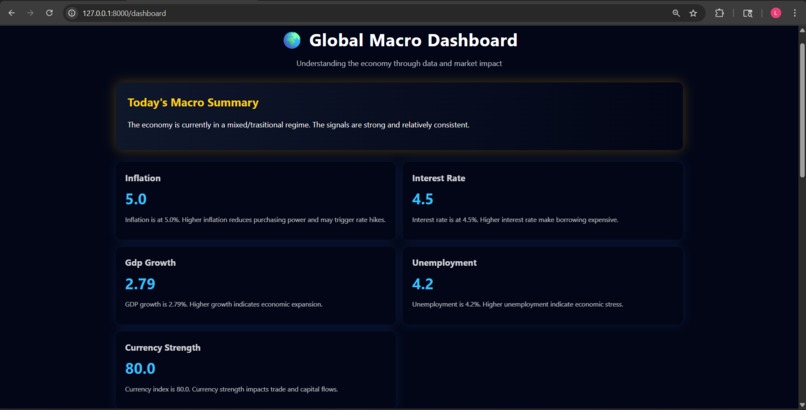
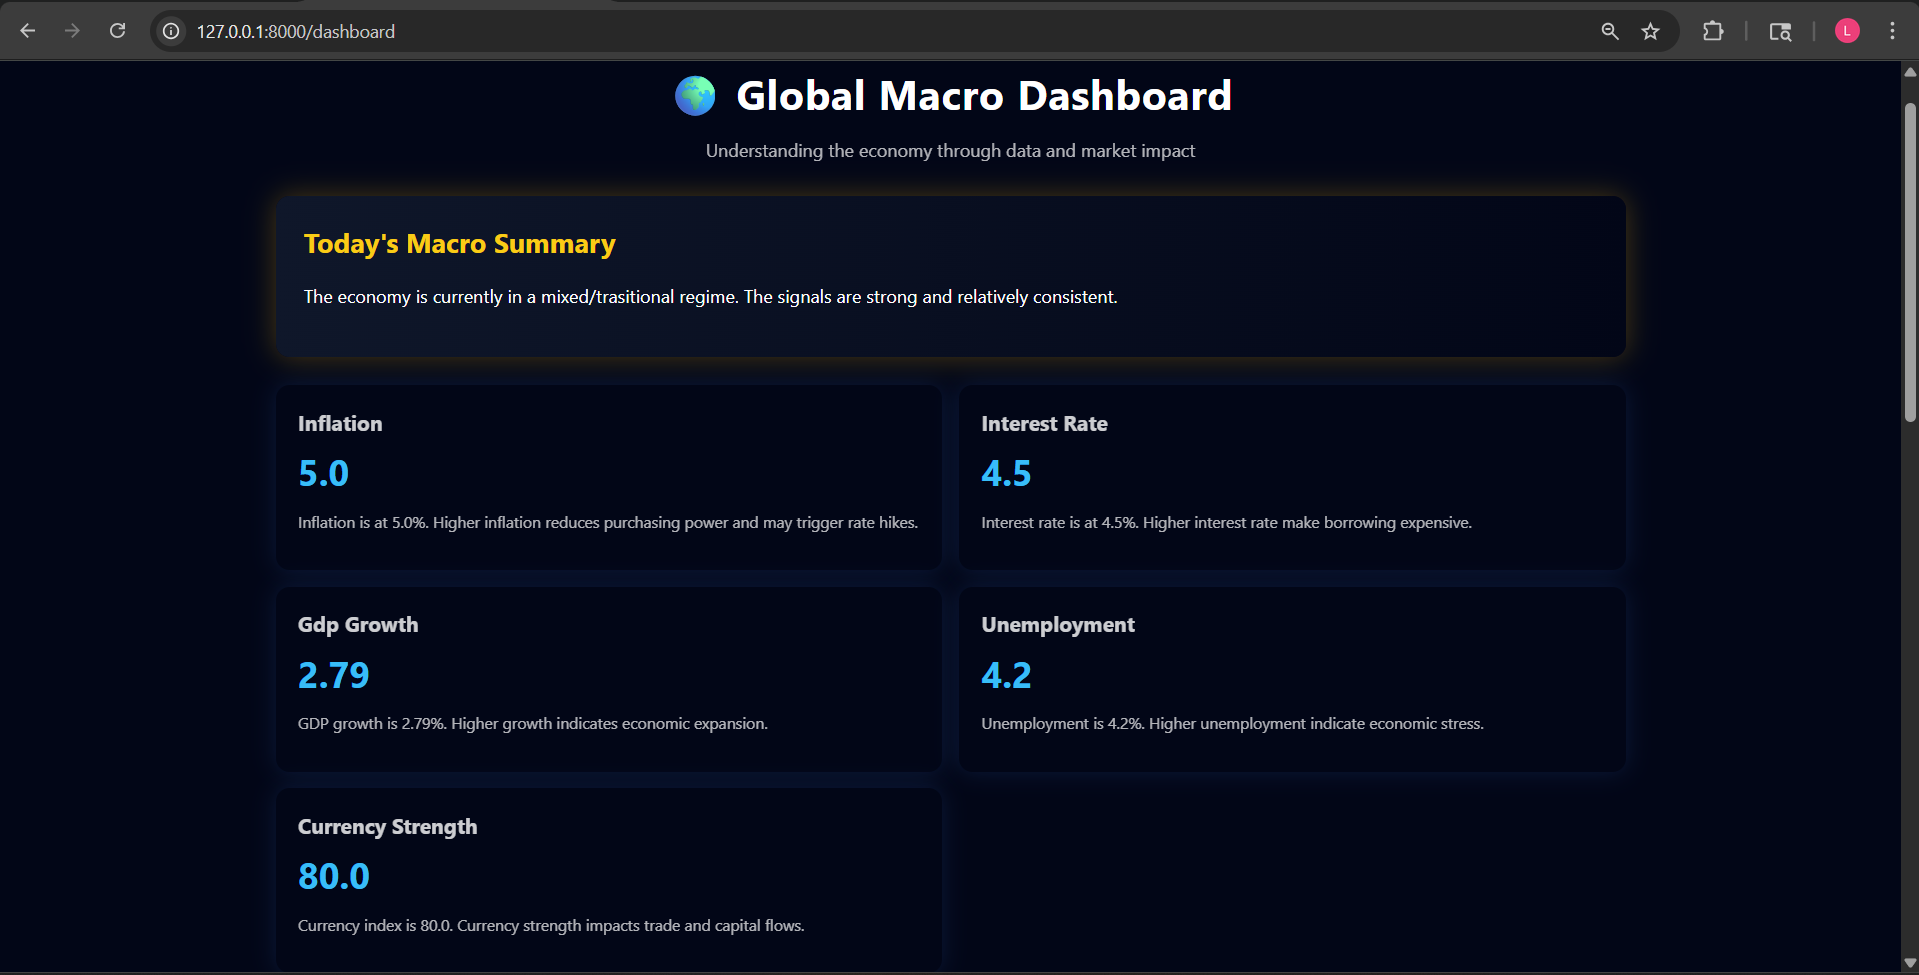
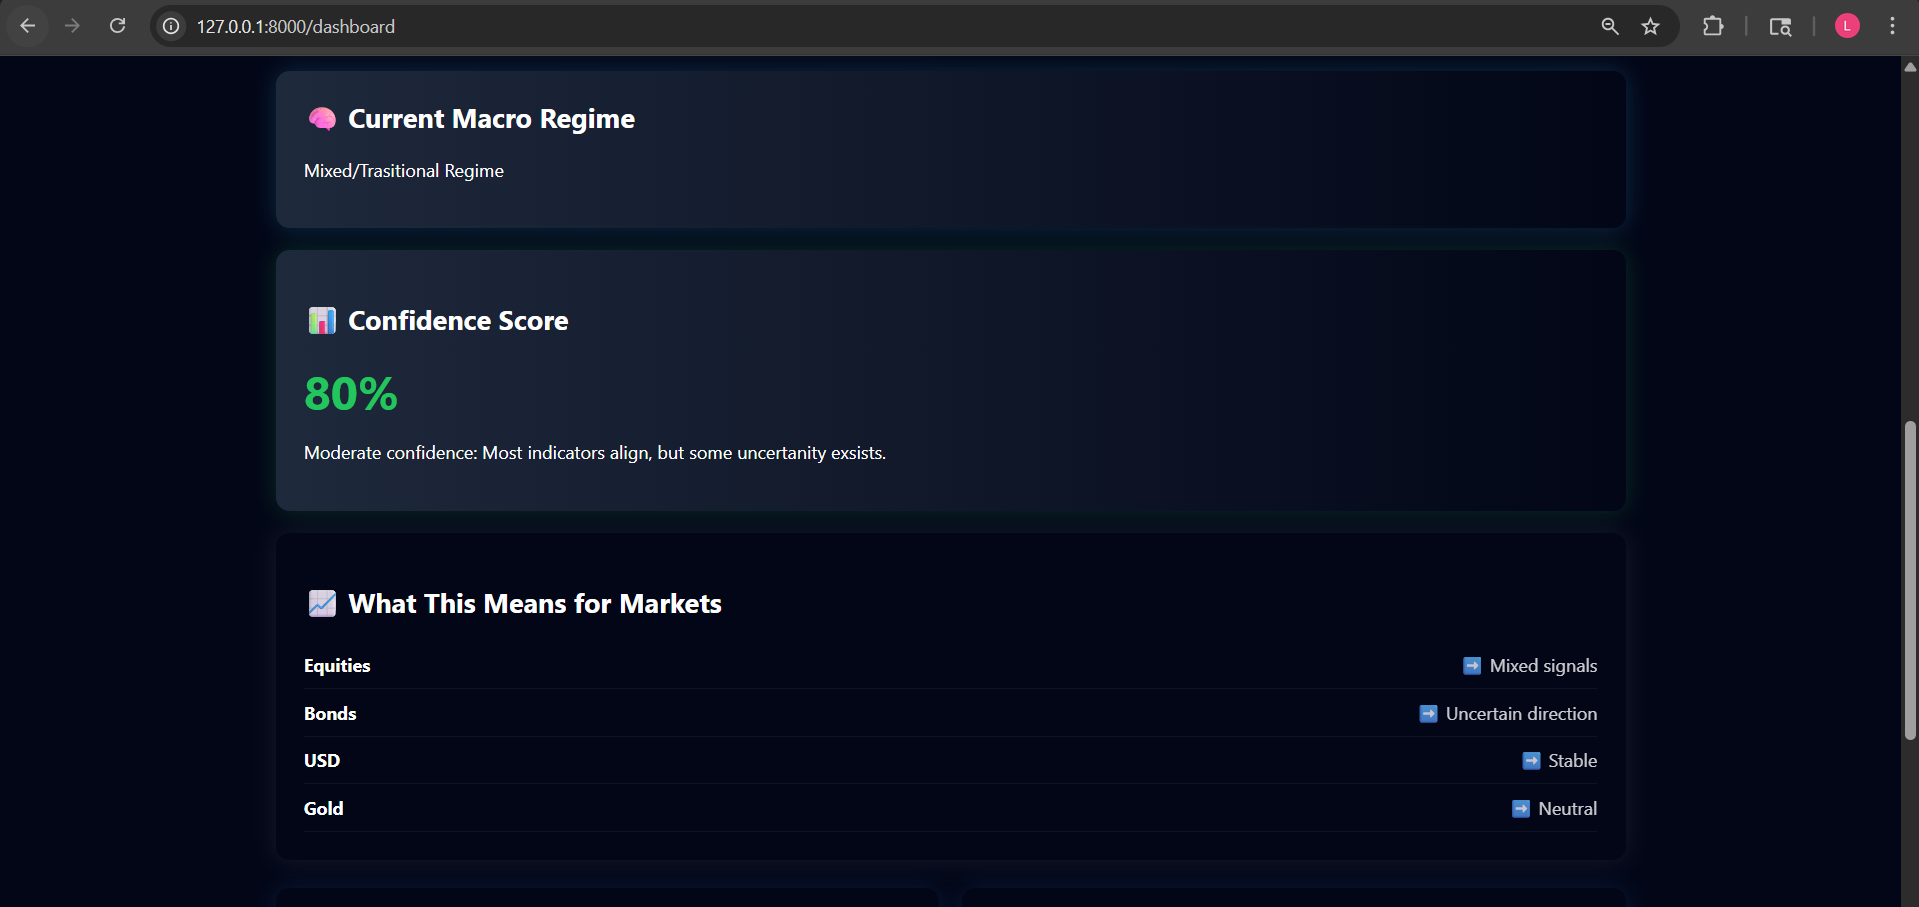
Macro factors and summary
-
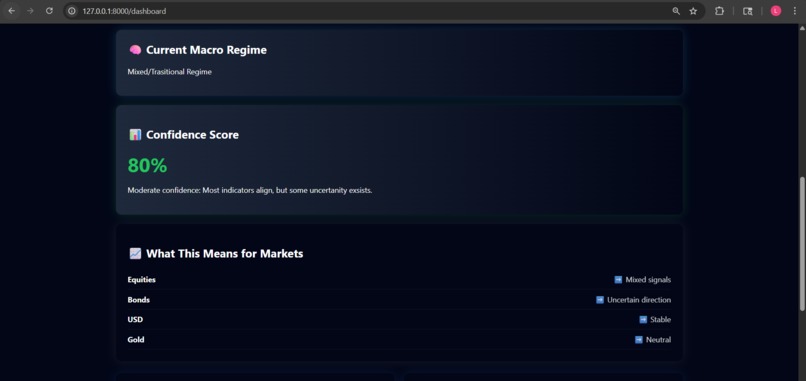
Market Inference
-
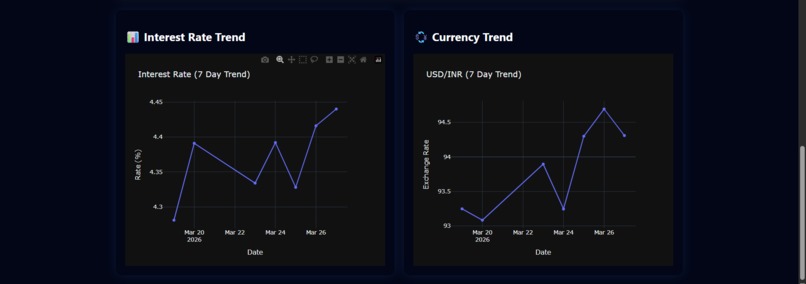
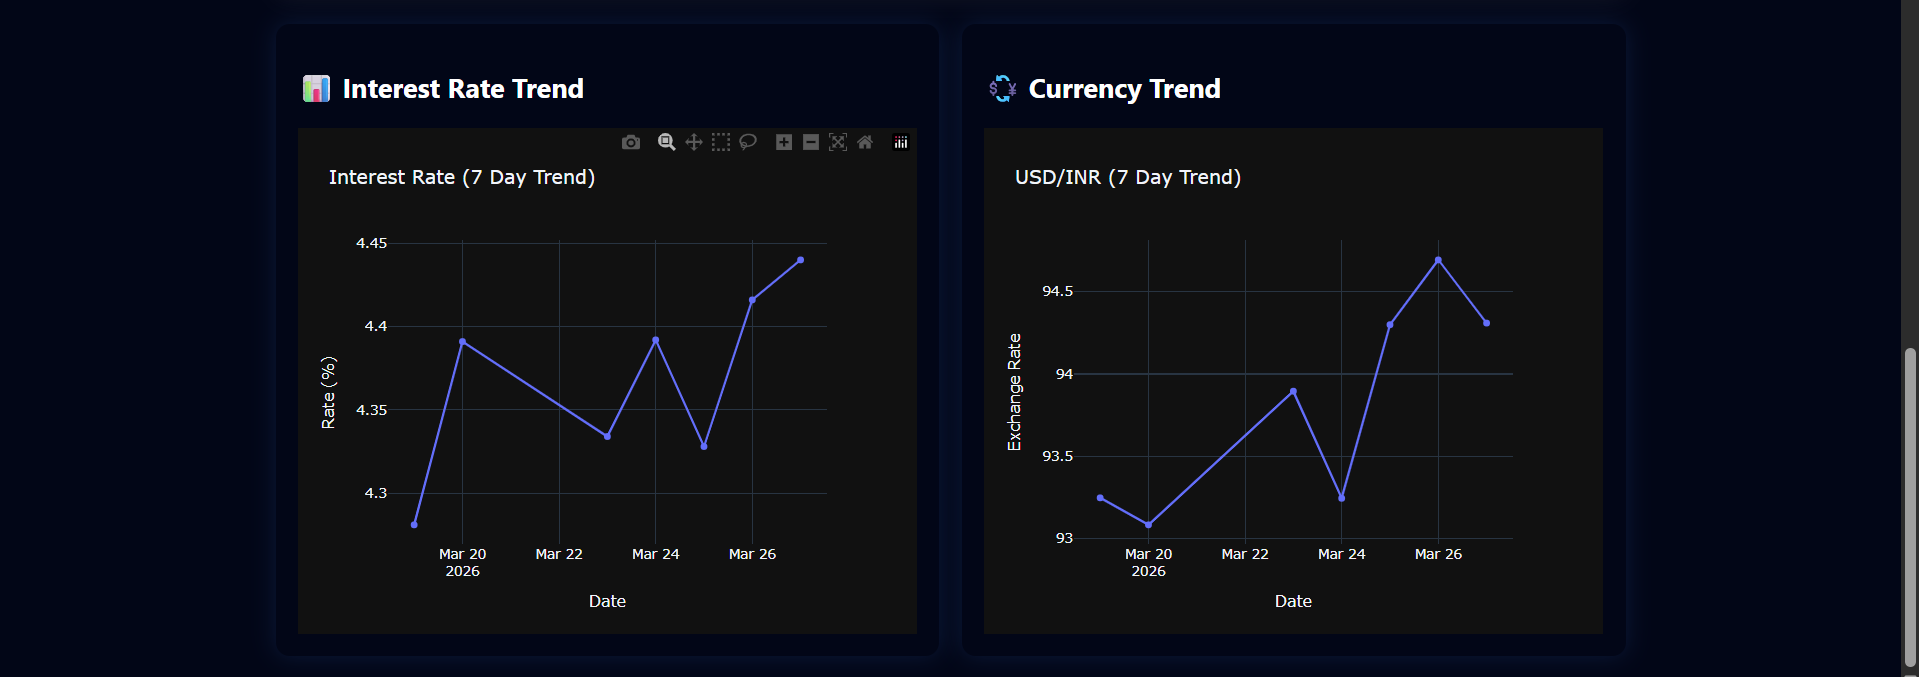
Graphical Inference
Inspiration
Economic data is everywhere—news constantly talks about inflation, interest rates, and GDP. However, most people don’t truly understand what these indicators mean or how they affect financial markets.
This project was inspired by the gap between access to data and actual understanding. The goal was to build a system that not only shows macroeconomic data but also explains its real-world impact in a simple, intuitive way, helping users think like investors.
What it does
The Global Macro Dashboard transforms raw macroeconomic data into meaningful insights:
- Tracks key indicators like inflation, interest rates, GDP, and unemployment
- Detects the current macroeconomic regime (e.g., tight monetary, stimulus, Goldilocks)
- Generates market insights for equities, bonds, currency, and gold
- Provides a confidence score based on multiple indicators
- Displays a “Today’s Macro Summary”—a simple explanation of current conditions
- Visualizes trends using interactive charts
How we built it
- Backend built using FastAPI for efficient API handling
- Frontend developed with HTML, CSS, and Jinja2 templates
- Data collected from:
- yfinance
- Alpha Vantage
- World Bank API
Pipeline:
- Fetch and aggregate macro data
- Normalize and process indicators
- Classify macro regime using rule-based logic
- Generate market insights
- Compute confidence score
- Present results via a clean dashboard with visualizations
Challenges we ran into
- Handling inconsistent data formats from multiple APIs
- Designing logic to translate macro indicators into market insights
- Balancing simplicity vs accuracy in explanations
- Building a UI that is informative but not overwhelming
- Ensuring the system reflects real-world macro reasoning, not just static rules
Accomplishments that we're proud of
- Successfully built a full-stack macroeconomic analysis system
- Converted complex economic data into simple, human-readable insights
- Implemented a macro regime detection system
- Introduced a confidence score to encourage probabilistic thinking
- Created a project that is both educational and practically useful
What we learned
- How macroeconomic indicators interact and influence markets
- Importance of multi-factor analysis instead of relying on single signals
- Building systems that combine data + logic + user experience
- Translating complex concepts into clear, accessible explanations
- Practical experience with APIs, backend systems, and data visualization
What's next for Macro Dashboard
- Add support for multiple countries (India, US, etc.)
- Integrate more indicators (CPI, central bank rates, yield curves)
- Improve regime detection using machine learning models
- Add AI-generated explanations for deeper insights
- Enhance UI/UX for a more interactive and engaging experience

Log in or sign up for Devpost to join the conversation.