Project name: Property Macro Tracker
22 characters
# Property Macro Tracker

## About the Project

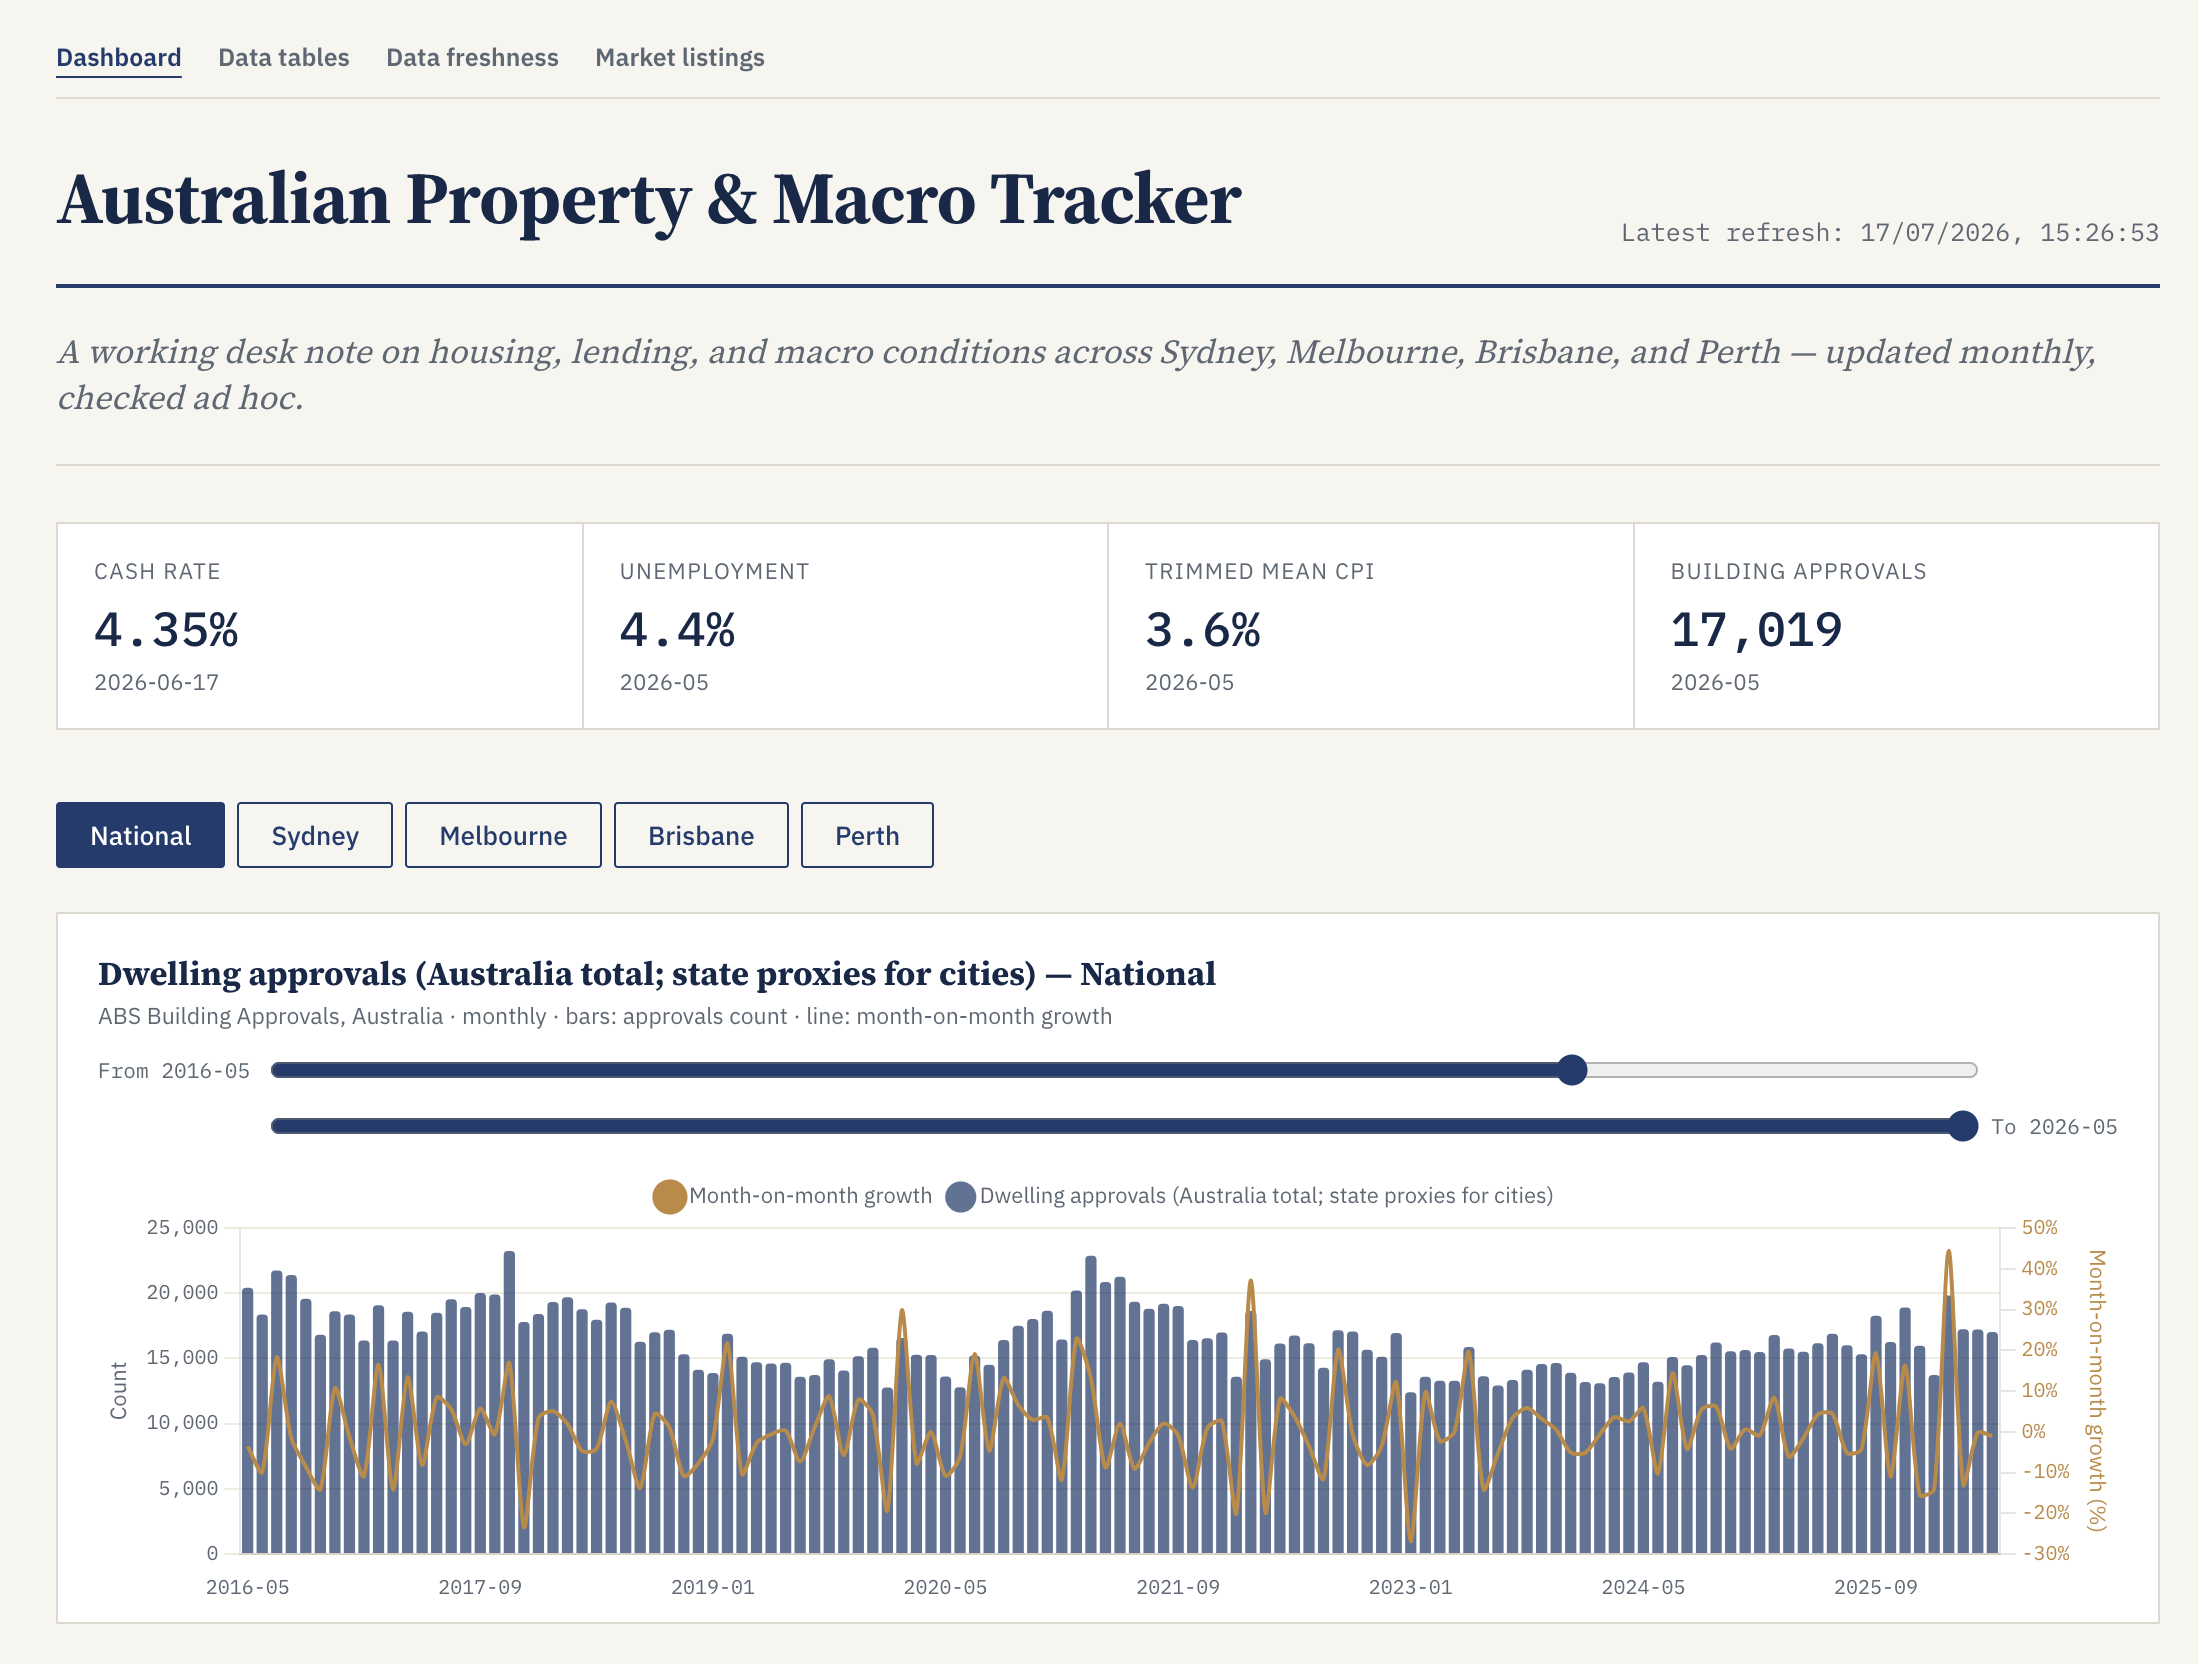
Property Macro Tracker is a research prototype for tracking Australian housing and macroeconomic conditions through a transparent, repeatable data pipeline.

The project was inspired by a simple frustration: housing commentary often depends on scattered charts, changing assumptions, and data points without clear provenance. I wanted to build something that makes the underlying evidence easier to inspect: not just “what is happening?”, but “where did this number come from, when was it updated, and can I trust it?”

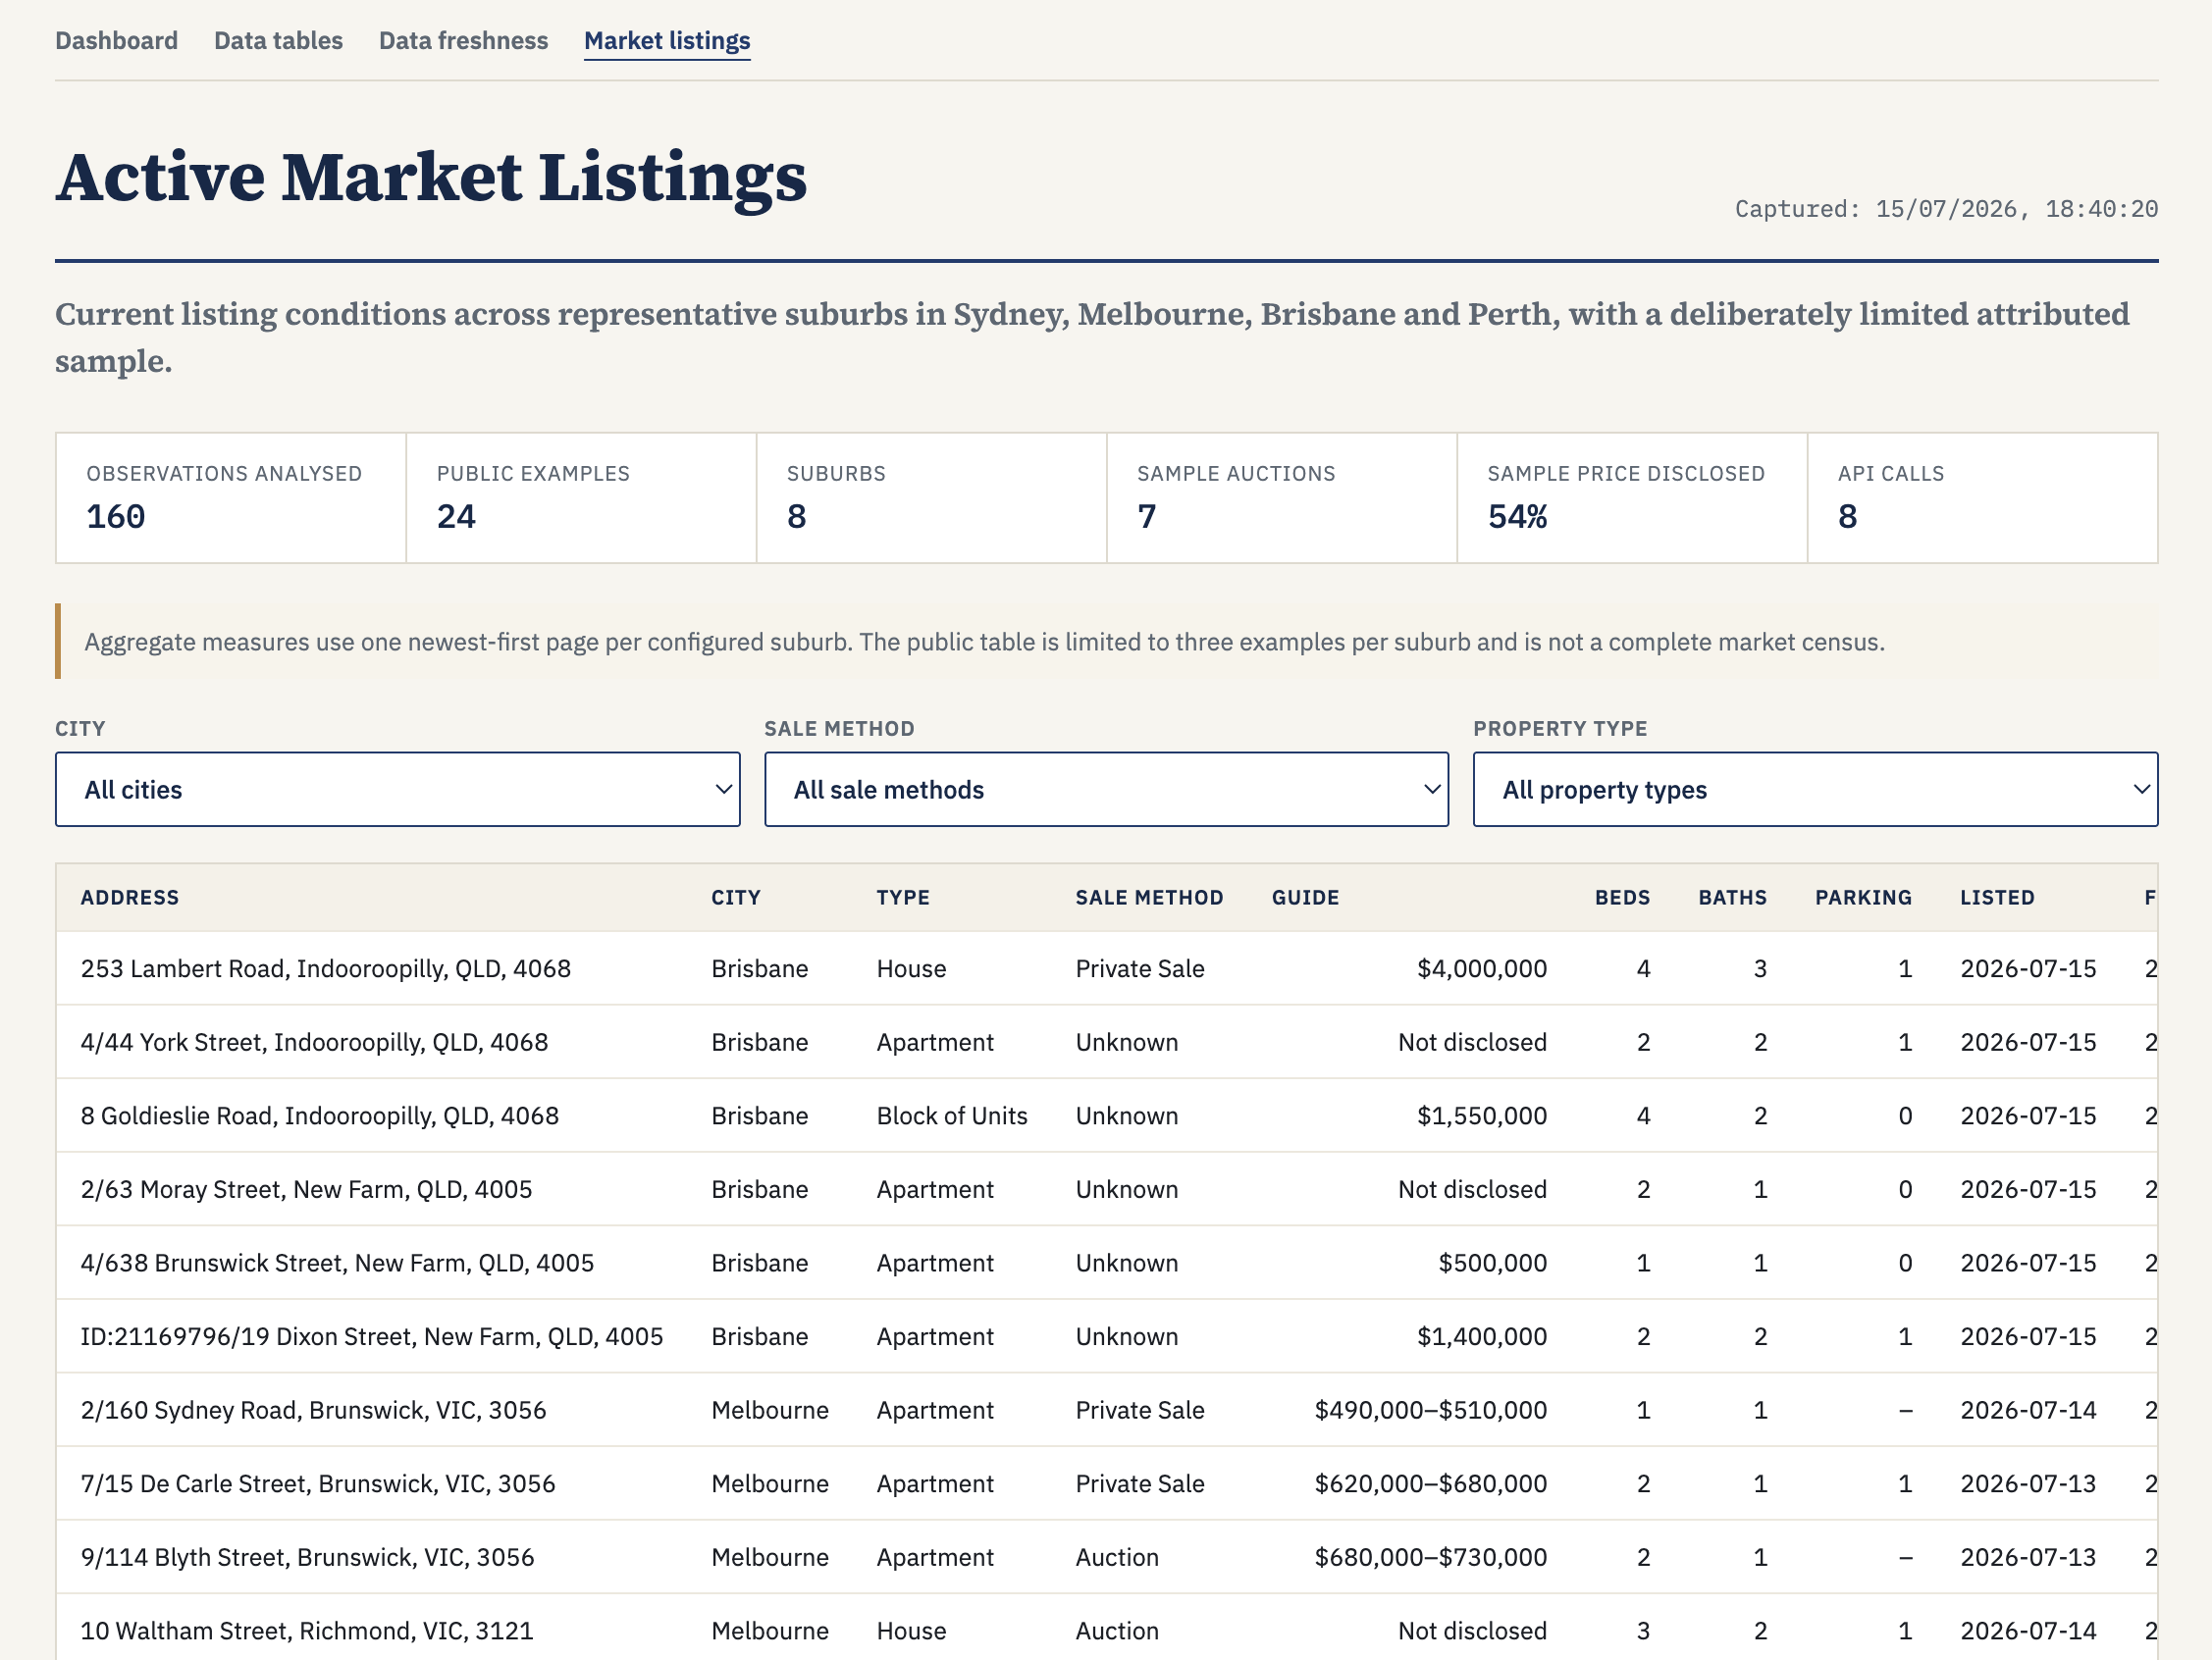
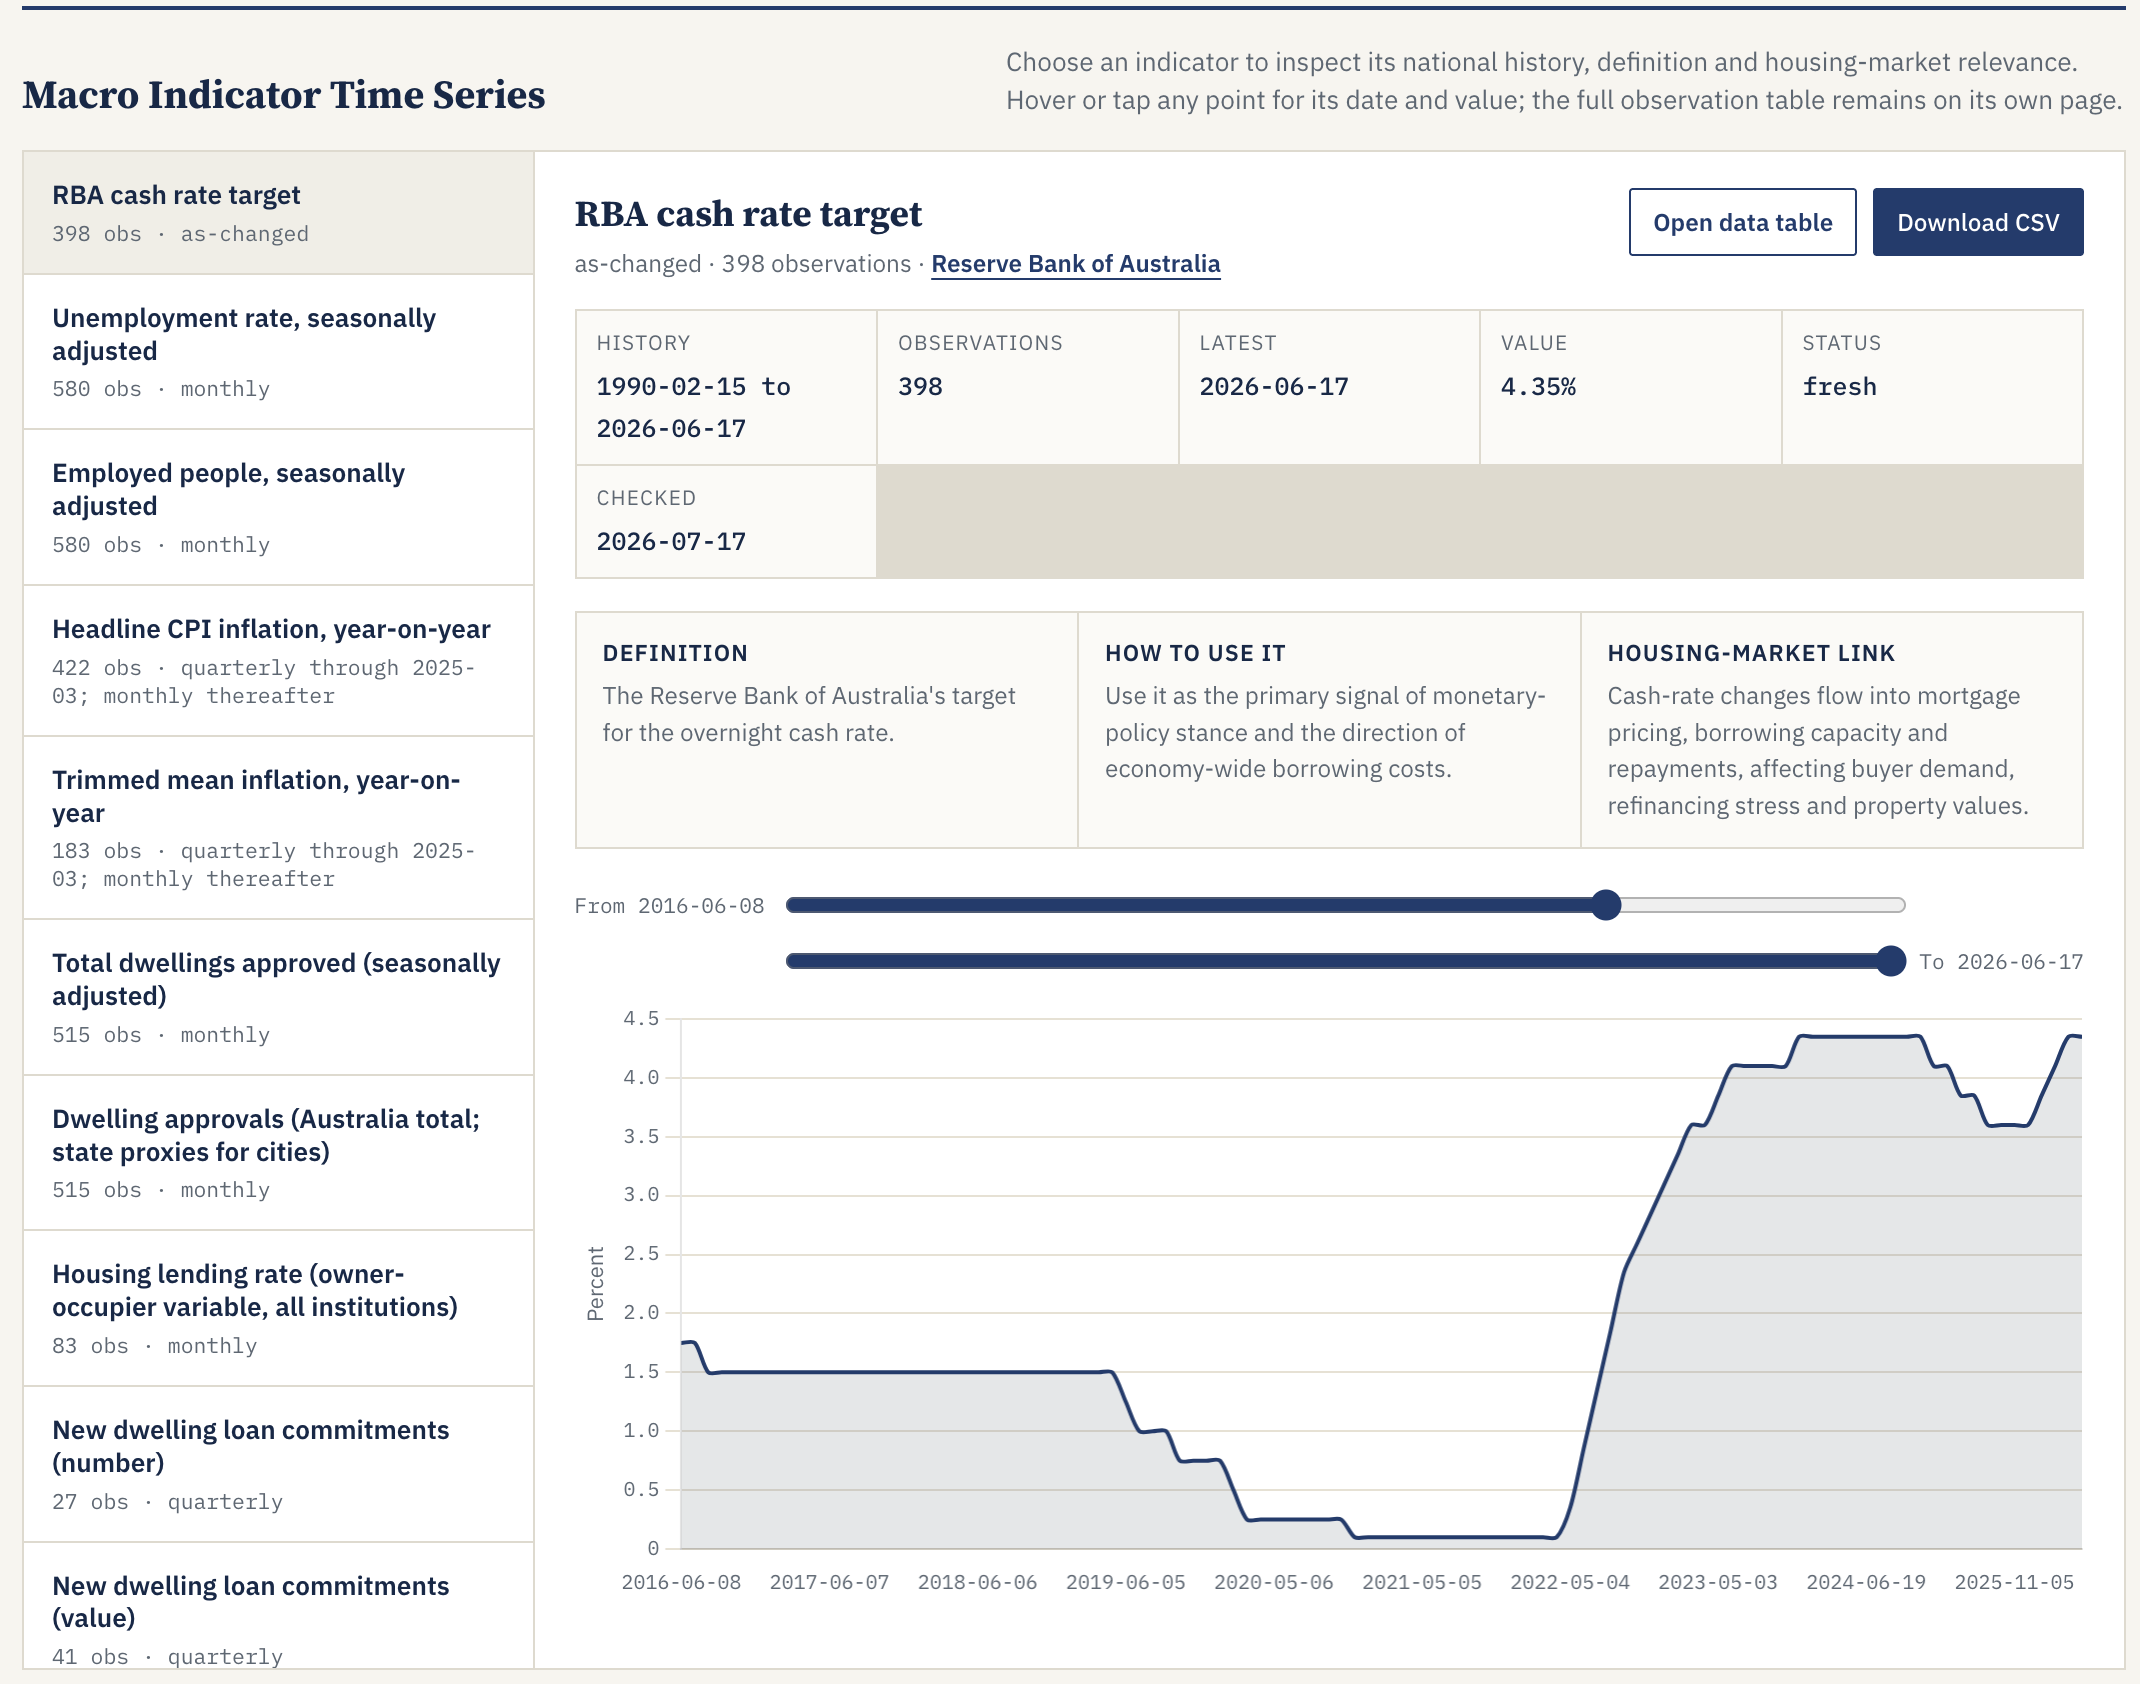
The prototype tracks **24 indicators** across property, credit, labour, inflation, rates, demographics, and broader macro conditions. Each indicator is designed to include source transparency, automated checks, and validation logic so that the system can flag stale, missing, or suspicious values before they are used in analysis.

## How I Built It

The project is built as a data pipeline that collects, normalizes, validates, and presents macro and housing indicators from public Australian data sources.

The core workflow is:

1. Fetch indicator data from source URLs or files.
2. Normalize values into a consistent schema.
3. Run validation checks for freshness, missing values, outliers, and expected formats.
4. Store source metadata alongside the cleaned data.
5. Produce a tracker view that makes each metric traceable back to its origin.

A key design goal was **source transparency**. Every metric should answer:

- What is the indicator?
- Who publishes it?
- When was it last updated?
- What transformation was applied?
- Did it pass validation?

For example, a simplified validation idea is:

$$
\text{isValid} =
\text{hasValue} \land \text{isFresh} \land \text{withinExpectedRange}
$$

This helped turn the project from a static dashboard into something closer to a lightweight research system.

## What I Learned

I learned that the hardest part of macro tracking is not displaying charts. It is maintaining trust in the data behind them.

Different sources publish at different frequencies, use different formats, revise historical data, and sometimes change page structures without warning. This made automated validation essential. The project also reinforced how useful OpenAI tools can be for accelerating research workflows: generating pipeline logic, checking assumptions, summarizing source documentation, and helping design a clear structure for indicators and metadata.

## Challenges

The biggest challenges were consistency and reliability.

Some indicators update monthly, others quarterly. Some are published as spreadsheets, others as web tables or downloadable files. Handling those differences required careful normalization and defensive validation.

Another challenge was balancing automation with transparency. I did not want the system to become a black box. The goal was not just to automate collection, but to make the full path from source to output visible and auditable.

## Why It Matters

Australian housing is shaped by many forces at once: interest rates, household income, credit growth, population change, construction activity, inflation, rental pressure, and employment conditions. Looking at one metric in isolation can be misleading.

Property Macro Tracker brings these signals together in one place, with validation and source context built in from the start. It is not a forecasting engine yet. It is a foundation for better, more transparent housing research.

Log in or sign up for Devpost to join the conversation.