-
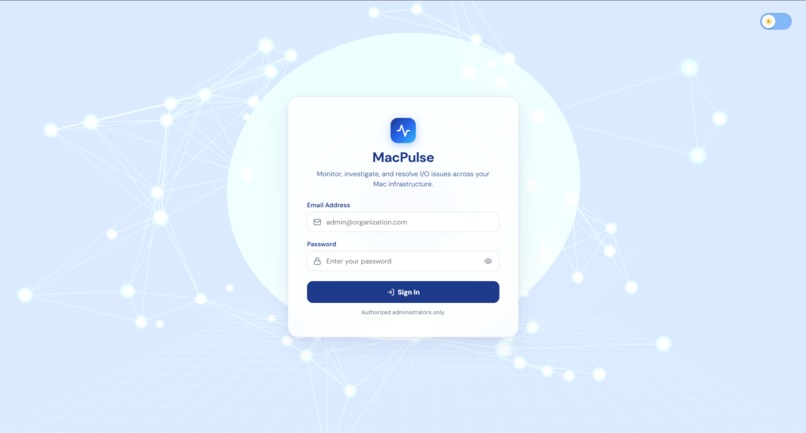
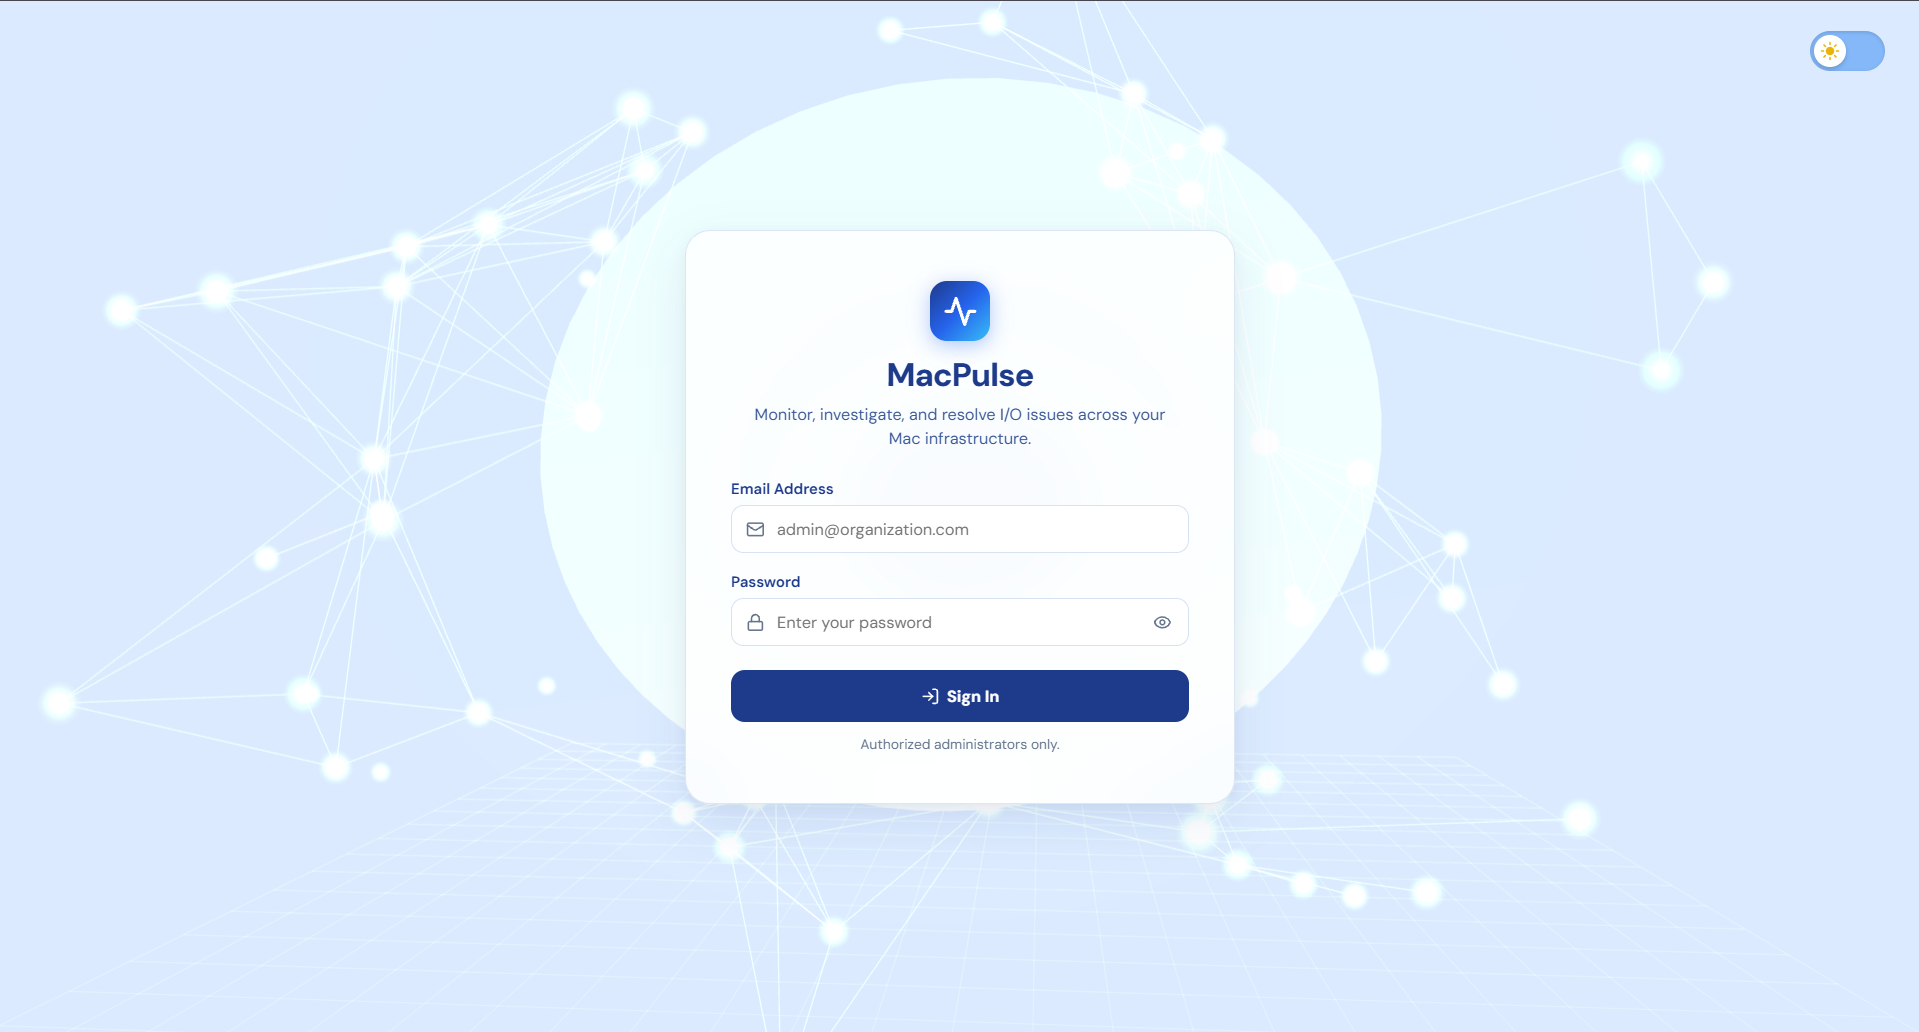
This is the log in page
-
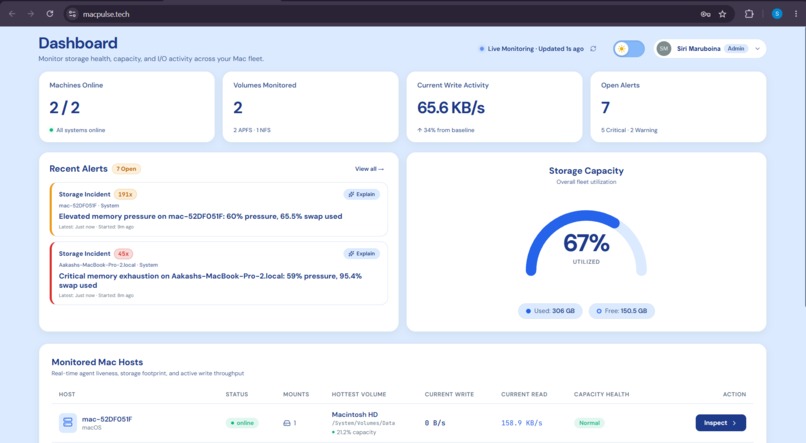
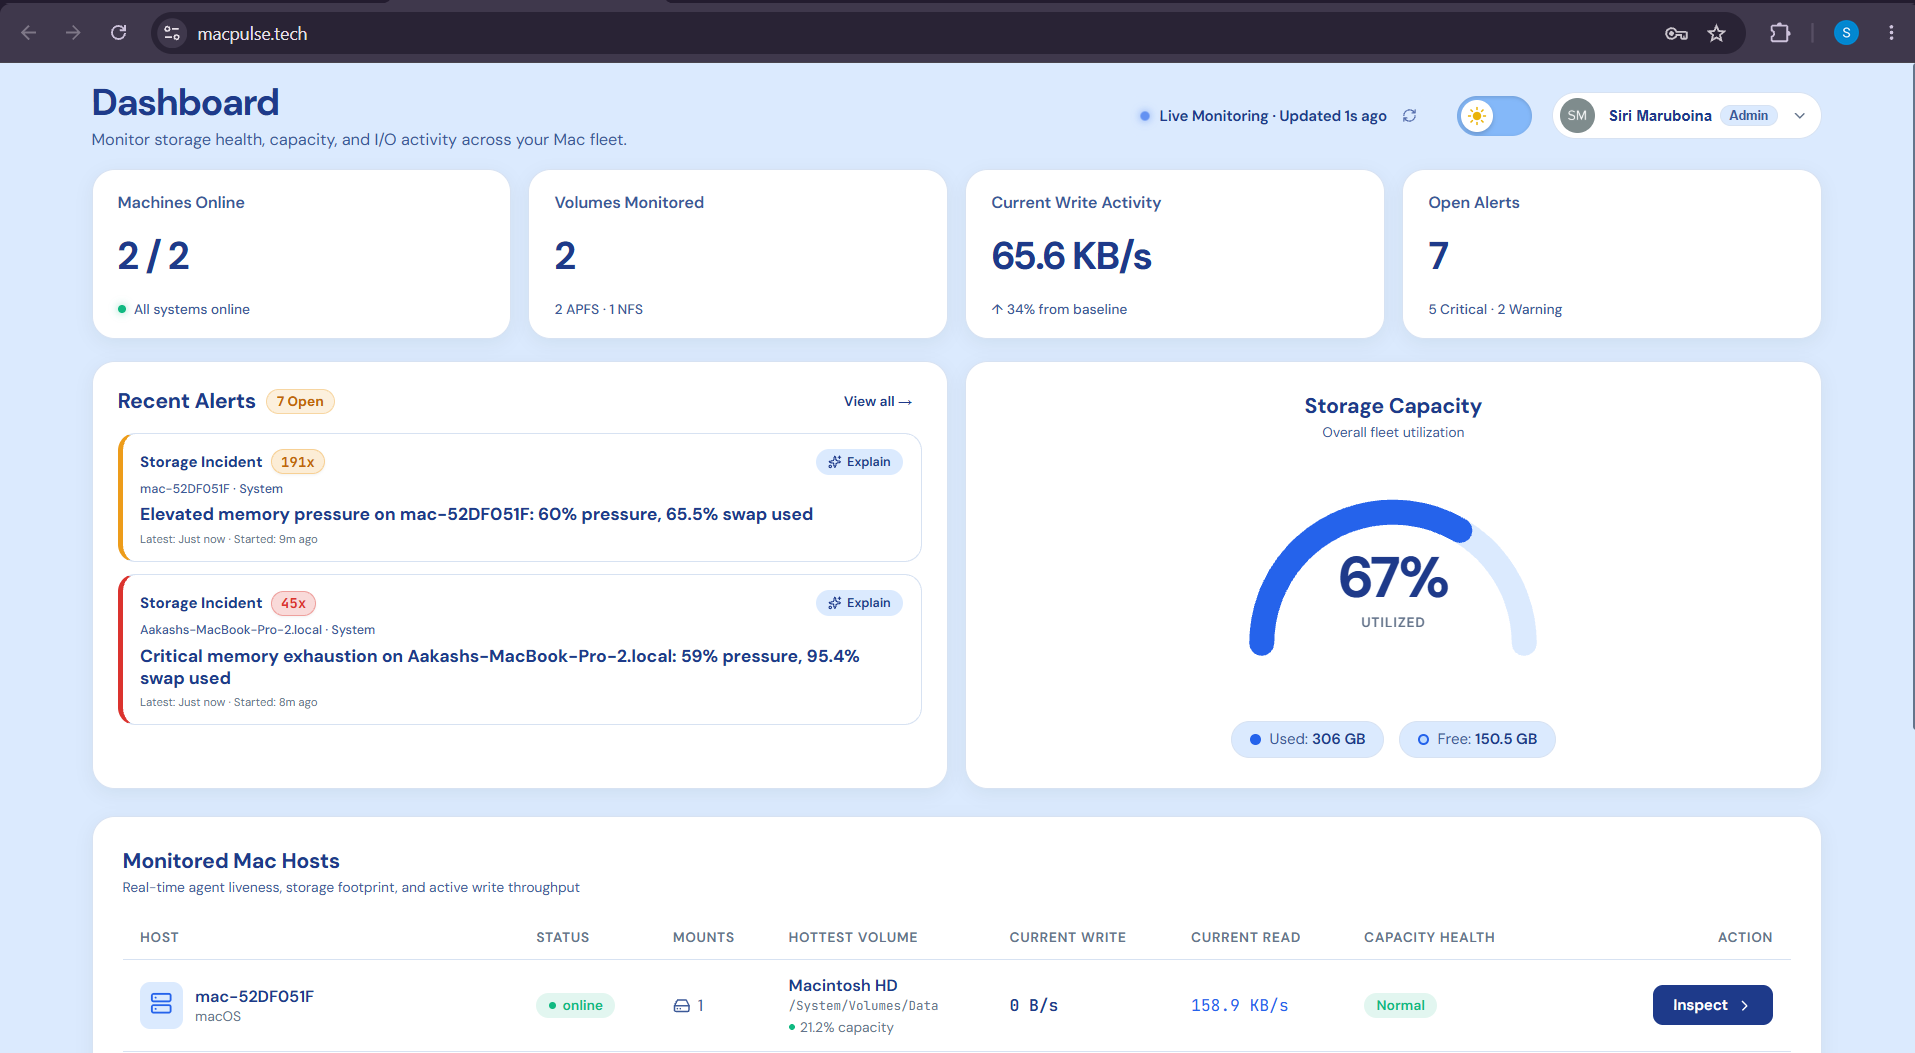
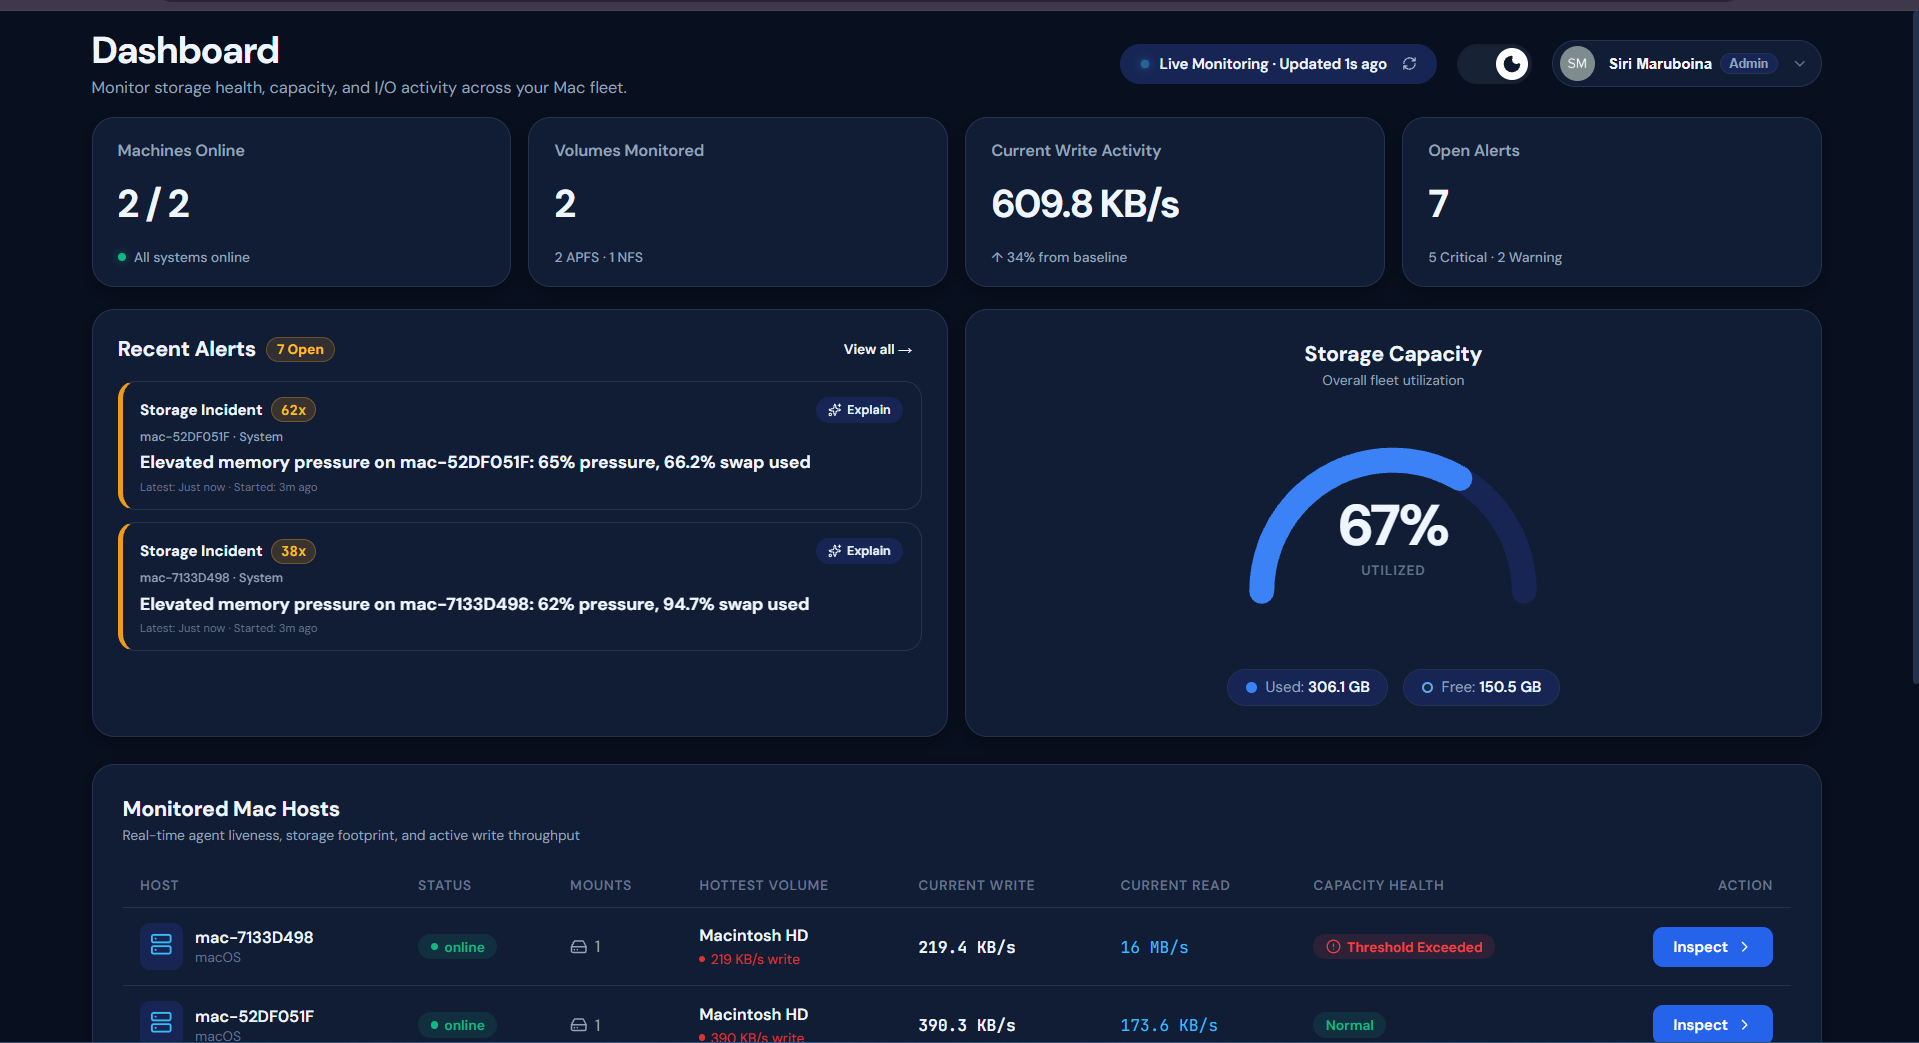
This is the Dashboard
-
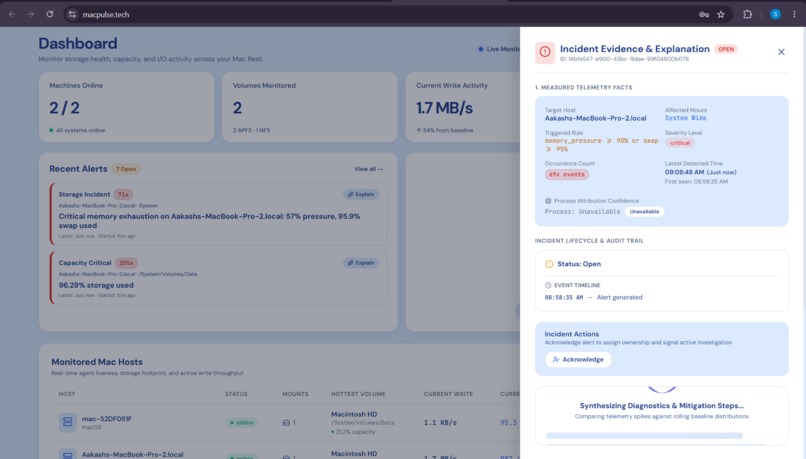
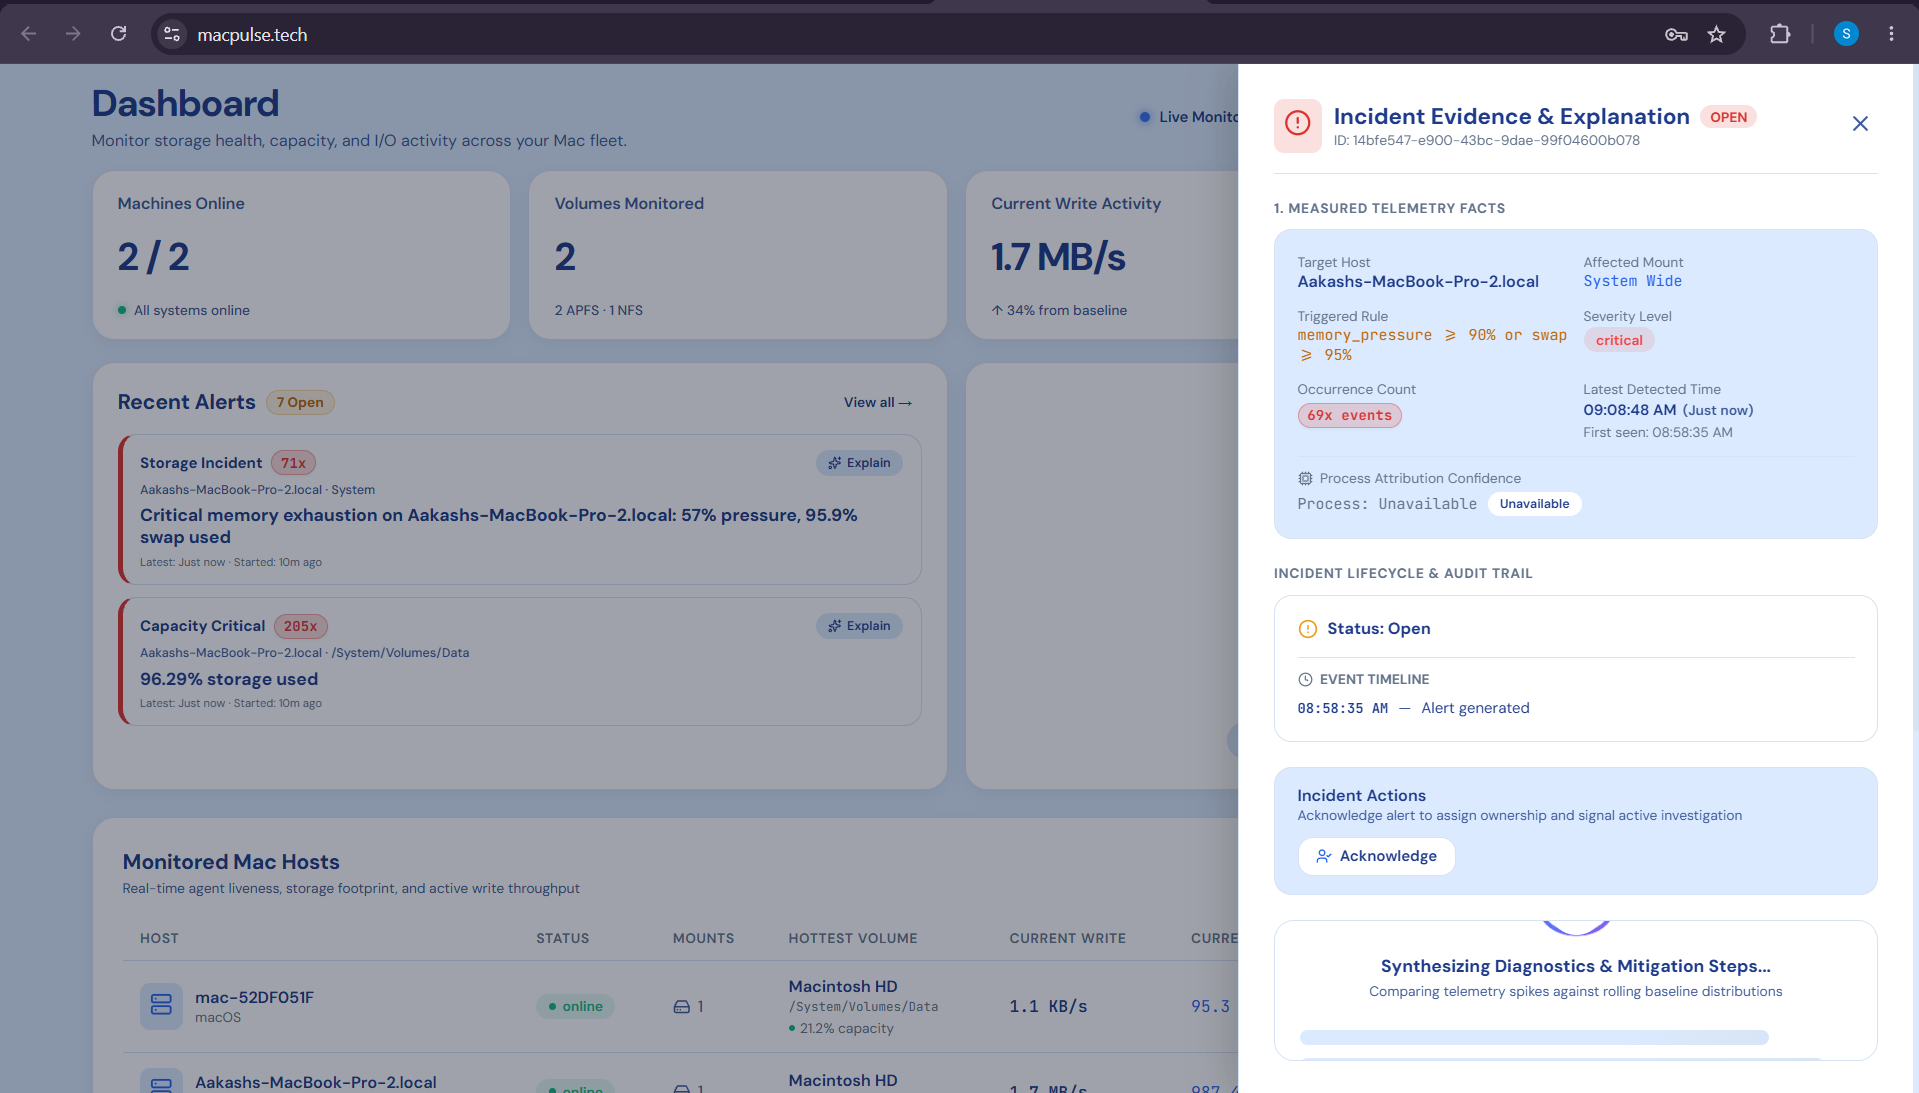
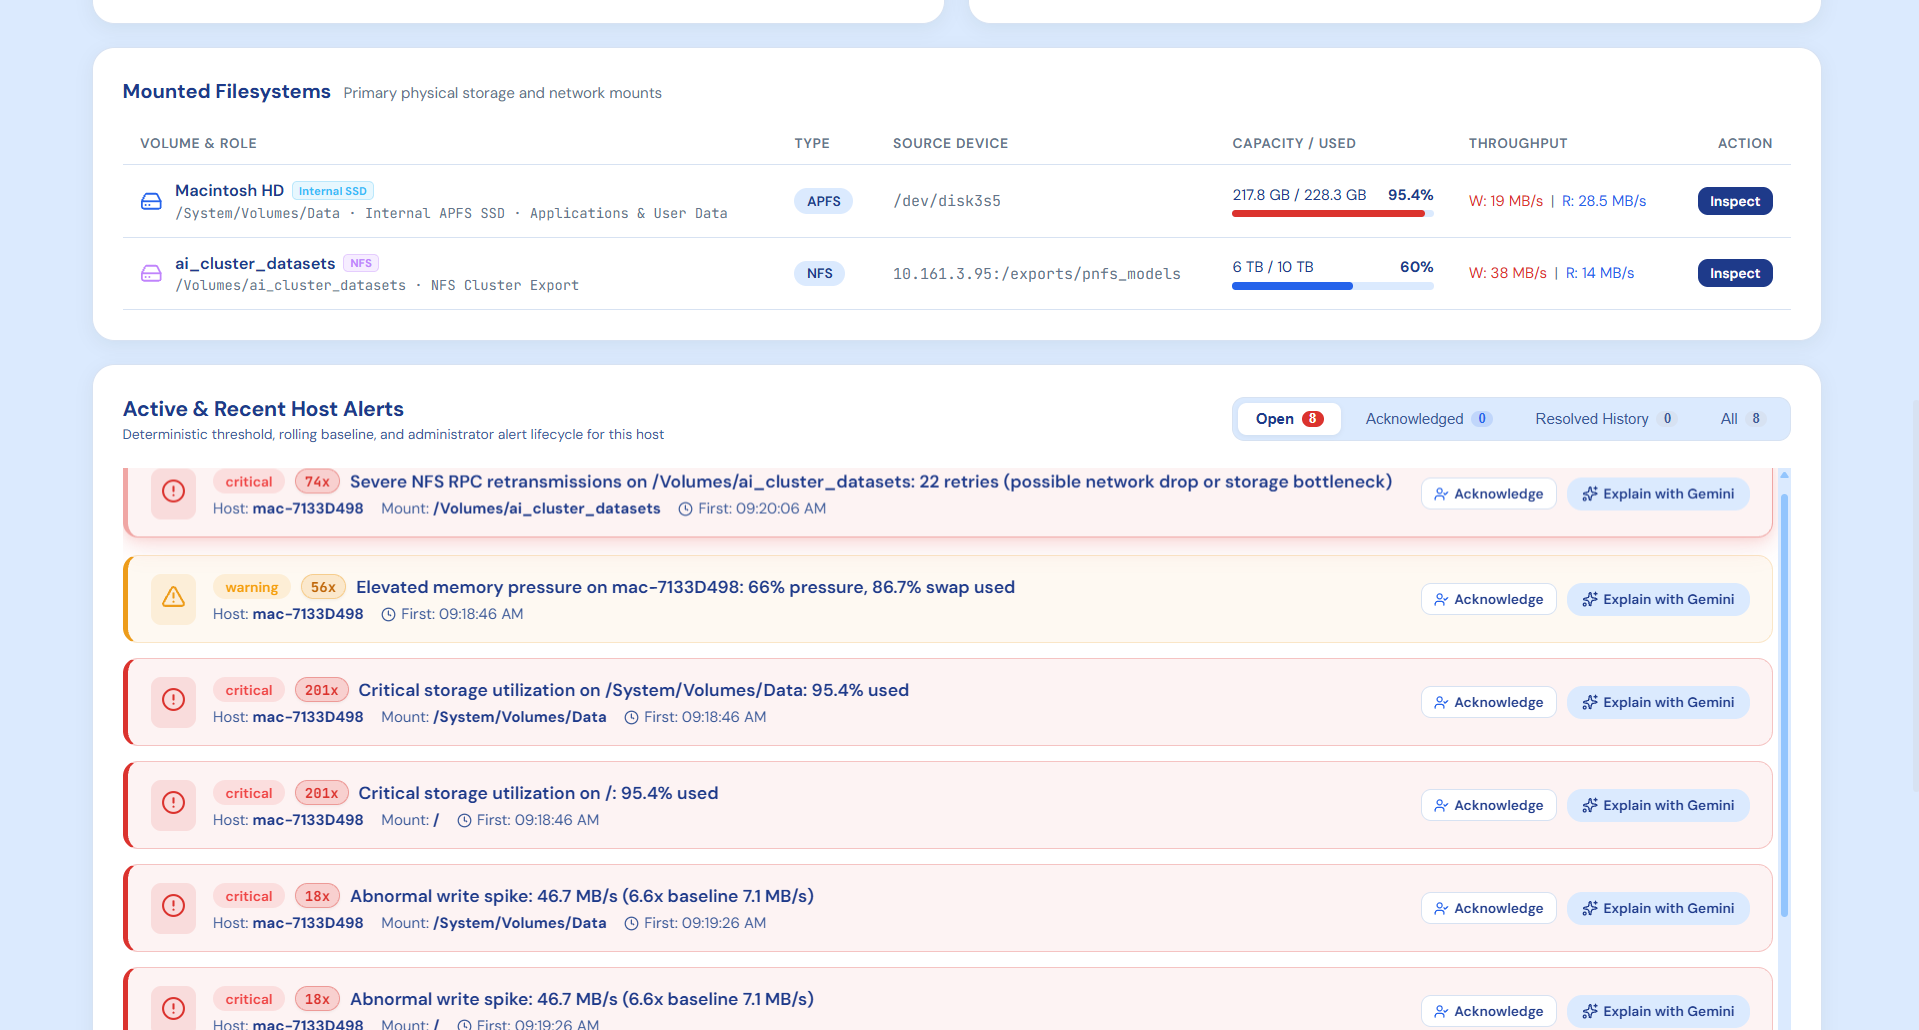
This is how the alerts are going to open up
-
This is the inspection page for one of the Macs that we used (mac-7133D498)
-
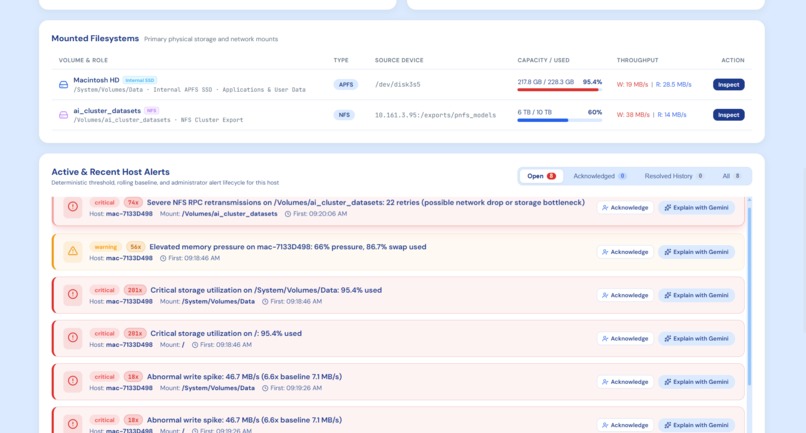
This is the continuation of the mac-7133D498 inspection page
-
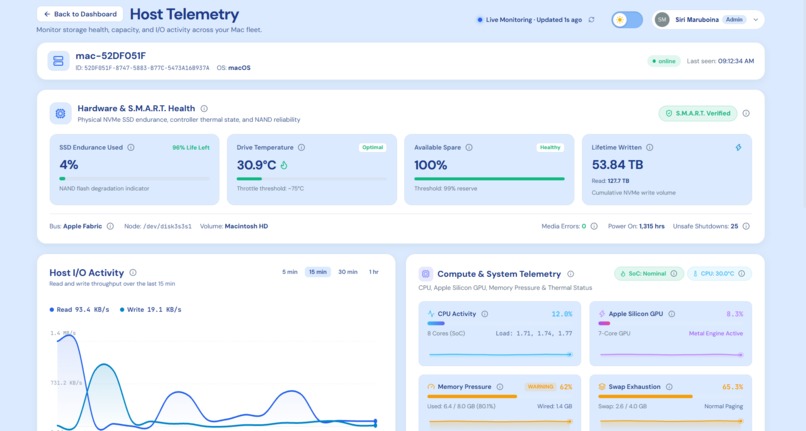
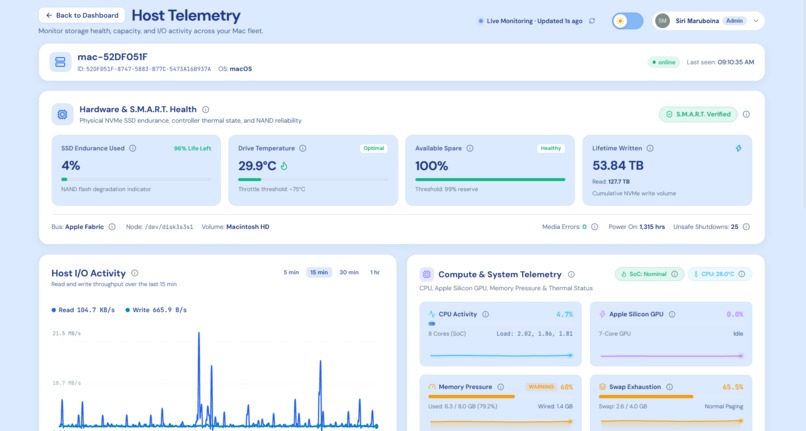
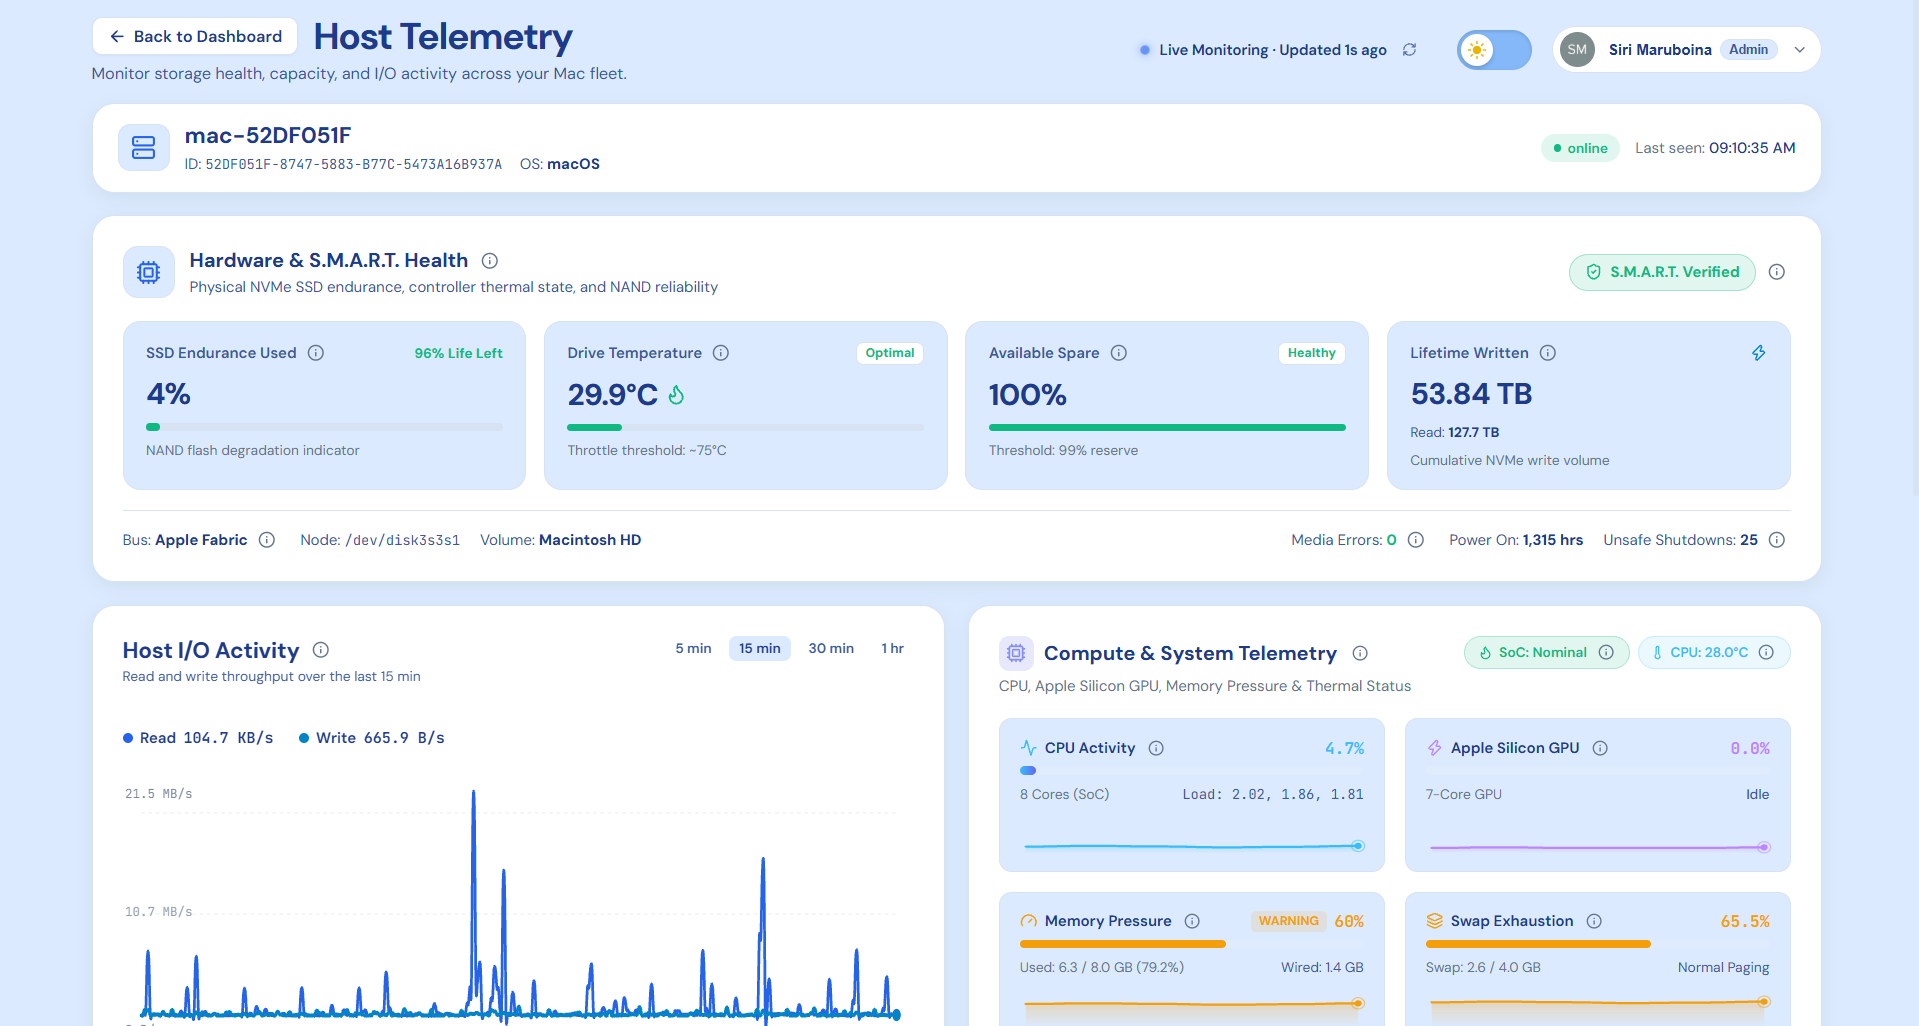
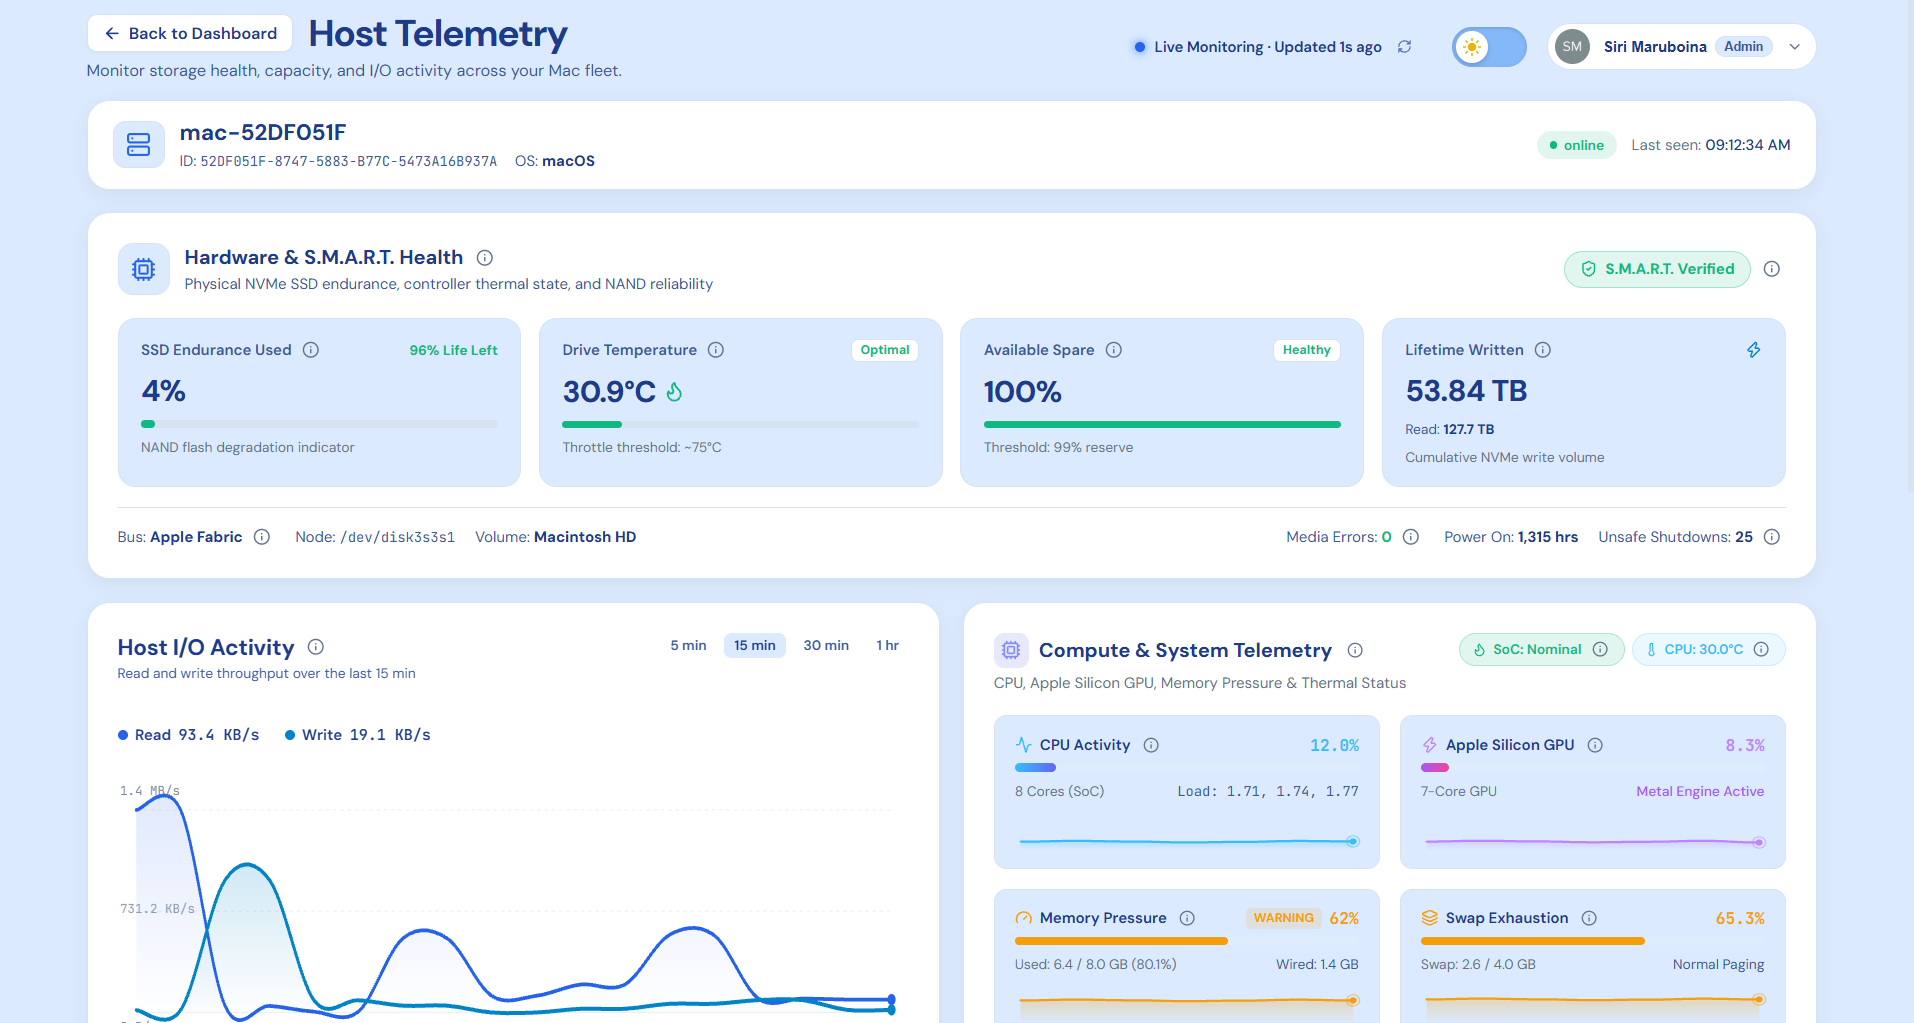
This the inspection page for mac-52DF051F
-
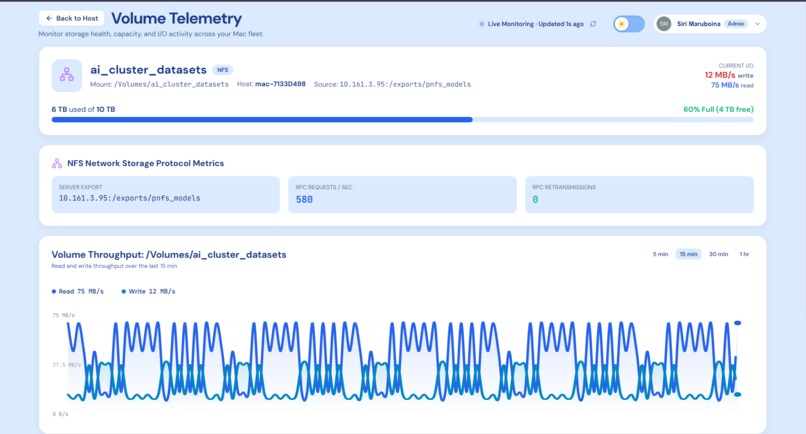
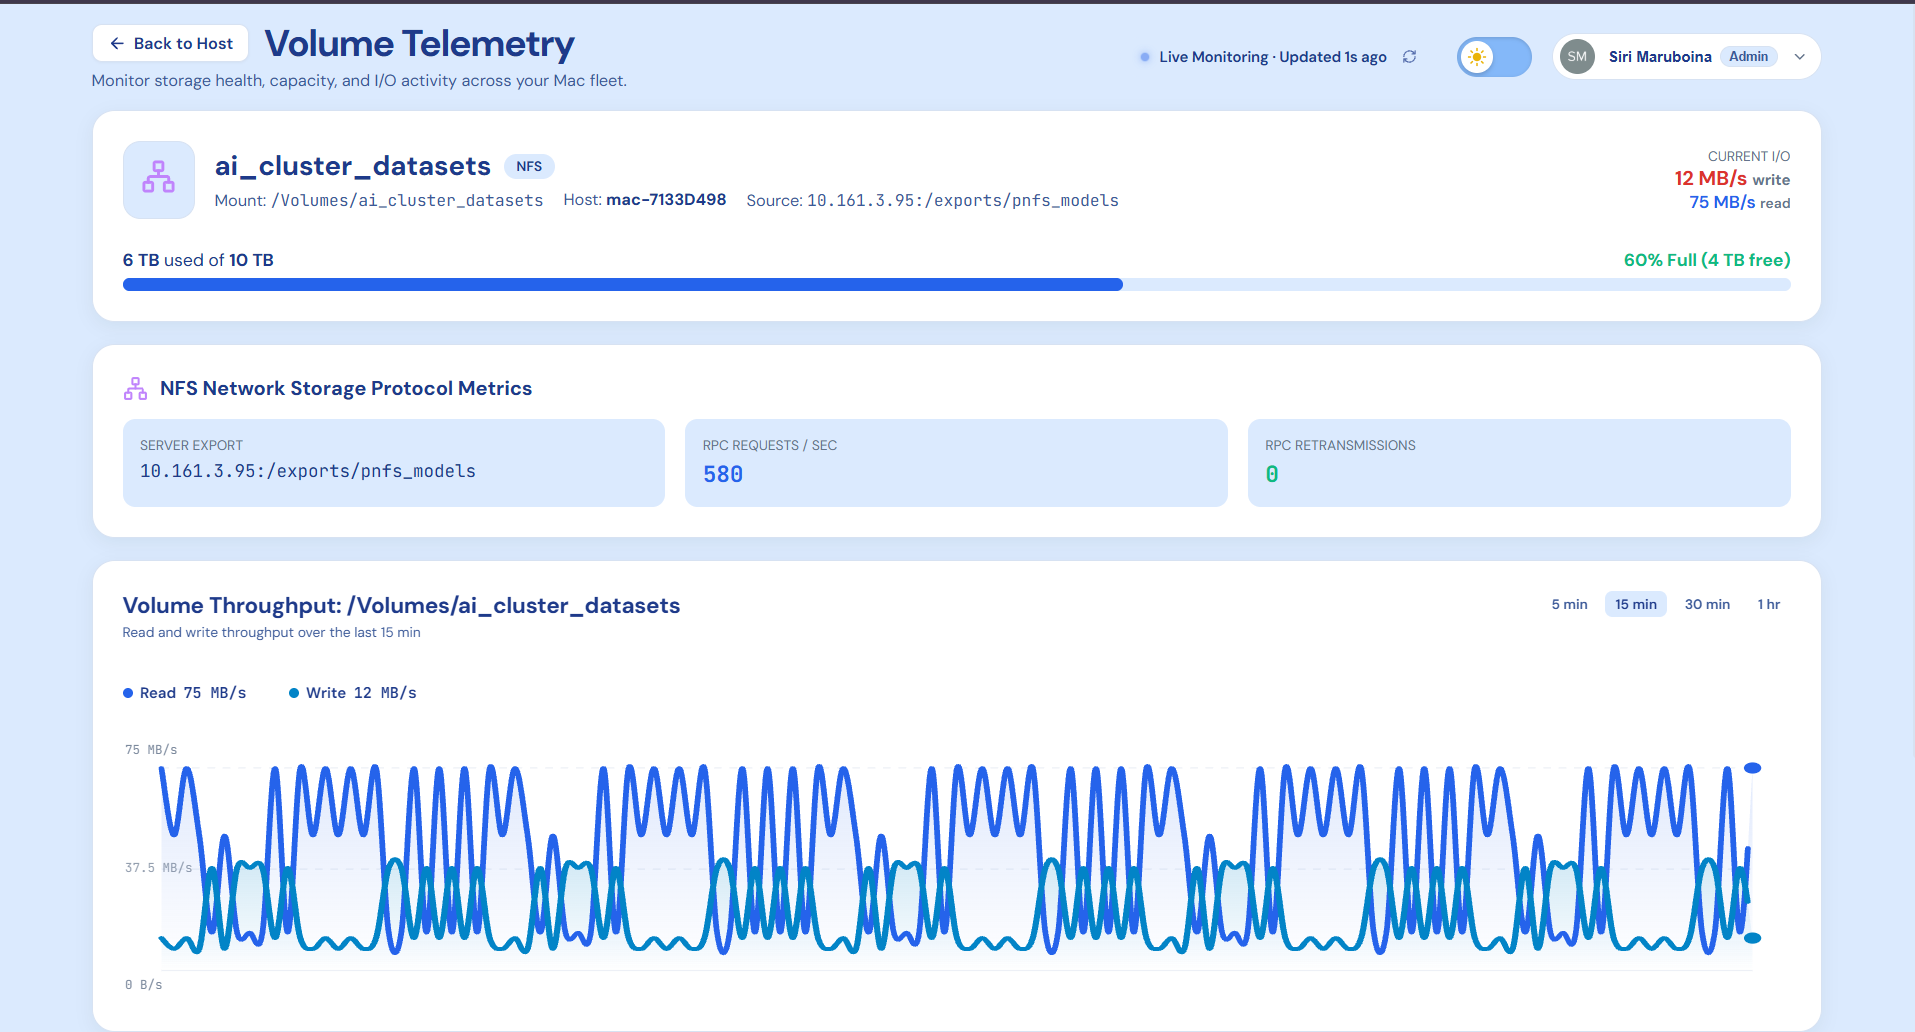
This is the NFS inspection page
-
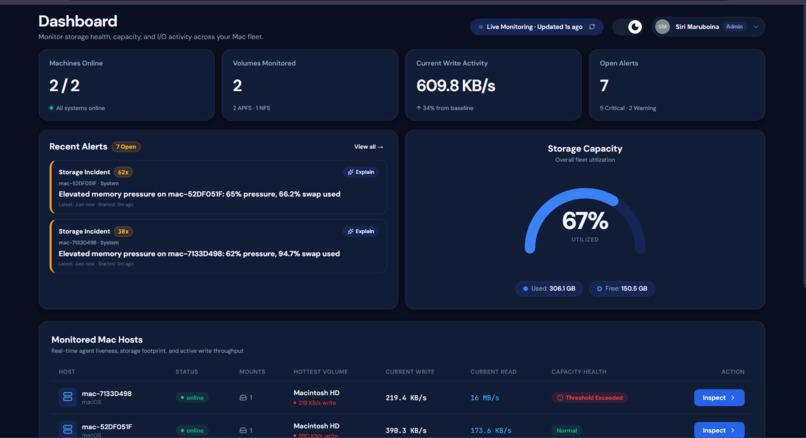
We also have dark theme and this how it looks
Inspiration
When an AI workload slows down, finding the cause can mean checking multiple Macs and separate terminal tools. Is storage nearly full? Is another process generating heavy writes? Is network storage struggling?
The HackWesTex macOS AI File System Metrics challenge inspired us to build MacPulse: a central dashboard that helps teams monitor the storage behind local AI workloads and investigate problems with clear evidence.
What it does
MacPulse brings macOS storage health, capacity, performance, and incident investigation into one web interface.
- Fleet monitoring: View connected Macs, online status, monitored volumes, read/write activity, and open alerts.
- Host and hardware health: Inspect storage capacity, available S.M.A.R.T. measurements, SSD endurance, temperature, memory pressure, and swap usage.
- APFS and NFS monitoring: Explore local and shared volumes, including mount details, available space, throughput history, RPC activity, and retransmission counts.
- Incident investigation: Review severity, triggered rules, timestamps, recurring events, and available process-attribution evidence. Acknowledge alerts and record resolution notes.
- Gemini-assisted explanations: Generate summaries, supporting evidence, possible causes, and recommended checks from alert telemetry. A local rule-based fallback works when Gemini is unavailable.
- Account access and themes: Email-and-password sign-in with light and dark viewing options.
The project includes a macOS nfsstat collector and a separate simulated NFS/pNFS workload for repeatable demonstrations of normal activity, retransmission spikes, and recovery.
How we built it
MacPulse combines a Python monitoring agent, a FastAPI backend, and a React dashboard.
The agent collects macOS measurements and sends telemetry and heartbeats to the backend. Elevated collection uses fs_usage for deeper process tracing, with fallback collection for standard permissions.
The backend stores historical measurements in SQLite and evaluates capacity thresholds and rolling activity baselines. Alert grouping consolidates recurring events.
We used Figma for interface design and React, JavaScript, and Vite for implementation. Three.js supports visual elements, Auth0 provides authentication integration, and Google Gemini generates structured alert explanations.
We deployed the application at macpulse.tech and included a Makefile, setup documentation, automated tests, and demonstration scripts to help others run the project.
Challenges we faced
Combining measurements from different macOS sources required handling inconsistent formats, hardware differences, and permissions. We also needed to make unavailable information visible rather than imply that every metric or process attribution was known.
Making alerts useful required grouping repeated events and providing clear acknowledgment and resolution workflows. For AI explanations, we focused on grounding responses in telemetry while keeping the underlying evidence accessible.
Finally, connecting agents, APIs, authentication, and the deployed frontend required coordination across the team and attention to the complete user experience.
Accomplishments that we're proud of
We brought fleet monitoring, host telemetry, volume inspection, and incident investigation into one application, with two Macs online in our demonstration.
One example showed why this matters: overall storage utilization was approximately 67%, while an individual volume was 96.3% full. MacPulse exposed the specific capacity concern that a fleet average could hide.
We also delivered dedicated NFS views, Gemini-assisted investigation, light and dark themes, a deployed website, and documented setup commands.
What we learned
We learned that monitoring becomes useful when measurements have context: the affected machine, volume, time range, and related activity.
The project strengthened our skills in macOS telemetry, file systems, APIs, interface design, and deployment. It also reinforced the importance of distinguishing measured facts, possible explanations, and confirmed causes, and clearly separating live measurements from simulated demonstrations.
What's next for MacPulse
- More flexible alert configuration and notification integrations.
- Longer-term trends and storage-capacity forecasting.
- Exportable incident reports and investigation histories.
- Additional deployment and security hardening for larger installations.
Try it out
Visit MacPulse and sign in using our shared demo account:
Demo email: demo@gmail.com
Demo password: Demopassword@123
Use these demo credentials to explore the application. No registration is required.
Source code and setup instructions: GitHub Repository
Built With
- auth0
- chat-gpt
- claude
- fastapi
- figma
- google-gemini
- javascript
- python
- react
- sqlite
- three.js
- vite

Log in or sign up for Devpost to join the conversation.