-
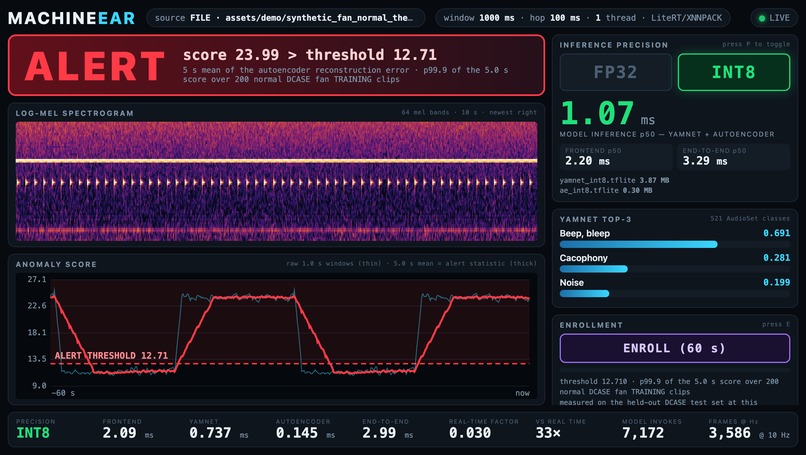
Live dashboard: INT8 inference at 1.07 ms, anomaly score crossing the alert threshold
Track: Physical AI
MachineEar is an offline acoustic condition-monitoring system that runs entirely on an Arm CPU. It fits the Physical AI track: it senses the physical world through a physical sensor — a microphone — and makes a real-time decision about physical equipment, which is the canonical industrial predictive-maintenance workload. It is deliberately not a Cloud AI entry (there is no network path at all: one self-contained page, one local process) and not a Mobile AI entry (no phone, no app store, no mobile runtime). The Arm device does the inference; the machine it listens to is separate equipment nearby, which is the real edge-gateway pattern.
What was optimized: inference cost. Full-integer INT8 post-training quantization of both models, measured end to end — 4.071x faster in the deployed timed region (float-to-int8 conversion included in the measurement), 4.084x sustained throughput, 3.677x smaller on disk, with detection accuracy retained (ROC-AUC 0.653516 to 0.654290 over 1,875 labelled DCASE fan test clips).
Run it yourself — no dataset, no microphone, no hardware but an Arm64 box
Every figure below can be re-derived, and the system itself run, from a bare
clone. On any Arm64 machine with Python 3.12, git and curl:
git clone https://github.com/Oishi1029/machine-ear
cd machine-ear
scripts/setup.sh           # venv + pinned deps + YAMNet weights, each verified by hash
scripts/run_demo.sh demo   # opens http://127.0.0.1:8000/
setup.sh is the only slow step — it installs the pinned dependencies
(TensorFlow alone is about 250 MB) and downloads YAMNet's weights, checking the
sha256 of the class map and the md5 and byte count of yamnet.h5 before it uses
either. It is idempotent, so a second run is a no-op.
run_demo.sh demo needs no dataset and no microphone. It drives a 30-second
clip this repository generates from numpy primitives, and the whole dashboard is
live on it: rolling spectrogram, YAMNet's top-3 AudioSet labels, the anomaly score
against its threshold, a per-stage latency panel, and the NORMAL → ALERT
banner flipping when the synthetic fault starts. Press P and both networks
switch between FP32 and INT8 while it is running — the latency panel re-measures
and the page prints the ratio it just observed. That is the optimization happening
in front of you rather than asserted in a table.
The server binds to 127.0.0.1 and the page is one self-contained HTML document
that references no external asset — no CDN script, stylesheet, font or image.
scripts/smoke_dashboard.py asserts that on every run by scanning the served page
for external URLs (benchmarks/dashboard_smoke.json, 28,531 B page). That is a
measured property of the page, not a benchmark taken with the radio switched off.
Two more commands, and neither needs the dataset either:
scripts/run_demo.sh check                              # 41 checks against the live server
.venv/bin/python scripts/report_numbers.py --format markdown --strict
The first passes 41/41 on a bare clone, and prints an explicit SKIPPED block naming the checks whose real-machine audio a bare clone cannot supply — so a synthetic run can never be mistaken for a real-audio one, and a skipped check is never counted as a pass.
The second one re-derives every figure in this write-up from the 44 committed benchmark JSONs, prints the source file next to each value, and exits non-zero if anything is missing. If a number here does not match what that command prints on your machine, believe the command.
(The synthetic clip is a **UI aid, not evidence: no accuracy, threshold or quantization number in this project is derived from it. Every accuracy figure below comes from real DCASE2020 and ESC-50 recordings.)
The four results this project stands on
- 4.071x faster in the deployed timed region, with the float↔int8 conversion inside the measurement, FP32 and INT8 interleaved in one process on real log-mel input — and accuracy retained: ROC-AUC 0.653516 → 0.654290 over 1,875 labelled DCASE fan test clips.
- Bit-identical INT8 output in a native aarch64 Linux container — 0 elements differing, max abs diff 0.00000000, both models, builtin TFLite ops only, int8 in and int8 out.
- KleidiAI is in the wheel, is reachable, and is 1.878x slower than what we
ship on this chip — established by symbol inventory, an executed probe model,
sample(1)profiling and instruction-level disassembly, not by assertion. - Every number regenerates from the repository with one command, with the source JSON printed beside it — and the provenance guard that command runs disqualified three of our own measurements.
Project overview
MachineEar listens to a running machine through an ordinary microphone and tells you two things every second: what it is hearing, and whether it still sounds normal. It runs entirely on one Arm CPU core, offline — no cloud, no GPU, no Neural Engine, no network.
The reason it should win is not the detector. It is that the whole FP32 → INT8
optimization was measured properly and reported honestly, including the parts that
failed. The repository contains 44 raw benchmark JSON files and a single script,
scripts/report_numbers.py, that re-derives every published figure straight from
them, prints the source file next to each one, prints MISSING instead of a
default when something is absent, and runs a provenance guard that cross-checks the
model byte size recorded inside each JSON against the file that name refers to
today. That guard disqualified three of our own measurements during the
project; they were re-run against the correct artifact and the affected numbers
changed. That is in the README under "What did not work", not buried.
Measured on an Apple M1 Pro (Armv8-A, 6 P-cores + 2 E-cores, FEAT_DotProd=1,
FEAT_I8MM=0, FEAT_SME=0), macOS 26.5.2 / Darwin 25.5.0 arm64, ai-edge-litert
2.1.6 with the XNNPACK delegate, 1 thread for every latency number in the
project. The shipped INT8 models were also executed inside a native aarch64
Linux container and produced bit-identical output.
What it does
A microphone feeds 1-second frames to two LiteRT models:
- YAMNet — 521 AudioSet classes — answers what am I hearing. It is context, not the detector: it tells you the microphone is pointed at the machine and not at a conversation.
- A DCASE2020-style dense autoencoder answers does this sound healthy, by reconstructing the log-mel frame and reporting the error.
A local Flask + websocket dashboard shows the live spectrogram, the top-3 labels, the anomaly score against its threshold, and a per-stage latency panel. Two things on that page are the point of the project:
- A precision toggle. Press
Pand the two networks switch between FP32 and INT8 while the system is running, on the same audio. The latency panel updates and the page shows the ratio it just measured. The optimization is visible, live, rather than asserted in a table. - A 60-second enrollment. A threshold fitted to a public dataset is meaningless
for your machine in your room, so on a live microphone the alerts stay
switched off and the banner says
NO THRESHOLDuntil you press ENROLL. Enrollment records the machine running normally, fine-tunes the autoencoder on that capture, re-quantizes it to INT8 using the enrollment audio as its own calibration set, and derives a mean + 3σ threshold. Measured on a live microphone: 60 s requested, 60.0 s captured, 74.884 s total, 0 samples dropped (benchmarks/enrollment_live_mic.json).
The NORMAL / ALERT banner latches for 4 s so a single window cannot make it
flicker. Measured latch: 4.099945 s in one run (benchmarks/alert_transition.json),
3.867616 s in another (benchmarks/dashboard_alert_smoke.json), and 3.891241 s to
the last ALERT frame / 4.000336 s to the first NORMAL frame in a third
(benchmarks/alert_transition_synthetic.json, which brackets the true expiry
between two frames 100 ms apart).
Deliverables: the running dashboard, seven committed .tflite artifacts (the four
the system uses — YAMNet FP32/INT8 and autoencoder FP32/INT8 — plus the superseded
random-calibration YAMNet kept as evidence and never loaded by the dashboard, and two
dynamic-range probe models under work/ used only for the KleidiAI investigation),
44 benchmark JSONs, a 41-check self-test, an Arm-specific investigation document
(docs/ARM_OPTIMIZATION.md) with microkernel profiling and disassembly, and
per-artifact licence provenance (MODELS.md).
The optimization, measured
Both models were converted to full-integer INT8 — int8 in, int8 out, per-axis weights, no float fallback, builtin TFLite ops only, zero custom or Flex ops. YAMNet's quantization ranges come from 345 real log-mel patches (225 from 150 ESC-50 clips, 120 from 40 DCASE fan clips) selected inside a loudness percentile band of [15, 30] with a ±8.0 logit clamp.
There is no single "the speedup". Each of these measures a different thing and each is quoted with what was timed:
| What was timed | FP32 | INT8 | Ratio |
|---|---|---|---|
YAMNet invoke() alone, p50, separate processes |
2.130313 ms | 0.516854 ms | 4.122x |
| the same runs, p99 | 2.417500 ms | 0.873875 ms | 2.766x |
YAMNet invoke() alone, interleaved in one process, real log-mel input |
2.150771 ms | 0.514417 ms | 4.181x |
deployed timed region (quantize input + invoke + dequantize 521 logits), interleaved, real input |
2.1501245 ms | 0.528125 ms | 4.071x |
| the same, p99 | 2.477750 ms | 0.666042 ms | 3.720x |
| sustained throughput, completed invokes / wall clock over 30 s | 463.2 ips | 1891.9 ips | 4.084x |
| YAMNet file size | 14,936,744 B | 4,062,664 B | 3.677x |
Autoencoder invoke() on one 640-dim vector, p50 |
0.015041 ms | 0.005125 ms | 2.935x |
| Autoencoder file size | 1,069,700 B | 318,104 B | 3.363x |
(That one FP32 figure is written at seven decimals on purpose. The JSON text reads
2.1501245, which looks like a tie at the sixth decimal — but the stored
double-precision value is 2.150124499999999994…, strictly below the midpoint, so
rounding it correctly gives 2.150124 (which is what the repository's
scripts/report_numbers.py and README.md both print). Rather than lean on that
subtlety in a table, the full stored precision is quoted here. Every other figure in
this document is the JSON's own value rounded to six decimals. The 4.071x ratio is
computed from full precision, not from the printed figures.)
4.071x is the most defensible single-model number in the project: FP32 and INT8 alternate in 10 blocks of 100 invokes inside one process so thermal state hits both equally, the input is real log-mel data rather than synthetic noise, and the float↔int8 conversion the deployed path must pay is inside the timed region. The 4.122x kernel-only figure is the classic tflite benchmark protocol and is quoted alongside it, not instead of it.
Throughput is measured, not derived: deriving it as 1000/p50 would have said 1934.8 ips for INT8 and 469.4 for FP32, overstating the real rate by 2.3 % and 1.3 %, because a median ignores the tail.
Run-to-run spread on that row, stated because it is the largest we saw. An
independent re-run of the FP32 30-second throughput measurement came back 2.2 %
below the committed 463.2 ips, moving the ratio by more than 2 %. Everything else
that was re-run landed within 0.5 %. The likeliest cause is thermal state — a 30 s
saturated window on a fan-cooled laptop is not a controlled environment. That
re-run wrote nothing into benchmarks/, so it is reported here from the audit
record rather than quoted as a figure; the committed 4.084x is the one the JSON
supports.
Both YAMNet graphs execute the same 69,165,056 MACs per invoke. Quantization changed the datatype, not the op count — this is not a smaller model doing less work.
And a whole 1-second dashboard frame, measured against the running server:
| Stage, p50 per frame | FP32 | INT8 | Ratio |
|---|---|---|---|
| feature frontend (numpy/librosa log-mel) | 1.668541 ms | 1.612334 ms | 1.035x |
| YAMNet | 2.210000 ms | 0.595667 ms | 3.710x |
| autoencoder | 0.282542 ms | 0.121000 ms | 2.335x |
| inference (YAMNet + AE) | 2.492416 ms | 0.720354 ms | 3.460x |
| end-to-end frame | 4.197375 ms | 2.388208 ms | 1.758x |
Real-time factor 0.023882 in INT8 — 2.4 ms of compute against a 100 ms budget, about 42x faster than real time. That 1.035x frontend row is identical numpy code in both precisions: it is run-to-run noise, and it is printed as such rather than presented as a win.
Accuracy retention
Quantization is only interesting if the model still works.
Autoencoder, full DCASE2020 fan test set, all 1,875 labelled clips. The INT8 reconstruction is scored in float against the original, unquantized features, so quantization error degrades the score honestly instead of cancelling itself out:
| FP32 | INT8 | Δ | |
|---|---|---|---|
| ROC-AUC (per-ID mean) | 0.653516 | 0.654290 | +0.000774 |
pAUC, max_fpr=0.1 |
0.524995 | 0.525349 | +0.000354 |
INT8 is not "better" — every per-ID delta is ≤ 0.002 (largest 0.001983, on
id_04) and the sign flips between IDs. The claim is retention, not improvement.
For context, two third-party published values exist for this same fan baseline:
the DCASE2020 Task 2 results page lists baseline submission Koizumi2020 on the
fan development set at AUC 65.83 / pAUC 52.45, and the official baseline
repository's README reports 0.651585 for the same quantity. Our 0.653516 falls
between them (0.651585 < 0.653516 < 0.6583). Those two are cited, not re-measured
here, and nothing in this project's benchmarks/ claims to reproduce them — the
only thing being claimed is that our from-scratch baseline lands inside the range
the published ones already span.
YAMNet, prediction agreement with its own FP32 self. This is not accuracy — no ground-truth label is involved. It measures how much quantization changed the model's behaviour:
| Corpus | Clips | Clip top-1 agree | FP32 top-1 inside INT8 top-5 | Patch top-1 agree |
|---|---|---|---|---|
| ESC-50, all 5 folds | 2,000 | 93.55 % | 100.00 % | 84.98 % |
| ESC-50, held-out folds 2–5 | 1,600 | 93.69 % | 100.00 % | 85.14 % |
| DCASE2020 fan test (deployment domain) | 1,875 | 84.05 % | 99.73 % | 70.18 % |
Calibration drew from ESC-50 fold 1, and folds 2–5 score higher, so the recipe did not overfit its calibration data. Where FP32 is confident (top-1 minus top-2 margin ≥ 0.1) agreement is 100.00 % on all three corpora — with n = 946 / 750 / 596 clips, printed because that conditional is meaningless without it. The fan-domain patch figure of 70.18 % is the honest cost of INT8 here and is stated as such.
The calibration recipe was the whole game. 21 variants were measured. Real audio with plain min/max calibration produced 19.5 % clip agreement — far worse than random calibration on the same subset (91.0 %). Diagnosis: real audio has such a wide cross-patch dynamic range that a min/max range leaves a median patch about 3 of 255 levels. Selecting calibration patches inside a loudness percentile band fixed it. On the one subset where both were measured (ESC-50 fold 1, 400 clips): random calibration 87.50 % → band [15, 30] 93.00 %.
What did not work — published, not hidden
A quantization write-up with no negative results is a write-up that stopped measuring early.
KleidiAI is shipped in the wheel, is reachable, and is slower than what we ship.
The LiteRT dylib contains 225 unique kai_* symbols and 111 XNNPACK wrappers
that tail-call them. On this silicon 160 of the 225 (71.1 %) are dead code —
gated on FEAT_I8MM, FEAT_SME or FEAT_SME2, all of which are 0 on M1 Pro — and
only 9 of the 111 wrappers are reachable, all in the dynamic-quantization family.
Rather than assert that, we built a dynamic-range-quantized probe model to execute
that path, confirmed by sample(1) profile that KleidiAI kernels genuinely ran
(75.74 % of kernel samples in
kai_run_matmul_clamp_f32_qai8dxp4x4_qsi8cxp4x4_16x4_neon_dotprod), and timed it:
0.970688 ms against 0.516854 ms for the static-INT8 model we ship — the KleidiAI
path is 1.878x slower here. Rebuilding with XNNPACK_ENABLE_KLEIDIAI=ON cannot
help: it is already on, and the static int8→int8 kernel family
(matmul_clamp_qai8_qai8p_qsi8cxp) exists upstream only for SME/SME2.
We checked which instruction actually does the work, and refused to over-claim.
The hot kernel for the shipped INT8 YAMNet is
xnn_qs8_qc8w_gemm_minmax_fp32_ukernel_4x16c4__asm_aarch64_neondot_ld128 (76.44 % of
kernel samples), whose disassembly contains 112 sdot and zero smmla
instructions. But the second-hottest leaf is a depthwise kernel ending
neonv8_mla8_ld64 that issues no sdot at all — so the INT8 win is not
attributable to one instruction, and no number in the repository is described as
"caused by" SDOT.
Threading barely pays and then hurts. Best-of-5 p50, fresh subprocess per cell: FP32 2.1185 ms at 1 thread → 1.0512 ms at 4 (2.015x, parallel efficiency 0.504) → 1.2221 ms at 8. INT8 0.5134 ms at 1 → 0.3524 at 2 → 0.4684 at 4 → 0.6965 ms at 8, i.e. 0.737x — slower than single-threaded. A 69 M-MAC model at sub-millisecond latency has no work left to amortise a barrier. The project ships 1 thread. An independent repeat of the whole sweep reproduces the shape (0.743x at 8 threads).
Fine-tuning is not always an improvement, so it is guarded. Enrollment compares
held-out enrollment loss before and after the fine-tune and reverts unless it
improves by more than 1 %. On DCASE machine id_02 — which the pretrained
autoencoder had already trained on — fine-tuning made it worse (9.1867 → 9.3626)
and the guard reverted. On a machine the model had never heard (an ESC-50 washing
machine) the same code adapts: 87.4959 → 43.7827, 49.96 % better, in 7.398 s.
Arm Performix could not benchmark this project. Per Arm's own install guide,
macOS is a supported host only; the supported targets are Neoverse-based Linux
systems. Using it would have required standing up a Graviton/Axion instance, which
is neither the hardware this runs on nor compatible with the offline, on-device
premise. Documented with sources in docs/ARM_OPTIMIZATION.md §2 rather than
quietly skipped.
The detector is baseline-grade, and the threshold's evidence is weak. The shipped default threshold is the p99.9 of the alert statistic over 200 normal training clips: 12.710131 (INT8), 12.680812 (FP32). On the held-out evaluation subset — 100 normal and 100 anomalous clips, 600 windows per class — the INT8 pair fires on 27/600 normal (4.5 %) and 35/600 anomalous (5.8 %) windows; the FP32 pair on 27/600 and 33/600. A two-proportion z-test on the INT8 counts gives z = 1.04, p = 0.30: at this sample size the difference is not statistically distinguishable from zero. The threshold is tuned for a low false-alarm rate on normal audio; it is not, on this evidence, a good detector. Both rates are shown on the dashboard. This project's contribution is the optimization and the end-to-end system, not a better anomaly detector — and enrollment exists precisely because the dataset threshold does not transfer.
Our own tooling disqualified three of our measurements. The provenance guard
found that throughput_yamnet_int8_1t.json and both thread-sweep files had recorded
4,060,280 B under the name yamnet_int8.tflite — that is the random-calibration
artifact's size, so those runs had measured a different file from the one they were
labelled with. They were re-run against the shipped model and the numbers changed;
INT8 sustained throughput is now the measured 1891.9 ips. Every benchmark cell
now also records the sha256 of the file the interpreter actually loaded, so a
filename can no longer stand in for an artifact.
Energy was never measured. bench/power.sh exists and powermetrics needs an
interactive sudo password, so the load-generator half was used and the sampling half
was not. No power or energy JSON exists in the repository and no watts-or-joules
claim is made anywhere.
Portability to Arm64 Linux
"An INT8 tflite built on a Mac runs unchanged on an Arm64 gateway" is easy to assert,
so it was tested instead. Both shipped INT8 models were executed on the macOS/arm64
host and inside a native aarch64 Linux container (colima on Apple's
Virtualization.framework — not QEMU emulation; Docker reports 29.5.2 linux/aarch64,
kernel 6.8.0-117-generic), same LiteRT 2.1.6, same seeded input bytes:
- output tensors bit-identical: 0 elements differing, max abs diff 0.00000000, both models
- graphs are TFLite builtin ops only, 0 custom/Flex ops, int8 in and int8 out
- the INT8 win survives the OS change: 4.127x on the host, 3.223x in the container
Stated caveat, also written into the JSON itself: the container runs in a VM on the same M1 Pro silicon and is bounded by that VM's CPU allocation, so its absolute latency is not a gateway measurement. What is claimed is that the artifact and the FP32→INT8 win survive the OS change — nothing about how a gateway performs.
How I built it
- Baseline first. Exported Google's YAMNet to FP32 TFLite, trained the DCASE2020-style dense autoencoder from scratch on the DCASE2020 Task 2 fan train split, and reproduced the published fan baseline (per-ID mean AUC 0.653516, between the two published baseline values) before touching quantization. A speedup over a baseline you cannot reproduce is not a result.
- Full-integer INT8 conversion of both models, int8 in / int8 out, per-axis weights.
- Fixed the calibration, which was the real work. Plain min/max on real audio
collapsed the model to 19.5 % agreement. Diagnosed it with
scripts/diagnose_yamnet_quant.py, then swept 21 calibration variants to find the loudness percentile band that fixed it. - Built a fair benchmark harness. Kernel-only and deployed-timed-region variants, FP32/INT8 interleaved inside one process, real log-mel input as well as synthetic, model sha256 recorded in every result, plus a genuinely measured 30 s sustained-throughput run rather than a median-derived one.
- Went down to the microkernel.
nm/otoolinventory of every KleidiAI symbol in the shipped dylib with its ISA gate,sample(1)leaf-symbol profiling ofinvoke(), and disassembly of the kernels that actually run. - Built the real-time system around it — audio source with drop accounting, a pure-numpy YAMNet-compatible log-mel frontend, the engine, enrollment with the keep-or-revert guard, and a self-contained dashboard page with no external assets.
- Made the numbers auditable.
scripts/report_numbers.pyre-derives every figure from the JSONs with a provenance guard;scripts/smoke_dashboard.pyasserts 41 things about the running server.
Challenges I ran into
- INT8 calibration on real audio nearly killed the project. Plain min/max calibration on real recordings produced worse agreement (19.5 %) than random noise calibration (91.0 %) on the same subset. Real log-mel data has such a wide cross-patch dynamic range that a global min/max range leaves a median patch occupying about 3 of 255 quantization levels. The fix — selecting calibration patches from inside a loudness percentile band — took the ablation sweep to find.
- The thing I expected to be the win was the negative result. I went in expecting KleidiAI to be the story. It is present, it is reachable, we executed it, and it is 1.878x slower than what we ship on this chip. Writing that up properly took longer than a positive result would have.
- Threading made things worse. Two full sweeps to be sure it was not noise.
- Our own numbers failed our own audit. Three benchmark files turned out to have been measured against the random-calibration artifact while carrying the shipped model's name. That is why every result now records a sha256 and why the guard runs on every report.
- The bottleneck moved and I had to admit it. After quantization the numpy feature frontend costs 2.24x as much as both models put together.
- Licensing. The autoencoder is trained on a NonCommercial dataset and the INT8
YAMNet's quantization ranges are measured from NonCommercial audio, so the code is
Apache-2.0 but several binaries are not.
MODELS.mdstates the terms per artifact, a pre-commit hook refuses to stage dataset audio, and no dataset audio is committed.
Accomplishments I'm proud of
- 4.071x on the deployed timed region — the honest, fully-loaded number, with the float↔int8 conversion inside the measurement — and 4.122x kernel-only quoted beside it rather than instead of it.
- Accuracy retained: ROC-AUC 0.653516 → 0.654290 across 1,875 real labelled test clips.
- A live precision toggle. You can watch the optimization happen on a running
system instead of reading a table about it — press
Pon the pagescripts/run_demo.sh demoopens, on a bare clone, with no dataset and no microphone. - Every number is reproducible from the repo by one command, with the source file printed next to it and MISSING printed where something is absent.
- A provenance guard strict enough to fail our own work, which it did, three times.
- Bit-identical INT8 output on native aarch64 Linux, with the caveat about what that does and does not prove written into the result file itself.
- 41/41 self-test checks pass, including an enrollment that genuinely runs
through
src/enrollment.py.
What I learned
- After quantization, the bottleneck moved. The un-quantizable numpy frontend (1.612334 ms) now costs 2.24x as much as both models put together (0.720354 ms). The next optimization on this project is not a smaller model, it is the feature extractor. That is the single most useful thing this exercise found.
- Which layer you time changes the answer by more than the optimization does. 4.122x kernel → 4.071x deployed kernel → 3.460x inference stage → 1.758x end-to-end. All four are real. A write-up that quotes only the first one is not wrong so much as incomplete.
- Medians hide tails. The p50 ratio is 4.122x; the p99 ratio on the same runs is 2.766x.
- Calibration data quality dominates quantization outcomes far more than any converter flag did.
- "KleidiAI is in the wheel" and "KleidiAI runs your model" are completely different claims, and only profiling tells you which one you have.
- A filename is not an artifact identity. Hash everything you benchmark.
What's next
- Optimize the feature frontend, because that is where the time now is: a fixed-point or NEON-intrinsic log-mel path to attack the 1.612334 ms that quantization cannot touch.
- Measure energy per inference.
bench/power.shis written and waiting for the interactivesudo powermetricsrun; latency and size are measured, energy is not, and it is the number a battery-powered or thermally-constrained deployment actually cares about. - Run it on real gateway silicon (a Cortex-A / Neoverse board) and report the latency there instead of inferring it from a VM on the same laptop.
- A better detector. The autoencoder is deliberately the DCASE baseline; the optimization work applies unchanged to a stronger model, and the threshold evidence says a stronger model is what is needed.
- Multi-machine enrollment — one microphone, several machines, per-machine thresholds.
AI assistance disclosure
Built solo with AI-assisted development (Anthropic Claude) for code drafting and documentation; all optimization design, Arm-platform implementation, benchmarks, and final verification are my own original work.
Built With
- aarch64
- apple-silicon
- arm
- arm64
- audio-processing
- css
- docker
- edge-ai
- flask
- html
- int8-quantization
- javascript
- librosa
- litert
- numpy
- python
- scikit-learn
- tensorflow
- tensorflow-lite
- websockets
- xnnpack
- yamnet

Log in or sign up for Devpost to join the conversation.