-
-
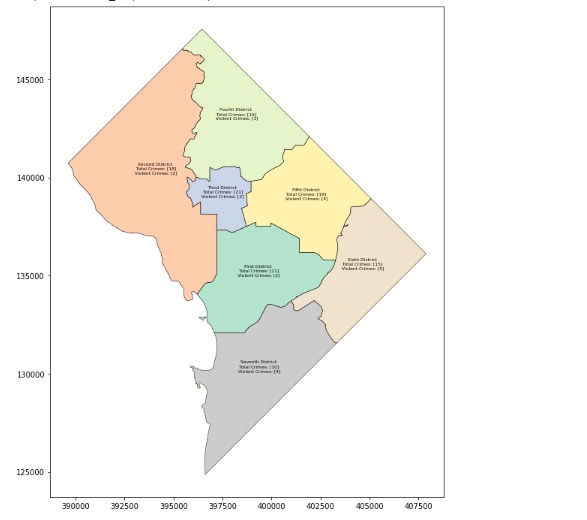
A picture of the predicted crime rates in DC for today (12/4/2022)

Inspiration: In DC, violent crime is twice the national average. As a student, I want to provide a tool that can predict the number of violent crimes in each local area on any date to help local law enforcement and neighborhoods be prepared to handle these situations.
What it does: The Program uses Machine Learning to analyze a dataset with 600,000 recent crimes in DC. It uses crime patterns to predict the number of violent and non-violent crimes and sorts them by D.C.
How we built it: We took a dataset from kaggle.com and used Machine Learning tools such as regression lines, pandas, and geopandas to build the model. We excluded the invalid data and we filtered the data by district for violent and total crimes. We used a linear regression model to train and test the data. We used the linear regression model because of time constraints, but we could use more effective models to take into account seasonality for a better fit.
Challenges we ran into: Since we have little experience with machine learning, we had to learn and implement ML into our code so that we could provide the best possible program in the time given.
Accomplishments that we're proud of: We got a basic understanding of ML concepts and hope to incorporate them in future hackathons.
What we learned: We learned the following:
- Linear regression models
- How to use Google Colab
- How to clean the data
- How to use ML
- How to test the effectiveness of a model
- How to use pandas and geopandas to plot maps
What's next for Machine Learning And Geospatial Analysis For Public Safety
- Refining the model for predictions
- Using the model to minimize opiod and drug addiction problems
- Solving Civil Disorders (Violent Protests)
- Predict where riots might spread to mitigate damages
Built With
- geopandas
- google-colab
- kaggle
- matplotlib
- pandas

Log in or sign up for Devpost to join the conversation.