-
-
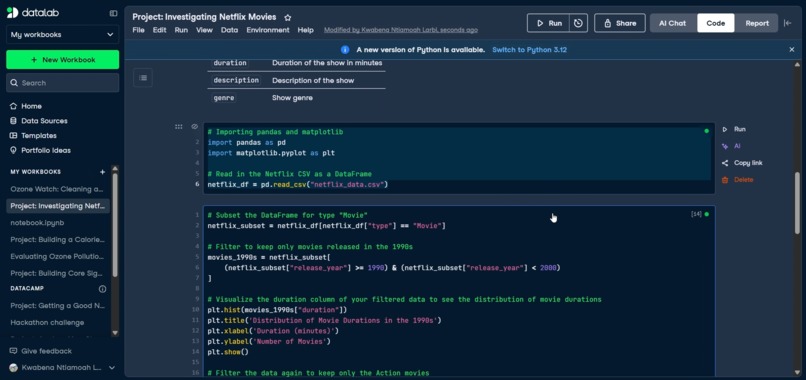
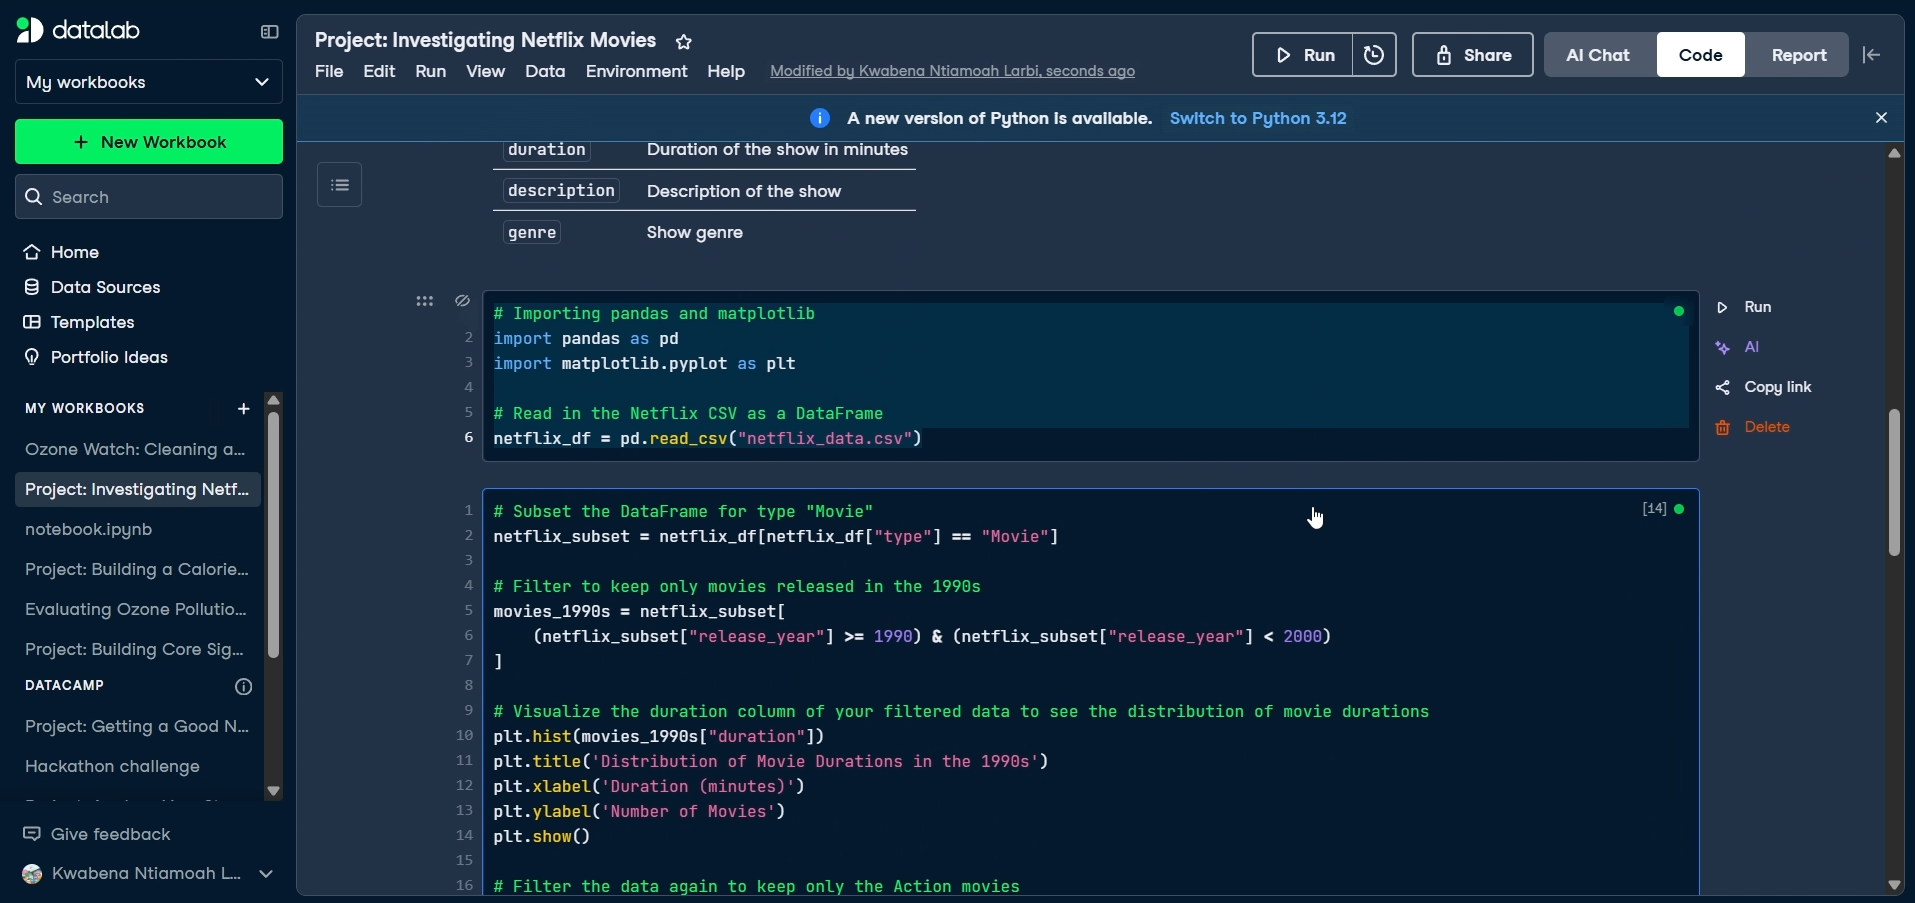
my datalab workbook on datacamp app
Inspiration
The inspiration for this project came from Netflix’s transformation into one of the largest entertainment platforms in the world. With such a vast catalog, it provides a unique opportunity to explore movie trends across decades. Focusing on the 1990s was motivated by the desire to revisit a nostalgic era in film history, uncover patterns in genres, runtimes, and global contributions, and draw insights that could inspire future media production.
What it does
The project performs exploratory data analysis (EDA) on Netflix’s dataset, focusing on movies released in the 1990s. It filters the data, visualizes trends in genres and runtimes, and highlights country-level contributions. The goal is to better understand the entertainment landscape of the 1990s and how it shaped today’s viewing experience.
How we built it
Collected and cleaned data from the provided netflix_data.csv. Used Python (Pandas, Matplotlib, Seaborn) for filtering and analysis. Created visualizations to show distribution of genres, movie lengths, and production countries. Organized everything into a structured Jupyter Notebook and Python script for reproducibility.
Challenges we ran into
Handling missing or incomplete data (e.g., missing directors or countries). Filtering movies by decade while excluding TV shows. Designing clear and interpretable visualizations that highlight meaningful insights.
Accomplishments that we're proud of
Successfully built a workflow that turns raw Netflix data into insights. Discovered interesting trends in 1990s movies (dominated by Hollywood, popular drama/comedy genres, and typical runtimes of 90–120 minutes). Made the analysis easy for others to replicate and extend.
What we learned
Improved skills in Python data analysis (Pandas, Matplotlib, Seaborn). Learned the importance of data cleaning and filtering before visualization. Understood how historical entertainment data can still inform modern-day media strategies.
What's next for Machination game
Expand the analysis to include other decades (1980s, 2000s, etc.) for comparison. Build an interactive dashboard (using Streamlit or Plotly Dash) so users can explore Netflix data themselves. Apply machine learning to predict popular genres or runtimes based on historical trends.
Built With
- datacamp.com
- python
- python3.8


Log in or sign up for Devpost to join the conversation.