
Inspiration
Our team has passion for high speed racing, its athletes, and the data that drives F1 teams to strive for the most performant vehicle. In a field with such competition, knowing is half the battle. We aim to provide a place for F1 fans to observe the stats and placements of their favorite racers on each track, and hopefully learn a little bit more about optimal F1 strategies!
What it does
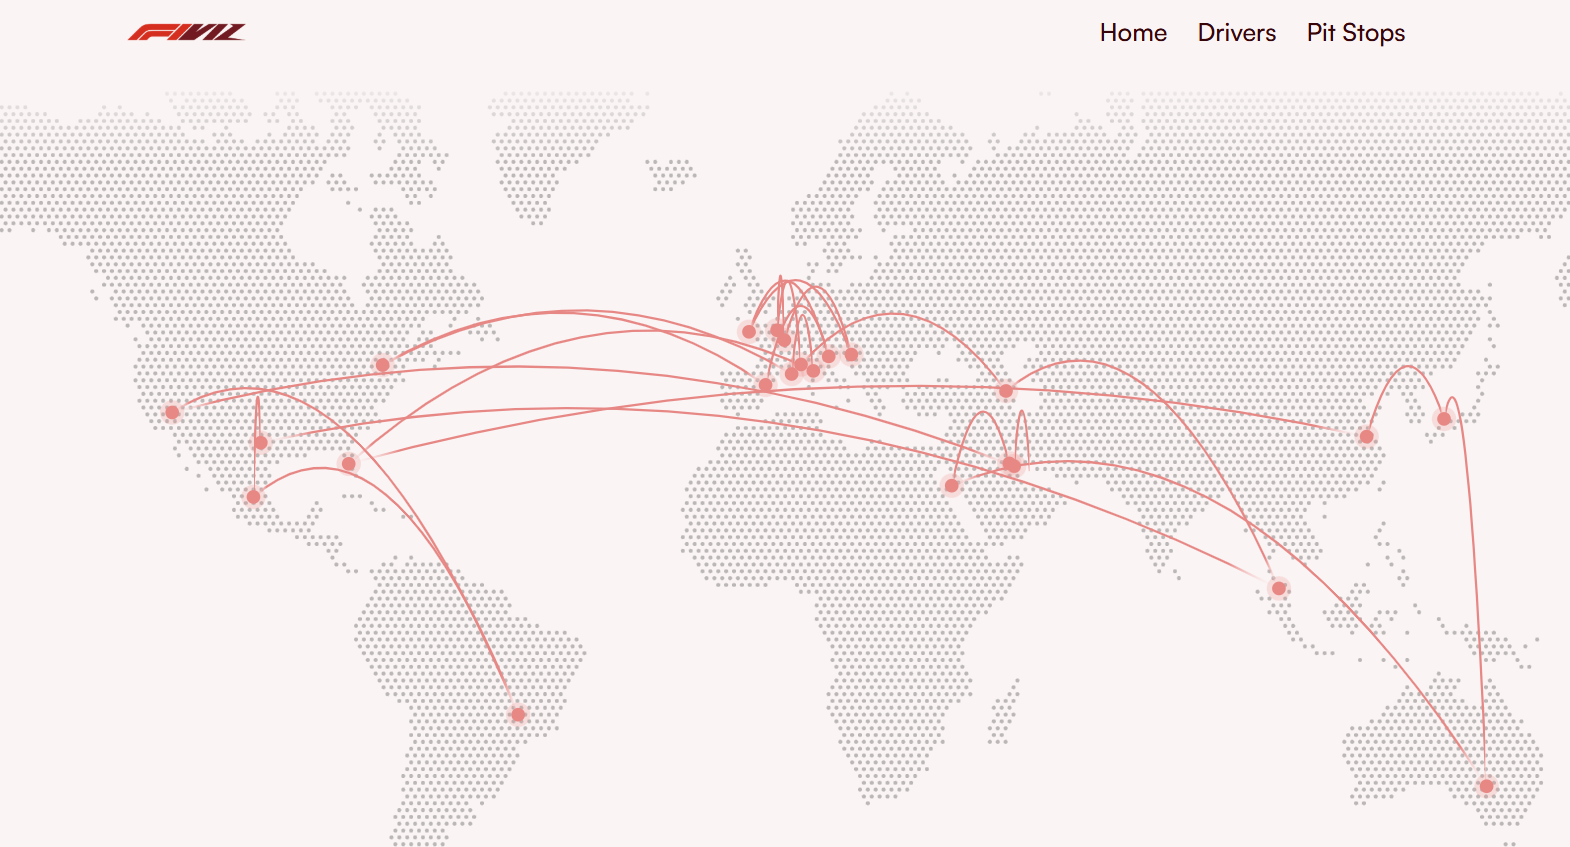
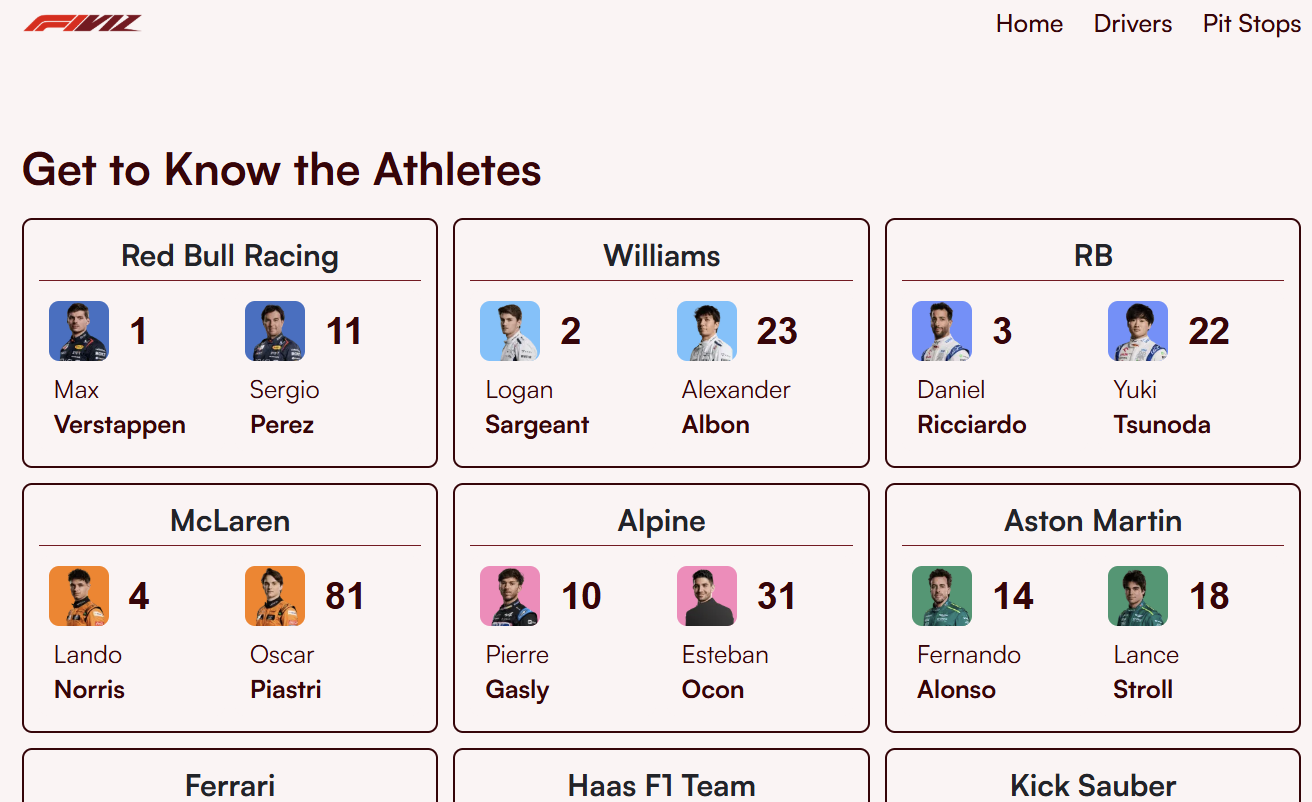
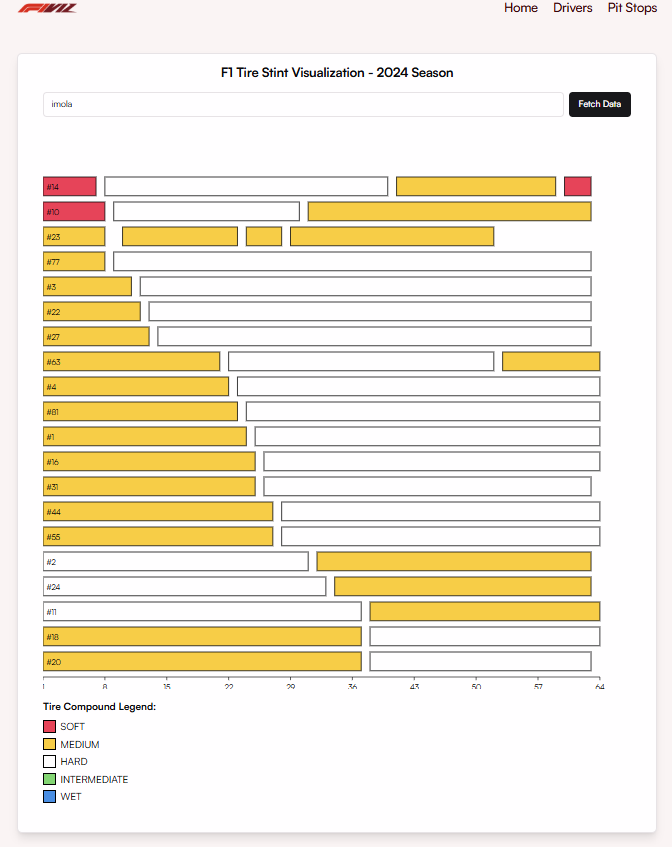
Our application makes use of telemetric data of past Formula 1 races to help visualize success metrics of top athletes such as driver/team statistics, the timing of their pit stops, or their choice of tire compound given the weather and track conditions for example.
How we built it
We used Typescript and Tailwind CSS, with the help of component libraries like shadcn/ui to build the Next.js v14 frontend of our website, which is hosted on vercel. API calls are made to an open source Formula 1 dataset to fetch relevant data and display it meaningfully on our site.
Challenges we ran into
At first, the API we chose seemed to have plenty of usable data. However, we found over the course of the project that with a lack of a reference point for each track, we could not make use of the car positioning coordinate data to place them on each track as we had pictured. We made the decision to instead place drivers on the track via their lap time data, resulting in a less precise, but still viable solution. In addition to this, our chosen API only provided very distinct endpoints, for which we could not query for data within the returned objects as if it were a relational database. This meant that we had to make many more API calls than would otherwise be needed, and used Typescript to sort or filter for the data we needed in each instance.
Accomplishments that we're proud of
As our first in person hackathon (at which some of us met for the first time), we’re excited that we succeeded in each having a hand in making significant portions of the application and managing to produce an adequate deliverable. We believe we made a strong team that encouraged each other to persist despite the many bugs and compilation errors.
What we learned
Some of our teammates learned Typescript, others learned about how to query an endpoint to receive outside data and parse it. Otherwise, we all learned how to work well and have a good time with new pals 😁
What's next for F1VIZ
The scope of our project ended up being quite large for the time we had. We would have loved to do more research into other sources of data that proved valuable to demonstrate just how much consideration is put into each choice made by teams on the track. There were also missing track coordinates so having all the 24 tracks mapped out in the future would be a next step. Another feature worth exploring would be the visualization of each driver's skillset in a Radial Chart to allow users to compare drivers' stats across different teams. We would also add components that show the weather conditions on the day of each race, and ways to simplify the searching process for drivers, grand prix and pit stop data across a wealth of years.
Built With
- nextjs
- tailwind
- typescript


Log in or sign up for Devpost to join the conversation.