-
-
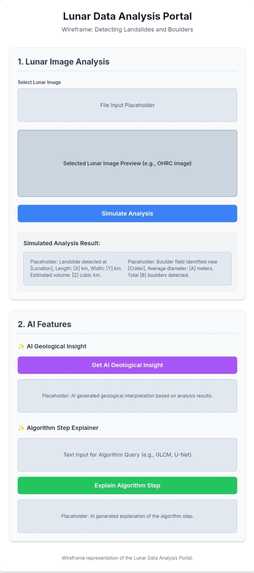
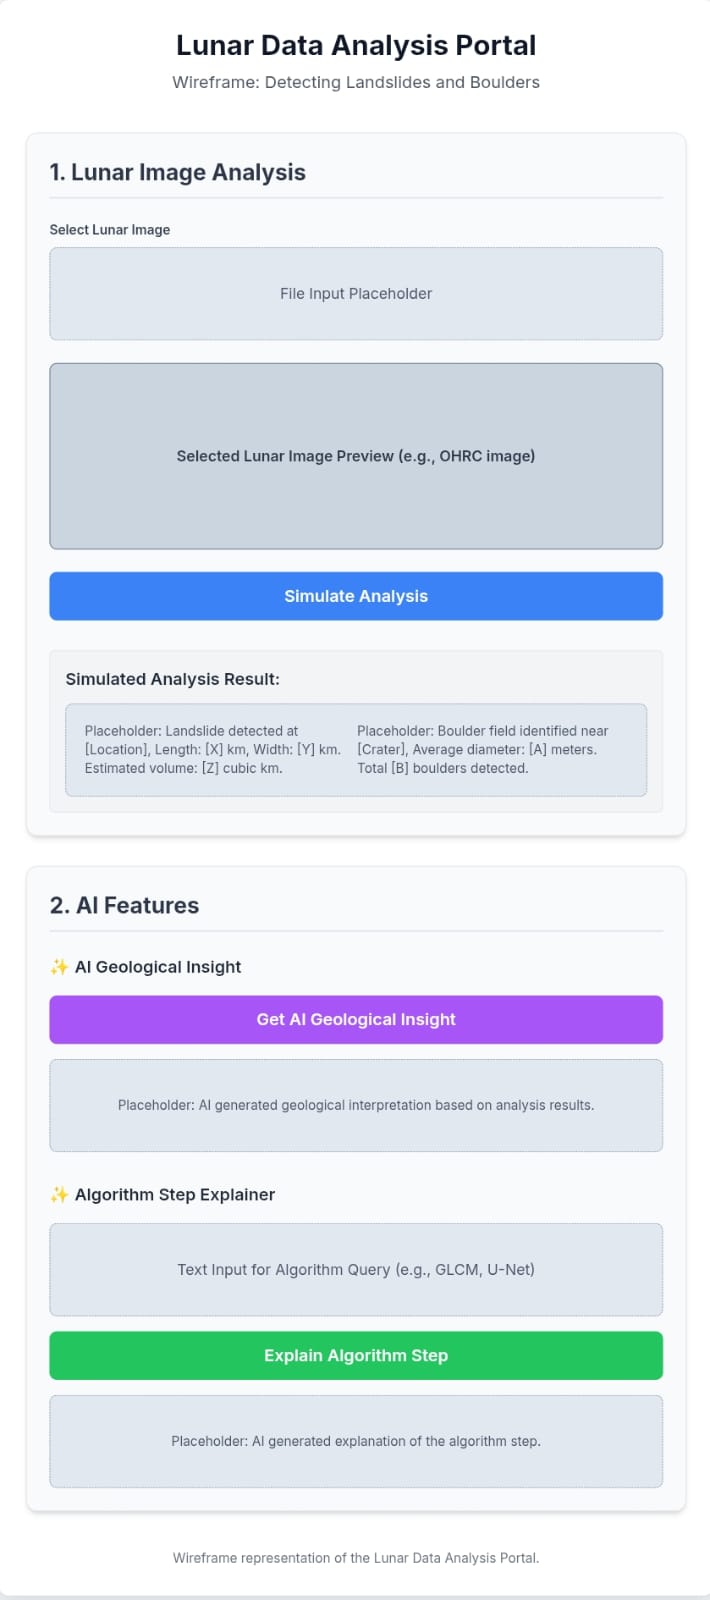
Mock diagram
ABOUT THE PROJECT
his project, developed as an interactive web application that demonstrates a novel algorithm for the autonomous detection and quantification of critical surface features on the Moon. It was built to showcase a solution for enhancing the safety of future lunar missions and contributing to planetary science.
INSPIRATION
My inspiration stemmed from the critical challenges facing modern space exploration. The data from missions like Chandrayaan-2 provides a wealth of information, but manually sifting through it to find hazards like landslides and boulders is a monumental task. I was motivated to create an automated, intelligent system that could not only detect these anomalies efficiently but also help interpret their significance for mission planners and scientists. The sheer volume and detail of the data from Indian space missions, especially the high-resolution imagery from the Chandrayaan program, presented a perfect opportunity to apply machine learning and AI to a real-world problem with global impact.
How we built it
The project was constructed as a single-page interactive web application to provide a seamless and engaging user experience. The core of the application's user interface was designed with HTML5 and styled using Tailwind CSS for a responsive, modern aesthetic.
The interactive elements were powered by Vanilla JavaScript. This included the step-by-step workflow explorer, the dynamic canvas for simulating detection on user-uploaded images, and all the event listeners that handle user input. For the AI-powered features, I integrated the Google Gemini API using JavaScript's fetch API. This allowed the application to generate geological insights and explain technical terms by sending text prompts to a large language model and displaying the responses.
The algorithm itself, while conceptually a multi-stage process involving deep learning and image processing, is demonstrated through visual simulations. The canvas-based detection, for example, dynamically draws bounding boxes and circles on uploaded images to illustrate how the algorithm would mark detected landslides, boulders, and craters.
CHALLENGES WE FACED
The primary challenge was translating a complex, multi-stage data science and machine learning pipeline into a cohesive and understandable interactive experience within a single HTML file. This involved several key hurdles:
Simulating Complex Processes: Since running a full machine learning model and image processing pipeline in a browser is not feasible, I had to create convincing and visually clear simulations of those processes. For instance, designing the canvas to draw random, yet realistic-looking, bounding boxes and circles was a creative solution to demonstrate the output of the detection modules.
Integrating the LLM: Correctly integrating the Gemini API, especially managing the API key and handling asynchronous fetch calls, required careful JavaScript implementation to ensure the application remained responsive.
Information Architecture: Structuring a detailed technical guide into an intuitive and non-linear format was crucial. I chose a stepper-based workflow and an accordion-style FAQ to make the information digestible and reduce cognitive load for the user.
WHAT WE LEARNED
This project was a significant learning experience, reinforcing my skills in several areas:
Frontend Development: Deepened my expertise in building responsive and dynamic user interfaces using modern web technologies.
UI/UX Design: Emphasized the importance of user-centered design, where a good information architecture can make complex data and processes much easier to understand.
API Integration: Gained practical experience in integrating a powerful LLM API to create genuinely useful, data-driven features in a web application.
Creative Problem-Solving: I learned to overcome technical limitations by devising effective and visually appealing simulations that still accurately convey a project's core concepts.

Log in or sign up for Devpost to join the conversation.