-
-
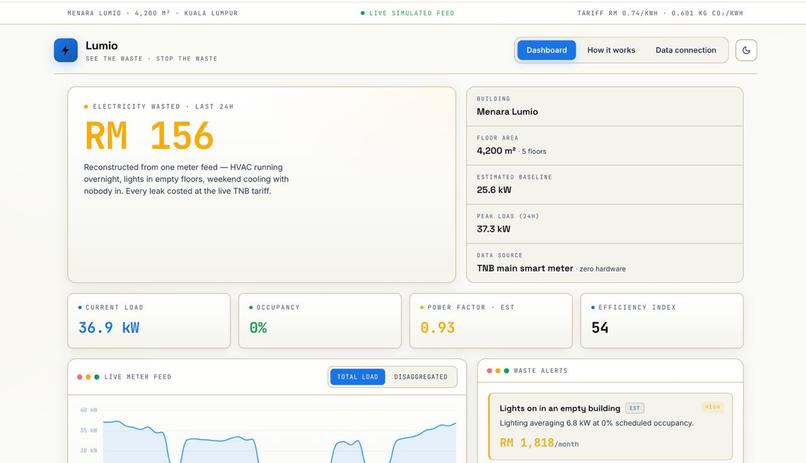
homepage
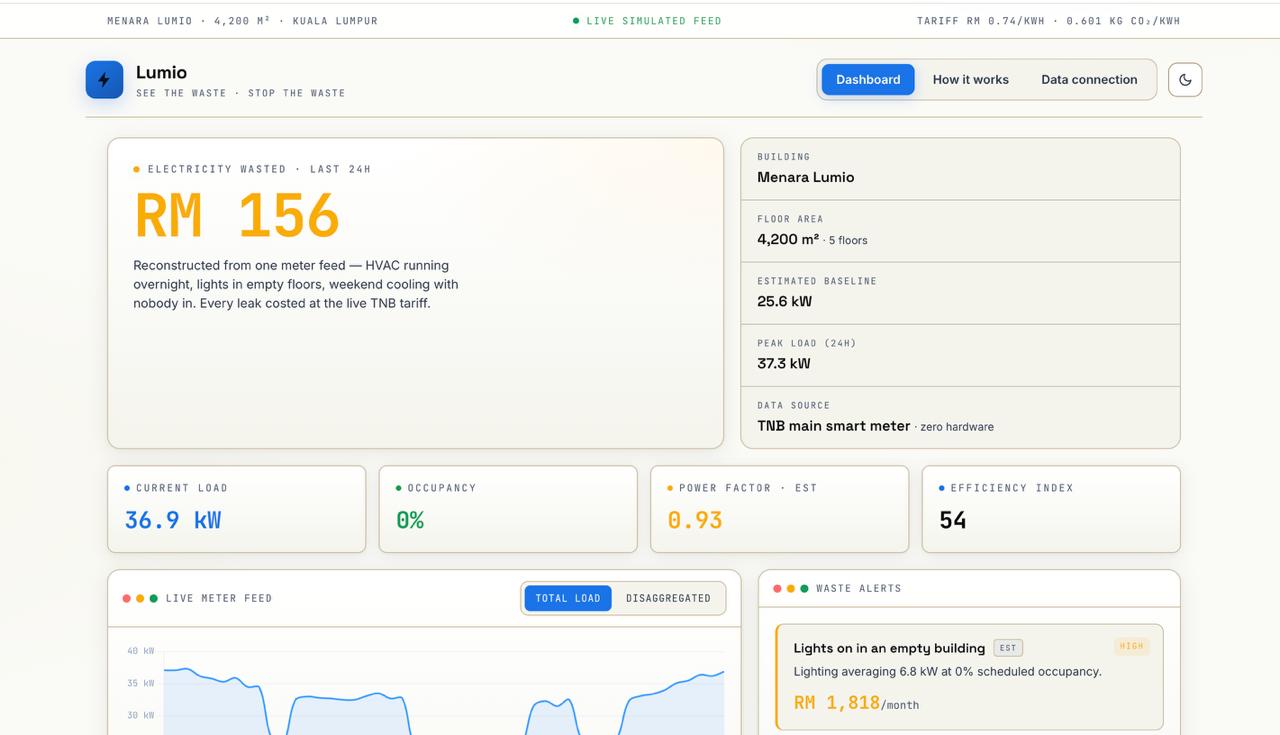
Lumio — Electricity Intelligence for Commercial Buildings
Team Red Sea · ImagineHack 2026 · Track 3 — DoubleDot: Smarter Resource Management
Inspiration
Walk into any commercial building in Malaysia at 2 AM and the lights are on. The HVAC is humming. The chiller is running full tilt for a building with zero occupants. Nobody planned it — it just never got turned off.
We kept asking: why does this happen in 2026? Smart meters are everywhere. TNB has deployed 4.5 million of them. Half-hourly consumption data is flowing to myTNB every single day. But building managers see only one number: the bill at the end of the month, after the waste has already happened.
The gap isn't hardware. The gap is intelligence. That's what Lumio is.
What We Built
Lumio is a zero-hardware electricity intelligence dashboard for commercial buildings. It reads the single total-kW figure your existing TNB smart meter already produces, reconstructs where every kilowatt is going — HVAC, lighting, office equipment, baseline — costs the waste in ringgit at the live tariff, and tells the building manager exactly what to do about it.
No sub-meters. No installation crew. No capital expenditure. Live the same day.
How We Built It
The core insight is that a building's electricity load has physical structure that can be decoded from a single time series.
The Disaggregation Engine
This is a rule-based form of Non-Intrusive Load Monitoring (NILM). The engine runs in three passes:
Step 1 — Find the floor (baseline):
Every building has an always-on minimum: servers, security systems, refrigeration, standby circuits. We find it by taking the lowest sustained reading in the 02:00–05:00 window — the quietest hours of the day.
$$ \text{baseline} = \min\left(\text{kW}\right)_{t \in [02{:}00,\ 05{:}00)} $$
Everything above that floor is discretionary load — load that can, in principle, be managed.
Step 2 — Read the calendar, not a sensor:
Occupancy detection without occupancy sensors. If the building's operating hours say it's empty, it's empty. The occupancy fraction uses a smoothed triangular profile over the business day to avoid hard edges at open/close:
$$ f_{\text{occ}}(t) = \max!\left(0.15,\ \min!\left(1,\ 1.25 \cdot \left(1 - \frac{\left|t - t_{\text{mid}}\right|}{t_{\text{half}}}\right)\right)\right) $$
The 0.15 floor prevents boundary intervals from being misclassified as empty while daytime HVAC is already ramping — a subtle but important invariant we caught during testing.
Step 3 — Attribute the remainder:
Load above the baseline splits by time-of-day physics. HVAC dominates during business hours; lighting share rises sharply when the building should be dark.
$$ \text{remainder} = \text{total_kW} - \text{baseline} $$
$$ \text{If occupied:} \quad \text{HVAC} = 0.55 \cdot r, \quad \text{Lighting} = 0.18 \cdot r $$
$$ \text{If empty:} \quad \text{HVAC} = 0.70 \cdot r, \quad \text{Lighting} = 0.80 \cdot r \quad \leftarrow \text{waste} $$
$$ \text{waste}{\text{RM}} = \left(\text{HVAC}{\text{empty}} + \text{Lighting}_{\text{empty}}\right) \times 0.74\ \text{RM/kWh} $$
The accuracy is directional — ±10–15% — which is standard for single-meter NILM. Every estimated figure carries an "est" badge in the UI. We were deliberate about this: the goal is waste detection, not sub-meter precision, and ±10% is more than enough to find a chiller running at 3 AM on a Sunday.
The Stack
Deliberately minimal. HTML5, vanilla CSS, vanilla JavaScript (ES modules). Chart.js for visualisation, vendored locally so it works offline. No framework, no bundler, no server. The full engine runs client-side — double-click index.html and it works.
This was a conscious architectural choice: a zero-dependency, offline-first tool can be deployed to any building manager's laptop in seconds, which aligns with the zero-friction product thesis.
Challenges
The boundary problem. The occupancy model at the open/close boundary kept misclassifying real load as waste. At 08:00, the HVAC has already been running for 30 minutes — but the calendar says the building just opened. The triangular profile with the 0.15 floor fixed this, but it took several iterations of watching the disaggregated chart drift before we understood what was happening.
Honest uncertainty. We spent real time debating how to present estimates that are directionally right but not precisely right. The answer we landed on — "est" badges everywhere, a plain-language accuracy statement in the UI, a dedicated "How it works" tab that shows the actual formula — felt like the right call. Building trust with the user matters more than hiding the seams.
Scope vs. time. We had three data modes planned from day one: live feed, CSV upload, and myTNB OAuth. The OAuth flow is a mock in this demo — a deliberate, clearly labelled mock. We chose depth on the engine and dashboard over a fake integration that would mislead a judge. The CSV path is real and works with actual TNB export files.
Making the business case legible. The technical output of the engine is kilowatt-hours. But building managers think in ringgit and payback periods. The business case panel — customer saves / subscription cost / return / payback — was added late and required translating every engine output into something a CFO would recognise.
What We Learned
- NILM is underrated. The field has existed for decades, but deployment has historically required expensive hardware. The combination of ubiquitous smart meters + client-side compute makes purely algorithmic disaggregation viable at scale in a way it wasn't five years ago.
- Constraints sharpen products. "Zero hardware, live the same day" wasn't a marketing line — it was an engineering constraint that forced every design decision. The CSV upload exists because the OAuth can't be real in a hackathon. The offline-first architecture exists because you can't guarantee wifi in a building basement.
- Honesty is a feature. Showing ±10–15% accuracy prominently, labelling every estimate, explaining the formula in plain steps — these made the demo stronger, not weaker. Judges and users trust what they can audit.
What's Next
Lumio Pro: same dashboard, same engine, optional sub-metering for buildings that want per-circuit precision. Lumio API: an endpoint that any BMS can call. And the real myTNB integration — the handshake is mocked here, but the data model is designed for it.
4.5 million smart meters. The intelligence layer is missing. Lumio is it.
Built With
- chart.js
- css3
- html5
- javascript
- vanilla

Log in or sign up for Devpost to join the conversation.