-
-
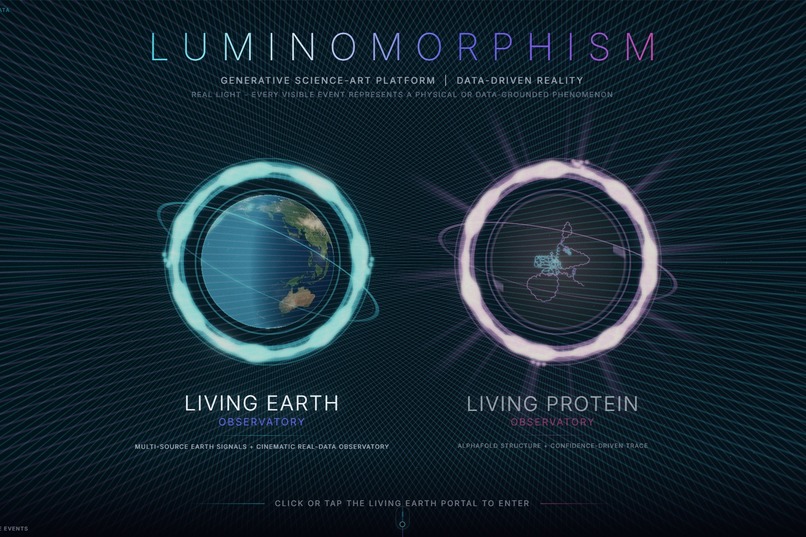
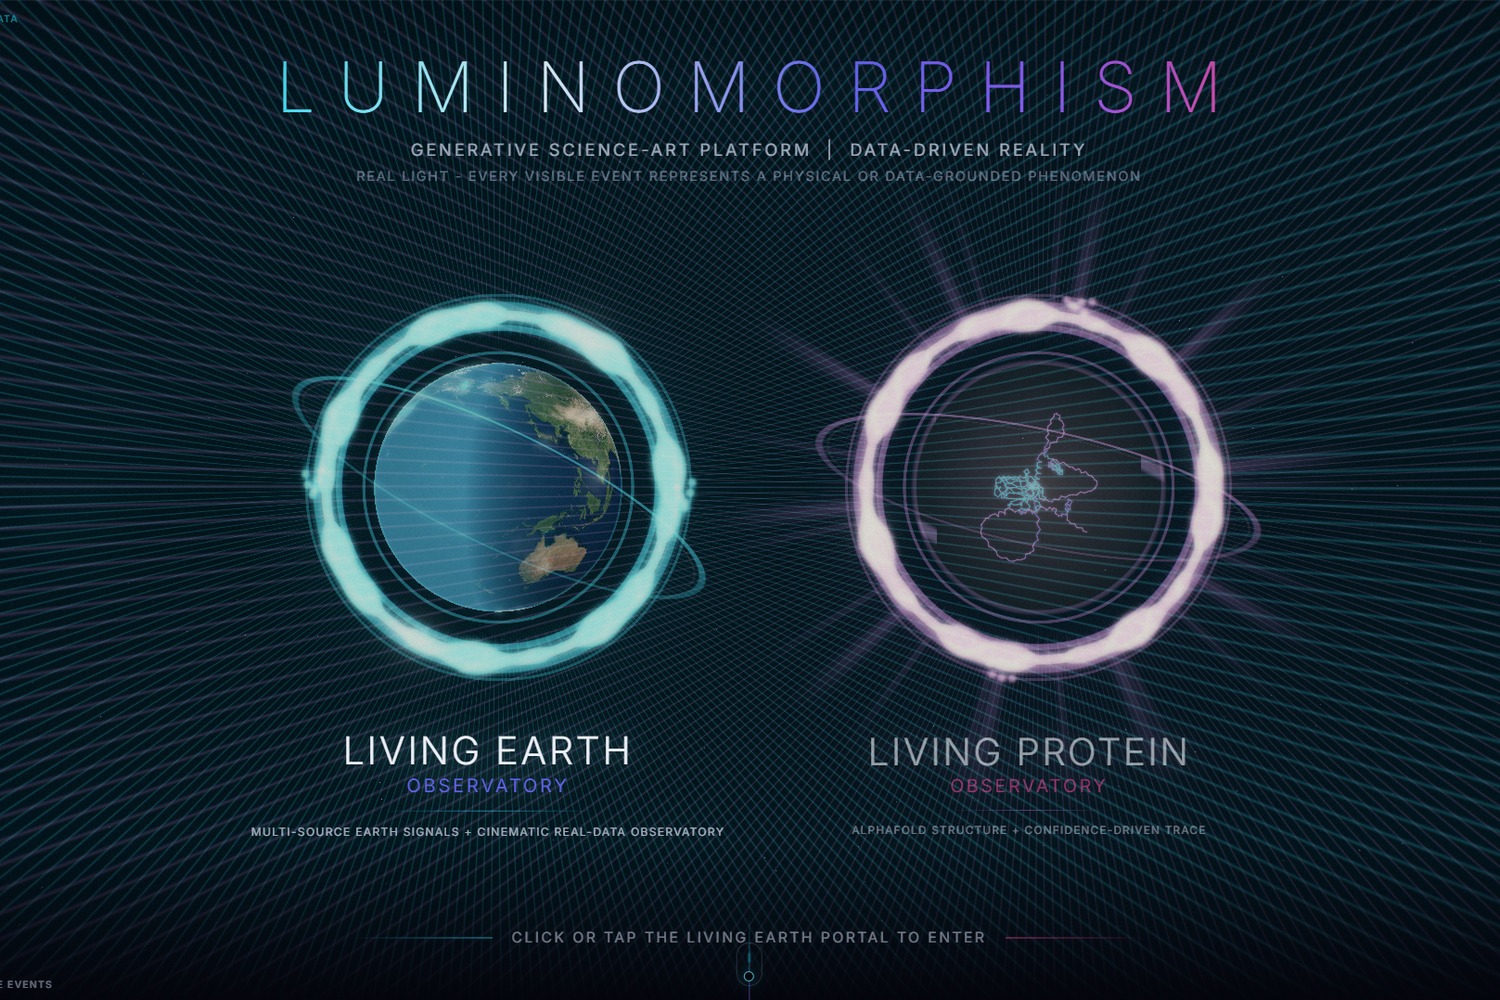
Luminomorphism Orbital Data Atlas — Living Earth and Living Protein observatories.
Inspiration
Scientific visualization can be visually impressive and still be misleading if viewers cannot tell what was measured, predicted, physically modeled, interpreted, or generated as a fallback.
Luminomorphism began as Living Earth, a cinematic, data-grounded Earth observatory. During OpenAI Build Week, I extended the existing project into a modular scientific runtime capable of hosting multiple observatories while keeping provenance, capabilities, lifecycle boundaries, and failure states visible.
The project existed before Build Week. I therefore defined a precise baseline and documented the eligible contribution separately through seven focused Git commits created during the official submission period.
What it does
The Orbital Data Atlas currently hosts two working scientific observatories.
Living Earth
Living Earth combines:
- NASA EONET natural-event data
- USGS earthquake feeds
- NOAA aurora data
- NASA GIBS imagery
- optional NASA FIRMS and GDACS data
- astronomical lighting and Earth day/night state
- Moon position and phase
- ISS tracking and orbital propagation
Living Protein
Living Protein combines:
- AlphaFold predicted protein structures
- per-residue pLDDT model confidence
- UniProt functional annotations
- curated protein model selection
- explicit distinction between prediction confidence and experimental evidence
Build Week contribution
During Build Week, I transformed the existing application into a reusable, evidence-aware observatory platform.
The new runtime adds:
- a shared observatory module contract
- a controlled module lifecycle and host
- dynamic mounting of Earth and Protein from the same Atlas
- capability and source-provenance registries
- unified Earth and Protein data runtimes
- persistent caching and request coalescing
- retries, timeouts, and controlled stale fallback
- source-time and diagnostic metadata
- explicit classification of observed data, predictions, physical models, interpretations, and fallback output
How I built it
I used Codex with GPT-5.6 Sol to analyze the pre-existing architecture, trace cross-module dependencies, define safe module boundaries, implement the shared lifecycle, consolidate data access, and validate behavior across the Atlas, Living Earth, and Living Protein.
Codex was particularly useful for reasoning across a mature codebase where a local change could affect rendering, data loading, observatory mounting, diagnostics, or cleanup behavior elsewhere.
I retained final responsibility for the product direction, scientific distinctions, architecture decisions, visual design, testing priorities, and acceptance of every implementation change.
The application is built with browser-based JavaScript ES Modules, WebGL, and Three.js. A small optional Node.js proxy supports providers without browser-friendly CORS and local H.264 conversion.
No OpenAI API key is required to run the application. GPT-5.6 was used through Codex as the development partner, not as a runtime dependency inside the product.
Challenges
The main challenges were:
- extending a mature visual project without destabilizing its existing runtime
- making two scientifically different observatories obey one lifecycle contract
- preserving provenance and failure semantics across many external providers
- preventing fallback output from being silently presented as live data
- avoiding false scientific certainty
For example, AlphaFold pLDDT is presented as model confidence, not measured biological certainty. Procedural atmospheric phenomena are also kept distinct from live observations.
Accomplishments
I am proud that the Build Week work:
- converted an existing single-domain experience into a multi-observatory platform
- preserved the stable visual systems instead of rewriting them
- added a coherent lifecycle for dynamically mounted observatories
- unified Earth and Protein data access under shared runtime infrastructure
- made provenance and capabilities part of the visible product experience
- preserved graceful degradation when external providers fail
- passed syntax, import, caching, runtime-resilience, diagnostic, and replay validation
What I learned
For scientific interfaces, reliability is not only uptime.
Reliability also means being able to explain:
- where a signal came from
- when it was produced
- how it was transformed
- whether it is observed, cached, predicted, modeled, interpreted, or fallback
A scientifically responsible visualization should preserve that context even when the final experience is cinematic.
What's next
The next steps are:
- extracting the observatory contract into a documented toolkit
- adding more observatories across climate, materials, and topological systems
- expanding historical-time replay and diagnostic snapshots
- adding automated contract tests for future observatory adapters
- developing a broader scientific visualization platform across multiple scales
Built with
Codex, GPT-5.6 Sol, JavaScript ES Modules, WebGL, Three.js, Node.js, optional FFmpeg, NASA EONET, NASA GIBS, NASA FIRMS, USGS, NOAA SWPC, GDACS, AlphaFold DB, UniProt, Astronomy Engine, and satellite.js.

Log in or sign up for Devpost to join the conversation.