-
-

Website Preview
-

Website Preview
-

Website Preview
-

Website Preview
-

Website Preview


Visit Our Website
Our Inspiration and Process
The on-going Covid19 Pandemic has caused great disruption in all aspects of human life. While protecting lives must remain our priority, lockdown measures have a significant impact on the economy and thus jeopardize prosperity and development all over the world. Leaders are faced with the need to make decisions that both minimize the risk of losing lives and protect the economy. Decisions regarding the loosening or tightening of lockdown restrictions are critical and need to be based on reliable information.
Kevin Systrom (2020a) proposed the use of the effective reproduction number (Rt) as a metric we can use to make such decisions, in his work he calculates Rt for every state in the US and indicates in which ones the presence of the virus is likely to be at a manageable level. If Rt is above 1, restrictions should not be lifted, if Rt is considerably below 1, there will be a lesser risk associated with lifting lockdown measures. Systrom also suggests that local calculations of Rt could help more effective management of the pandemic.
Systrom’s model for Rt calculation is based on the work of Bettencourt and Ribeiro (2008) who use Bayesian modeling to find Rt using the number of new daily cases as input. Systrom proposed the addition of Gaussian noise to account for changes in time (Systrom, 2020b).
We present a solution based on Systrom’s work. Using the available datasets from John Hopkin’s University(https://raw.githubusercontent.com/CSSEGISandData/COVID-19/master/csse_covid_19_data/csse_covid_19_time_series/). We use Systrom’s model to calculate Rt at the county level, for all counties in the US with at least 5 new cases at any time. We then proceed to use time-series analysis (ARIMA) to create a prediction for the number of new cases during the upcoming week.
Information is presented through a web app that will allow for county selection, and display Rt values and predicted new cases for the next week. All Rt calculations and predictions will be automatically updated once every day after they become available from JHU’s repository.
We hope our work tackles the following critical issues in the handling of the pandemic:
Access to a unified and standardized metric that provides feedback on the effectivity of lockdown measures
Information about the Pandemic’s evolution at a local level
The possibility of doing short-term planning based on predictions of new cases
Forecasting with ARIMA
Since we are dealing with time-series data, we decided to use an Auto-Regression Integrated Moving Average (ARIMA) model to forecast how many new confirmed cases of Covid-19 will appear in the next week. Our model performs a stepwise search for the optimal parameters for each county and then forecasts the next 7 days.
An ARIMA model works by looking at current and previous time-lags in a regression to predict the next value. The integrated part of the ARIMA model works to make a time-series stationary, which is a requirement for it to work. Then it also uses the moving average in its regression calculations.
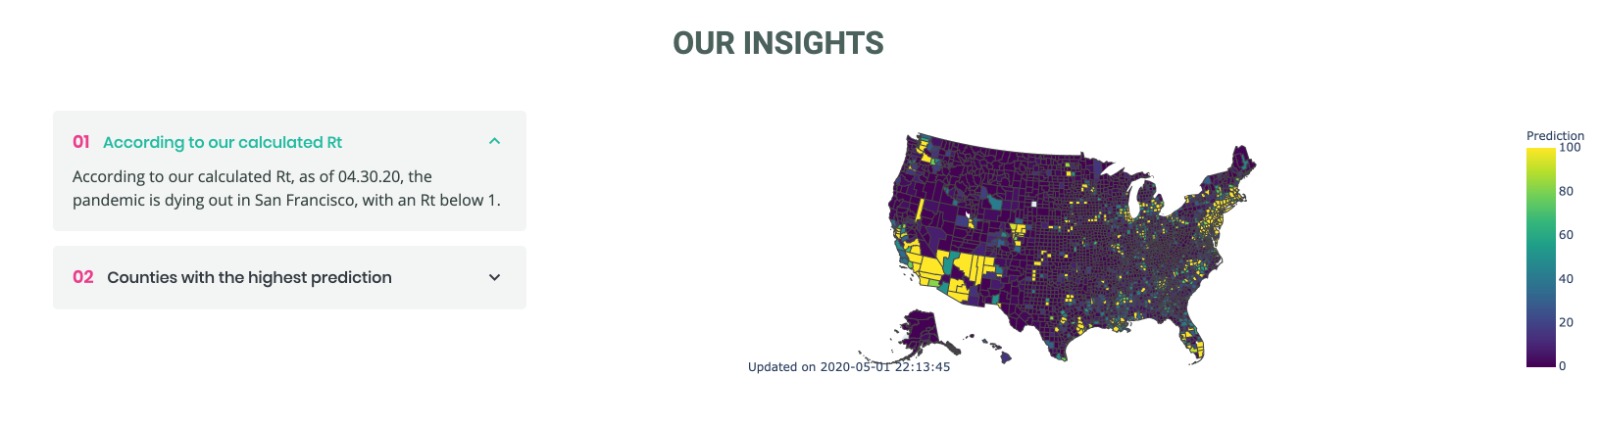
Insights
Insights
According to our calculated Rt, as of 04.30.20, the pandemic is dying out in San Francisco, with an Rt below 1. The five counties with the highest predicted new cases over the next week, from 04.30.20, are: New York City, New York, 19077 Cook, Illinois, 11186 Los Angeles, California, 6642 Philadelphia, Pennsylvania, 3484 Middlesex, Massachusetts, 3435
Challenges We Faced
One of the challenges we faced was how many counties didn't have a lot of cases, which made using Bayesian modelling to calculate Rt for all the counties infeasible. Infrequent data sampling from different sources made it hard to combine our datasets (in the case of Google mobility data versus John Hopkins' data)
Github and instructions on how to run it
Clone the repository. Open up a command prompt and enter the server folder. Then run the server.py script. If you don’t comment out the get_predictions() the process will take over an hour to run because it does a small grid search for all of the time-series. This is meant to be up and running, pulling new data once a day and recalculating Rt and the forecast, hence why start-up speed wasn’t our biggest concern.
Sources
https://github.com/CSSEGISandData/COVID-19/tree/master/csse_covid_19_data/csse_covid_19_time_series
Systrom, K. (2020a). The Metric We Need to Manage COVID-19. Retrieved from http://systrom.com/blog/the-metric-we-need-to-manage-covid-19/ on 04/20/2020
Systrom, K. (2020b). Estimating COVID-19's Rt in Real-Time. Retrieved from https://github.com/k-sys/covid-19/blob/master/Realtime%20R0.ipynb on 04/20/2020
Bettencourt, L. M. A., & Ribeiro, R. M. (2008). Real Time Bayesian Estimation of the Epidemic Potential of Emerging Infectious Diseases. PLoS ONE, 3(5). doi: 10.1371/journal.pone.0002185


Log in or sign up for Devpost to join the conversation.