Inspiration
California is leading the charge against fossil fuels, with a growing push to get households onto solar energy. But despite the initiative, there's no easy way for the average homeowner to understand their real energy impact, how much solar they're actually generating, how much carbon they're still emitting, and how they compare to the people living right next to them.
We also wanted Lumines to be community-centric at its core, not just a personal tool, but a living platform powered by the people who use it. By simply uploading their monthly utility bill, homeowners contribute real consumption data that enriches our database, making the energy and carbon comparisons more accurate and credible for every household in California. The more people contribute, the sharper and more meaningful the data becomes for everyone.
What it does
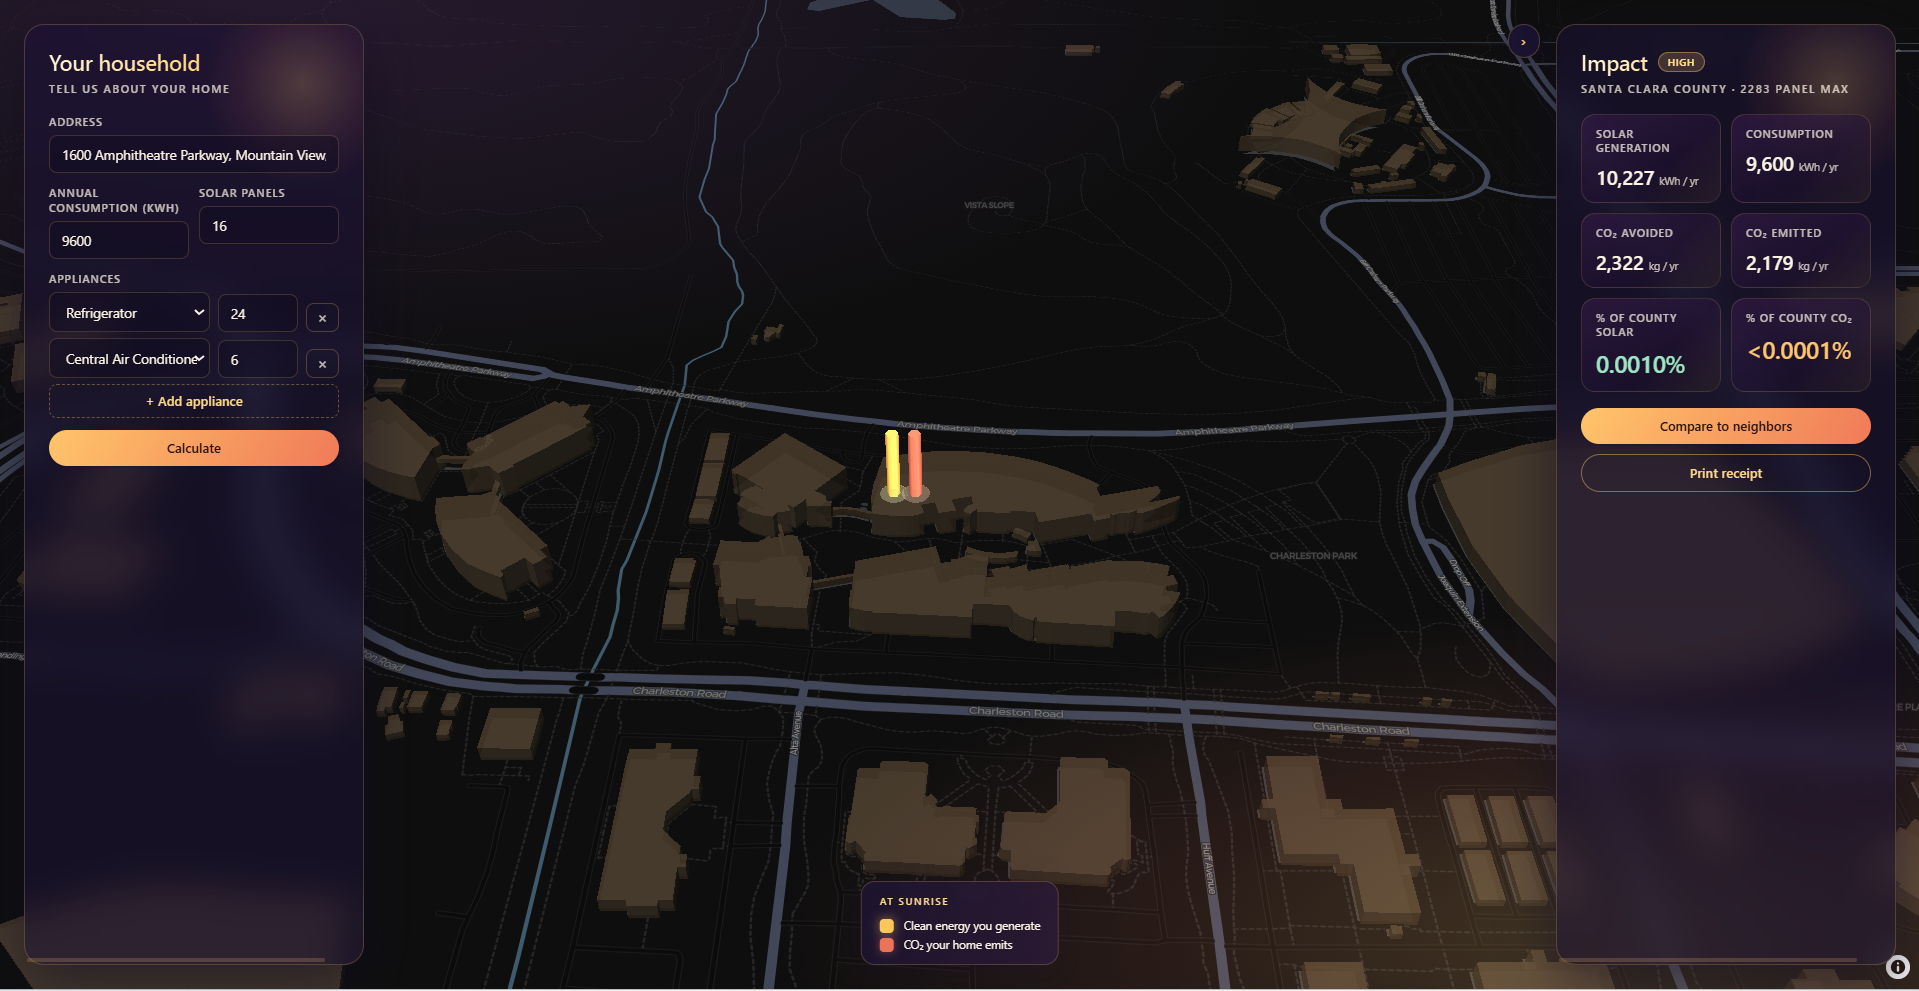
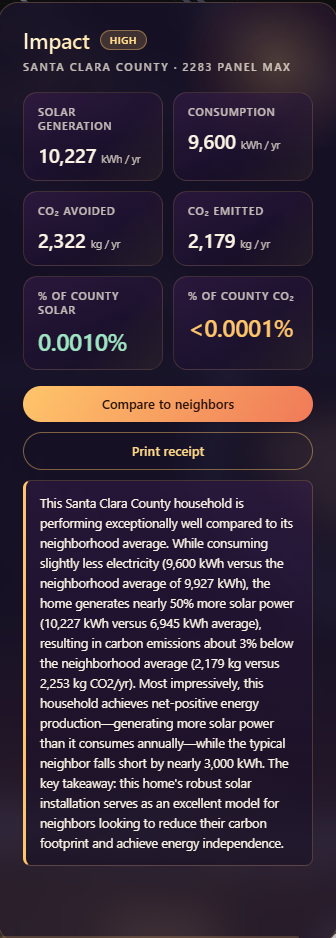
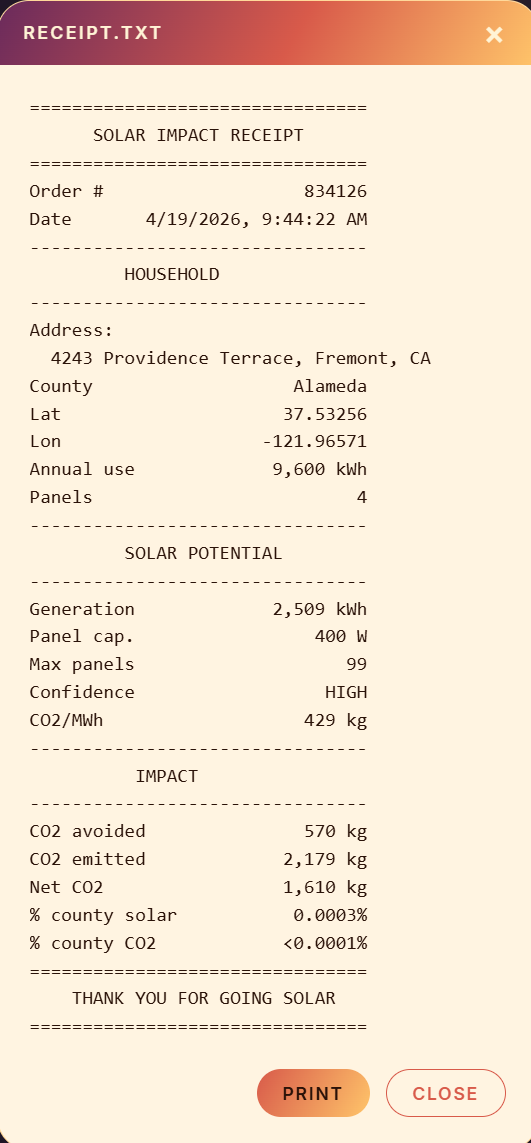
Lumines turns any address into a real-time solar and carbon impact visualization. Enter your home address, your appliances, and your energy consumption — and within seconds Lumines renders a 3D interactive map showing exactly how much solar energy your household generates annually, what your carbon footprint looks like, and how you stack up against your neighbours and your wider community. You can also simulate adding more solar panels and instantly see the impact on your carbon emissions.
How we built it
We built Lumines using React and TypeScript on the frontend with a Flask backend. We used AWS Location Service for address geocoding, Google's Solar API to pull real solar potential data for each location, and AWS for cloud infrastructure. The 3D map is rendered using Mapbox, giving users a striking and intuitive visual of their neighbourhood's energy profile. We also utilized Claude Sonnet 4.5 through AWS Bedrock Services.
Challenges we ran into
Implementing AWS Location Service for address geocoding took quite some time, as our team has never utilized Amazon Web Services to create an end-to-end project at such a fast pace. Getting the accounts set up, having our local environments well-equipped with the required API keys, and configuring the API calls to focus on the State of California for our current project scale was a daunting task, but quite rewarding at the same time.
Another difficult element to implement was Google's Solar API, which was central to our product. The tool's immense wealth of data available simply based on the location of a home or building was something we hoped to scale with our product. However, this was not an easy task. Connecting a user-friendly address input interface, while using the AWS Location API, and extracting the coordinates of the user's input to feed into Google's API to get our required solar data was a confusing process. It involved pipelining data from two different services and rendering it at a fast rate to the user on a visual map, which was hard, but worth it for the dynamic functionality and the intentional use of AWS services that we held paramount throughout our project.
Accomplishments that we're proud of
We are proud of our ability to work as a team and create a meaningful tool that helps users go beyond the confusing layout of their monthly utility bills. Seeing our tool truly fill a gap in our users' understanding of their contribution to solar energy use not only builds our confidence as developers creating real products, but reminds us that we are building not for ourselves, but for a larger audience with a greater impact in sight.
What we learned
AWS Location Services & Geocoding AWS Bedrock API Service Google Solar API MapLibre for Open-Source Maps React And TypeScript Made intentional use and optimized the outputted data from our API calls to render only meaningful data for our users, and also ensure fast rendering of our 3D visualizations.
What's next for Lumines
Community is at the heart of Lumines . The platform is designed to grow smarter the more people use it, and in the future, homeowners will be able to upload their monthly utility bill directly to Lumines , contributing real consumption data that enriches the platform's database and makes energy and carbon comparisons more accurate and credible for every household in California. The more people contribute, the sharper and more meaningful the picture becomes for everyone.
Built With
- amazon-location-service
- amazon-web-services
- bedrockapi
- claude
- deck.gl
- flask
- maplibre
- react
- solarapi
- typescript

Log in or sign up for Devpost to join the conversation.