Inspiration
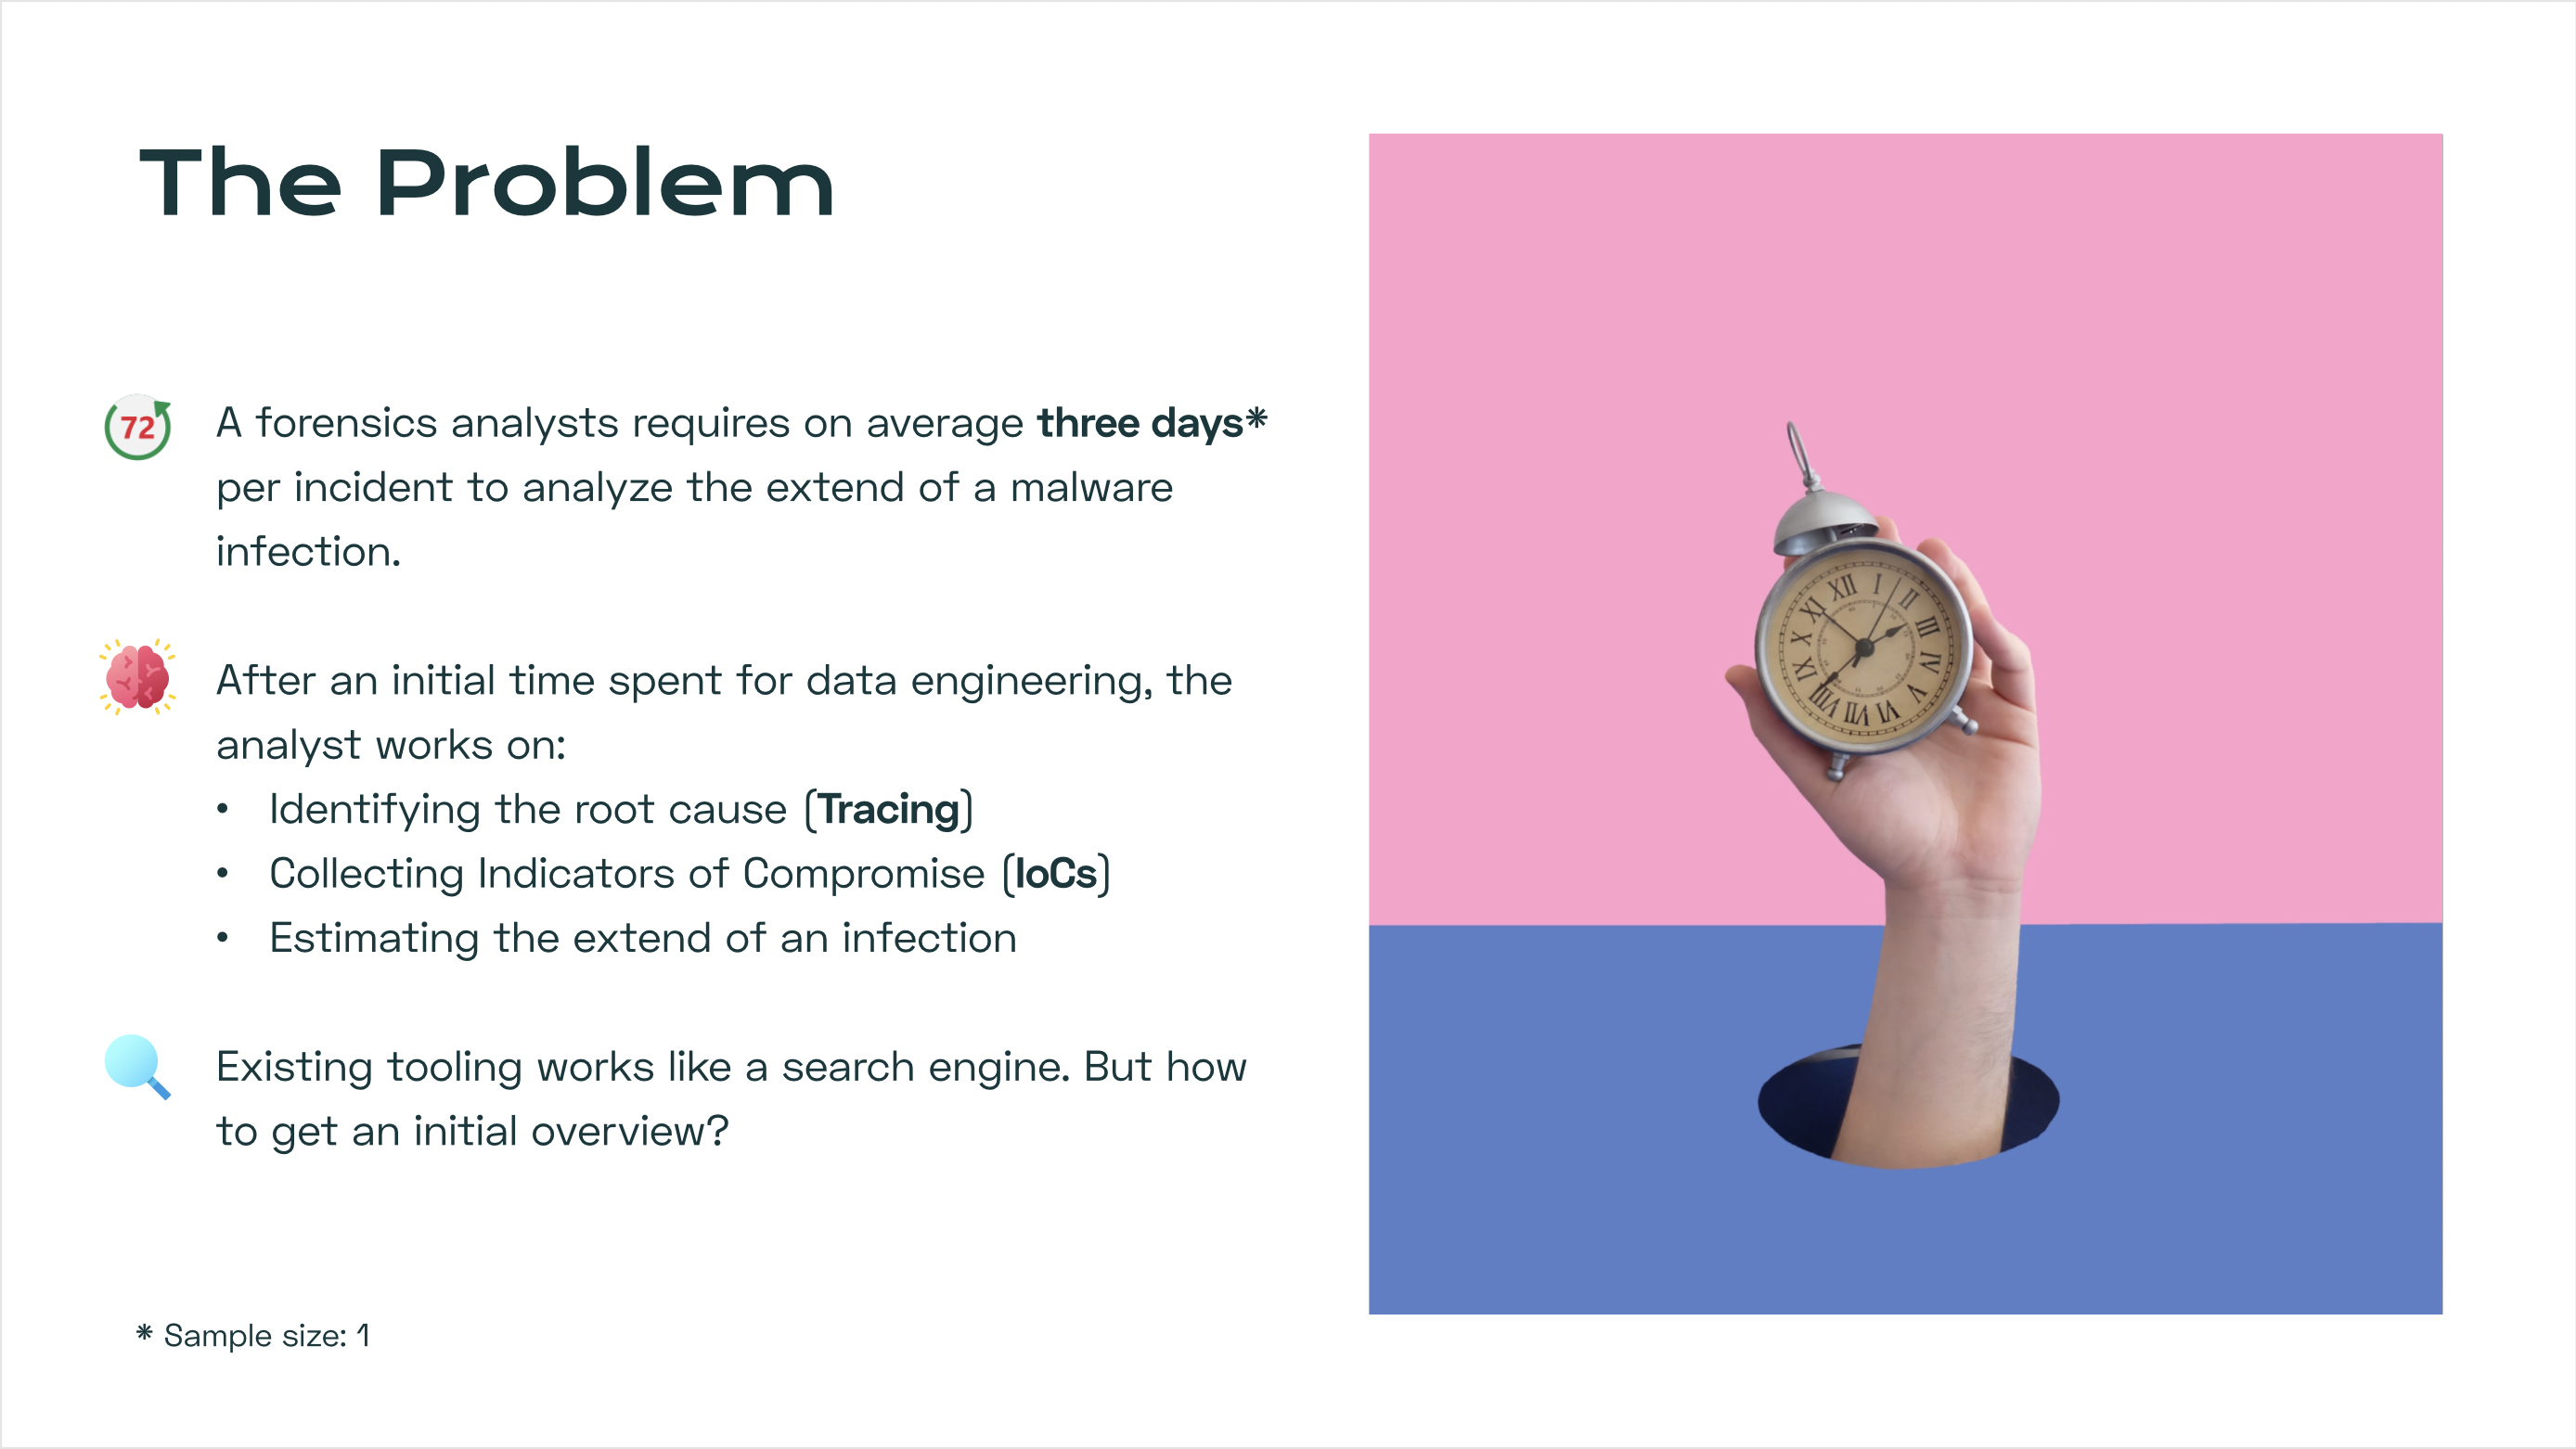
Forensics analysts can spend days tracing for relevant information from log sources and other artifacts. A tool that provides a graphical visualization of the relations between different artifact pieces and help to accelerate this process massively.
What it does
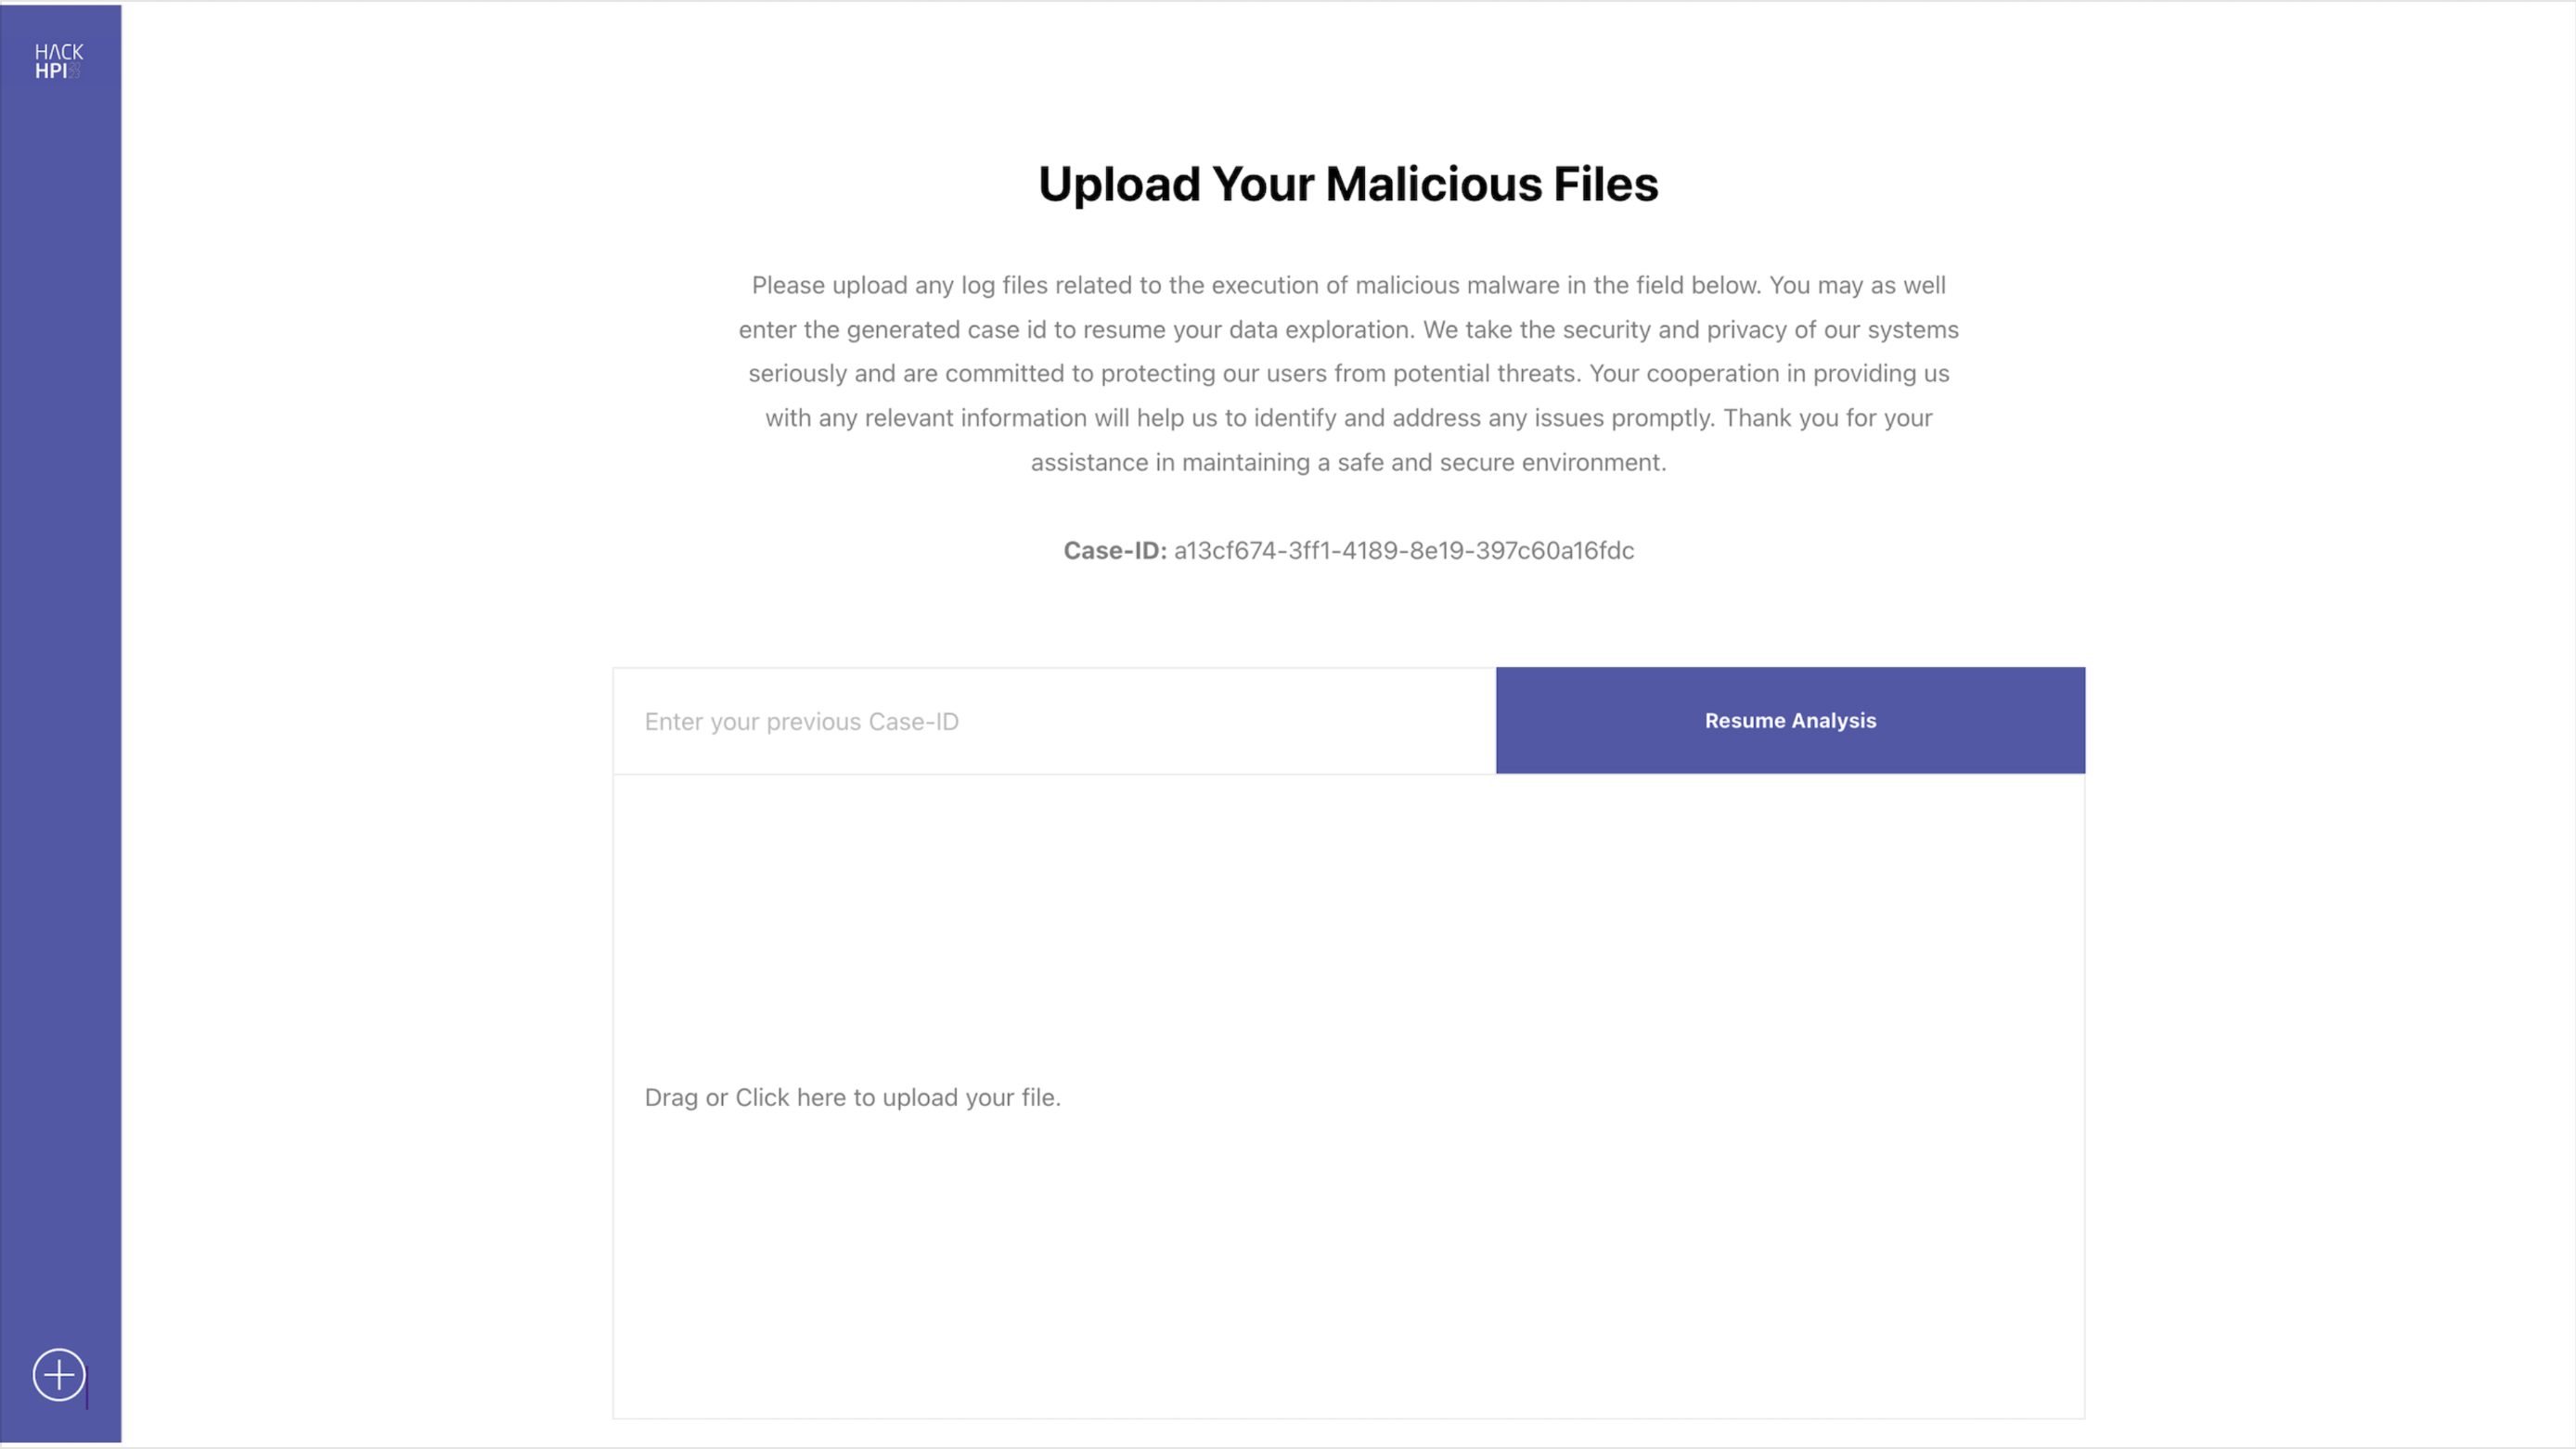
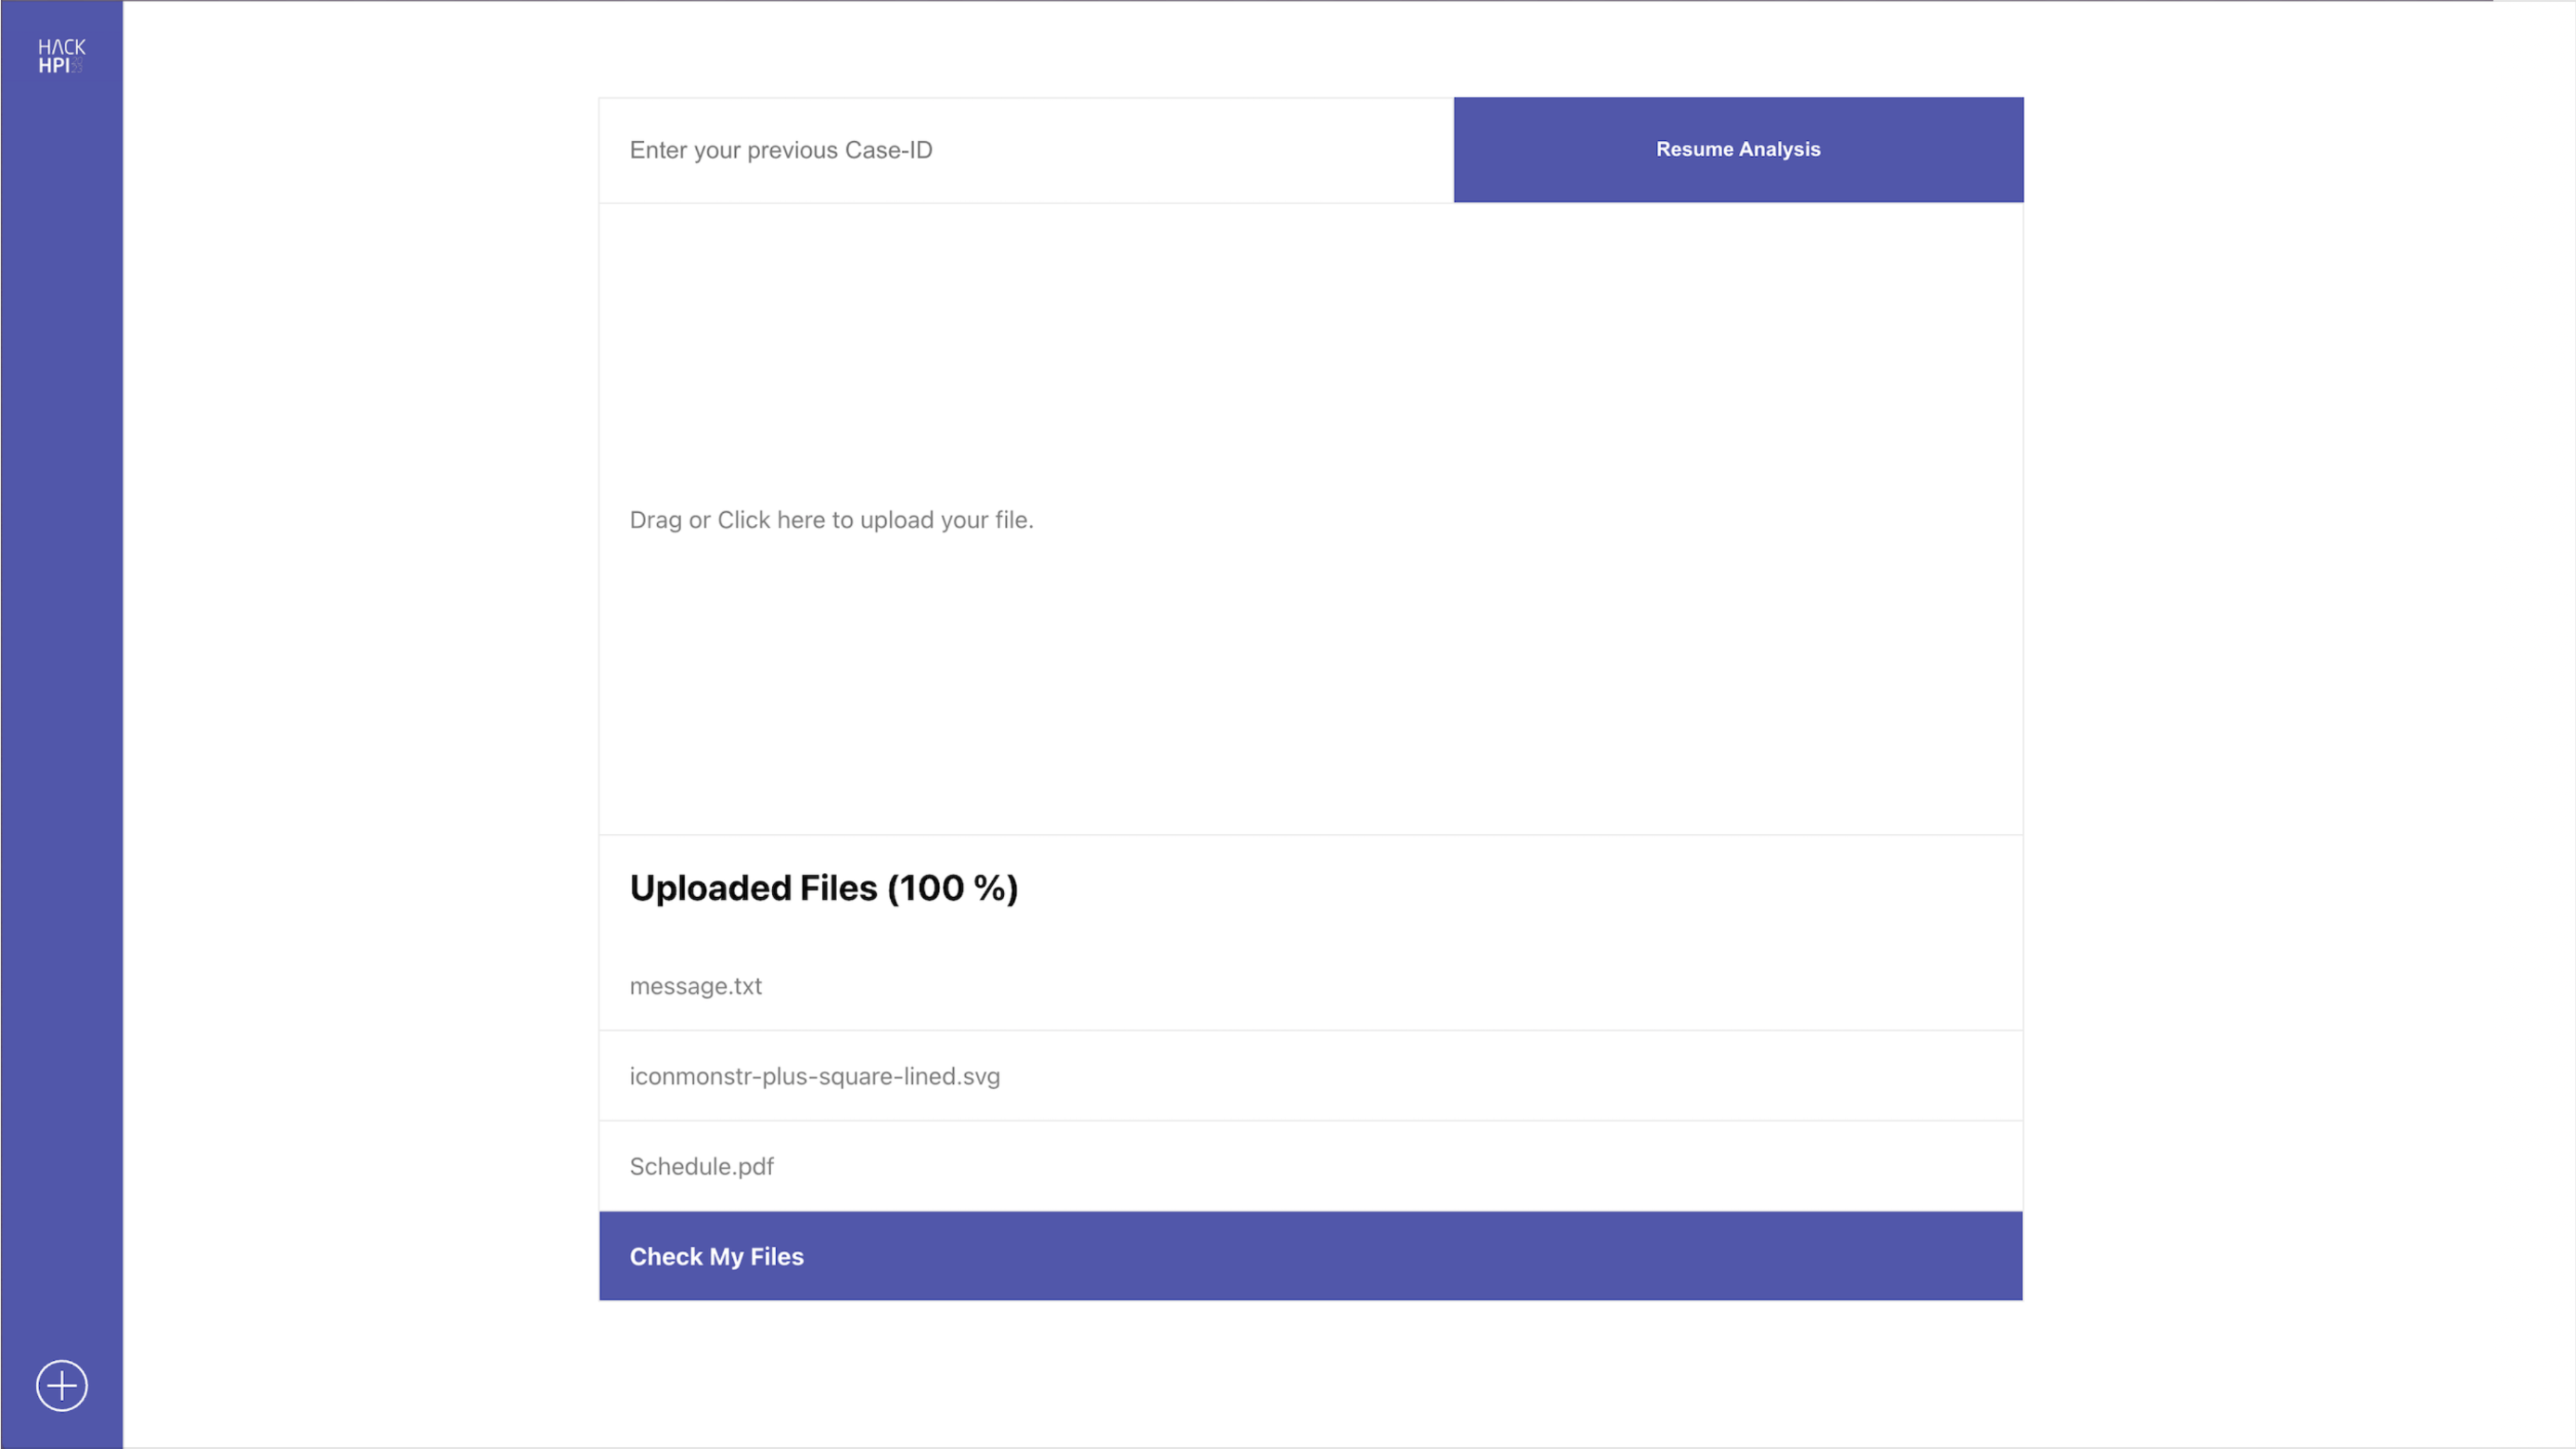
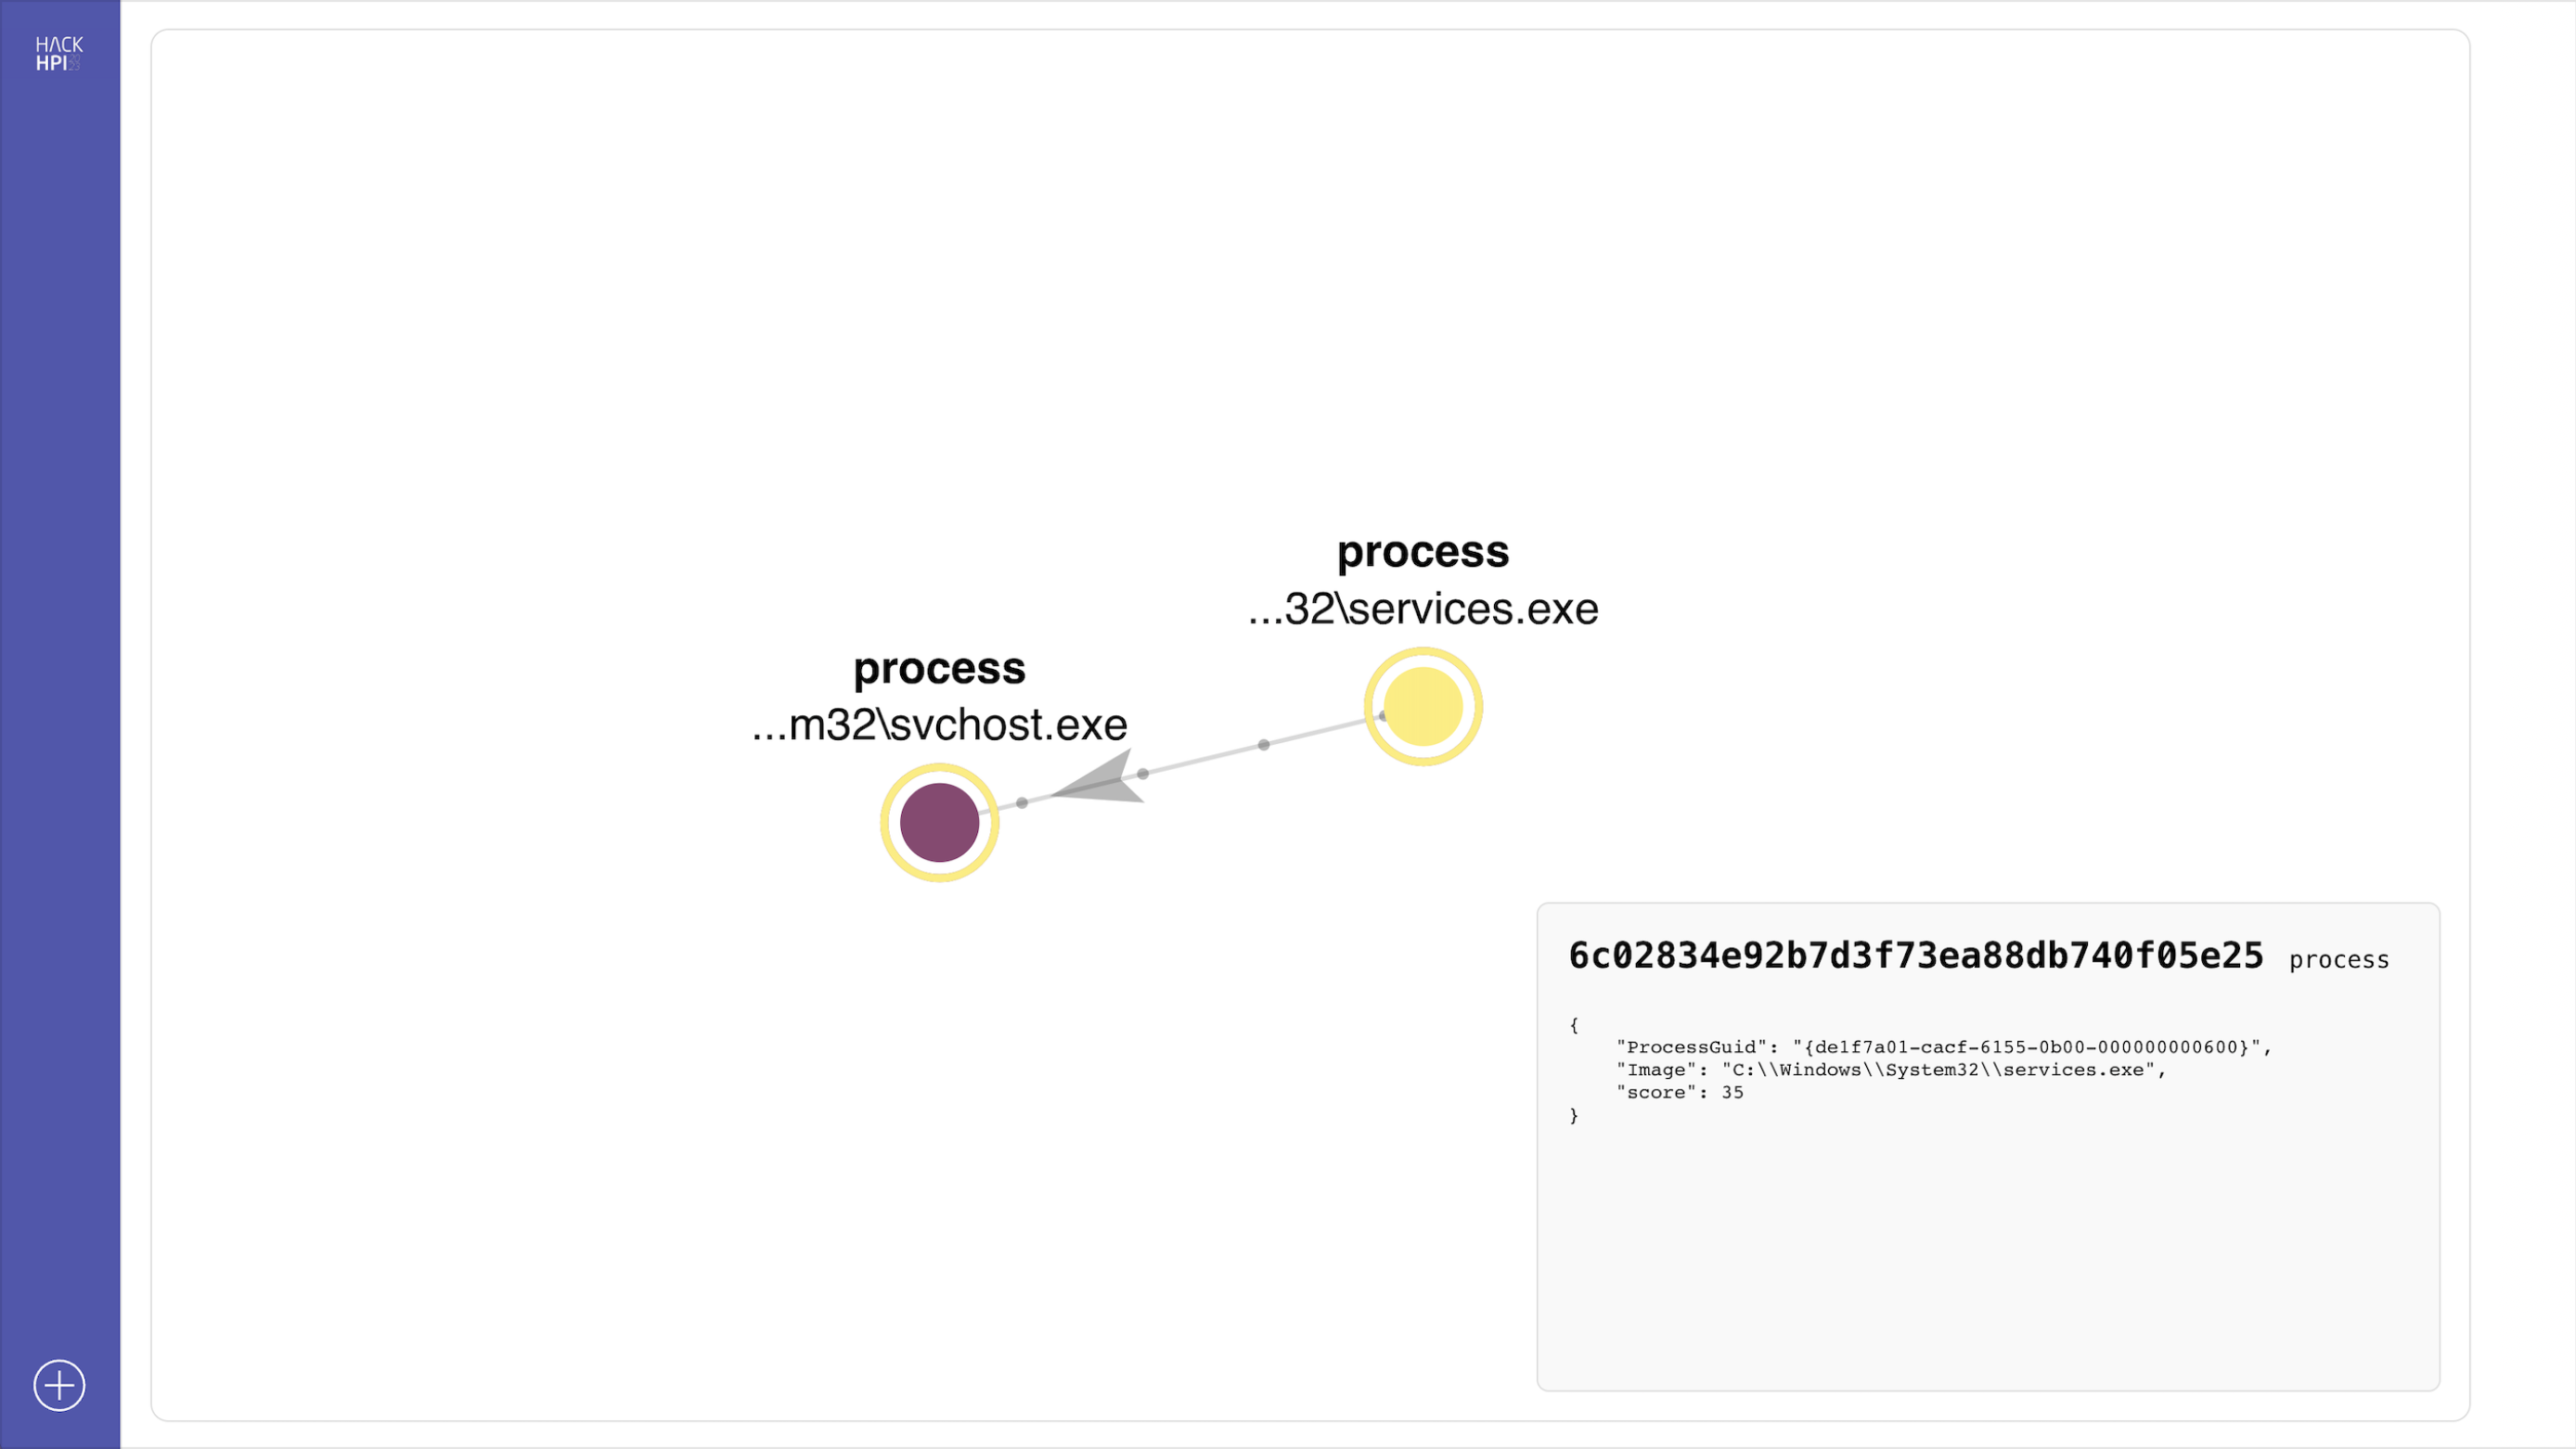
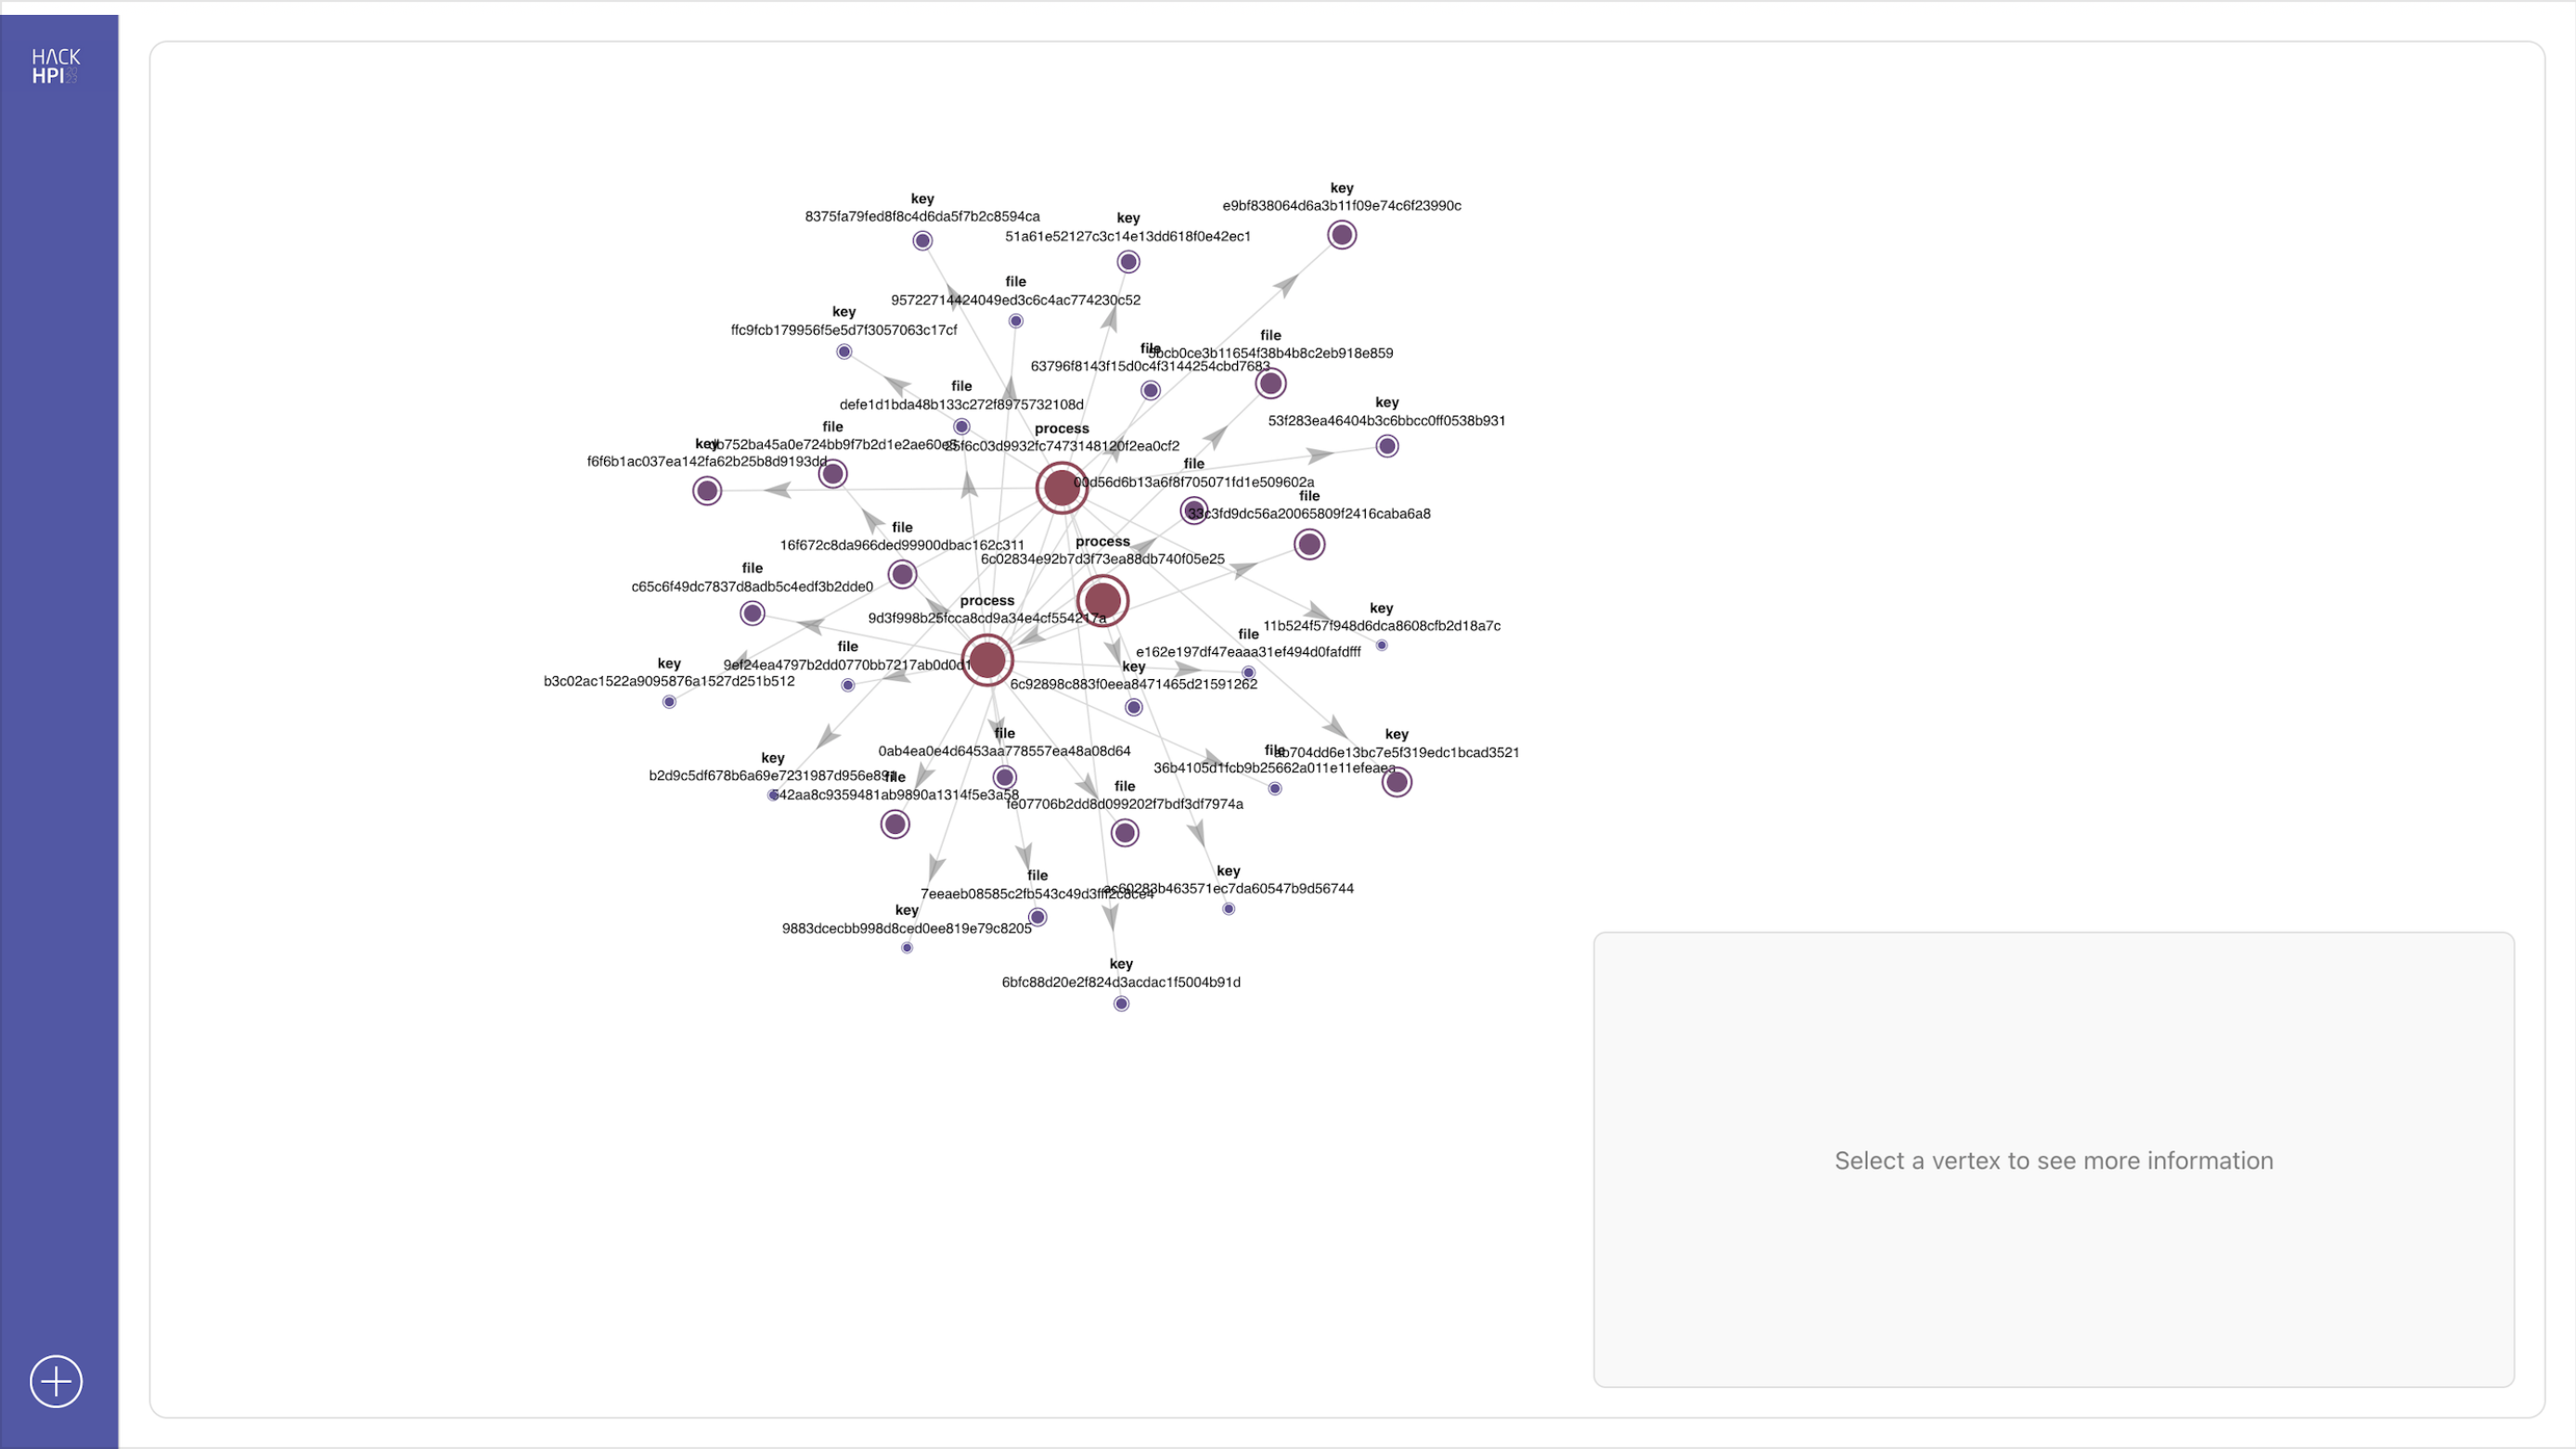
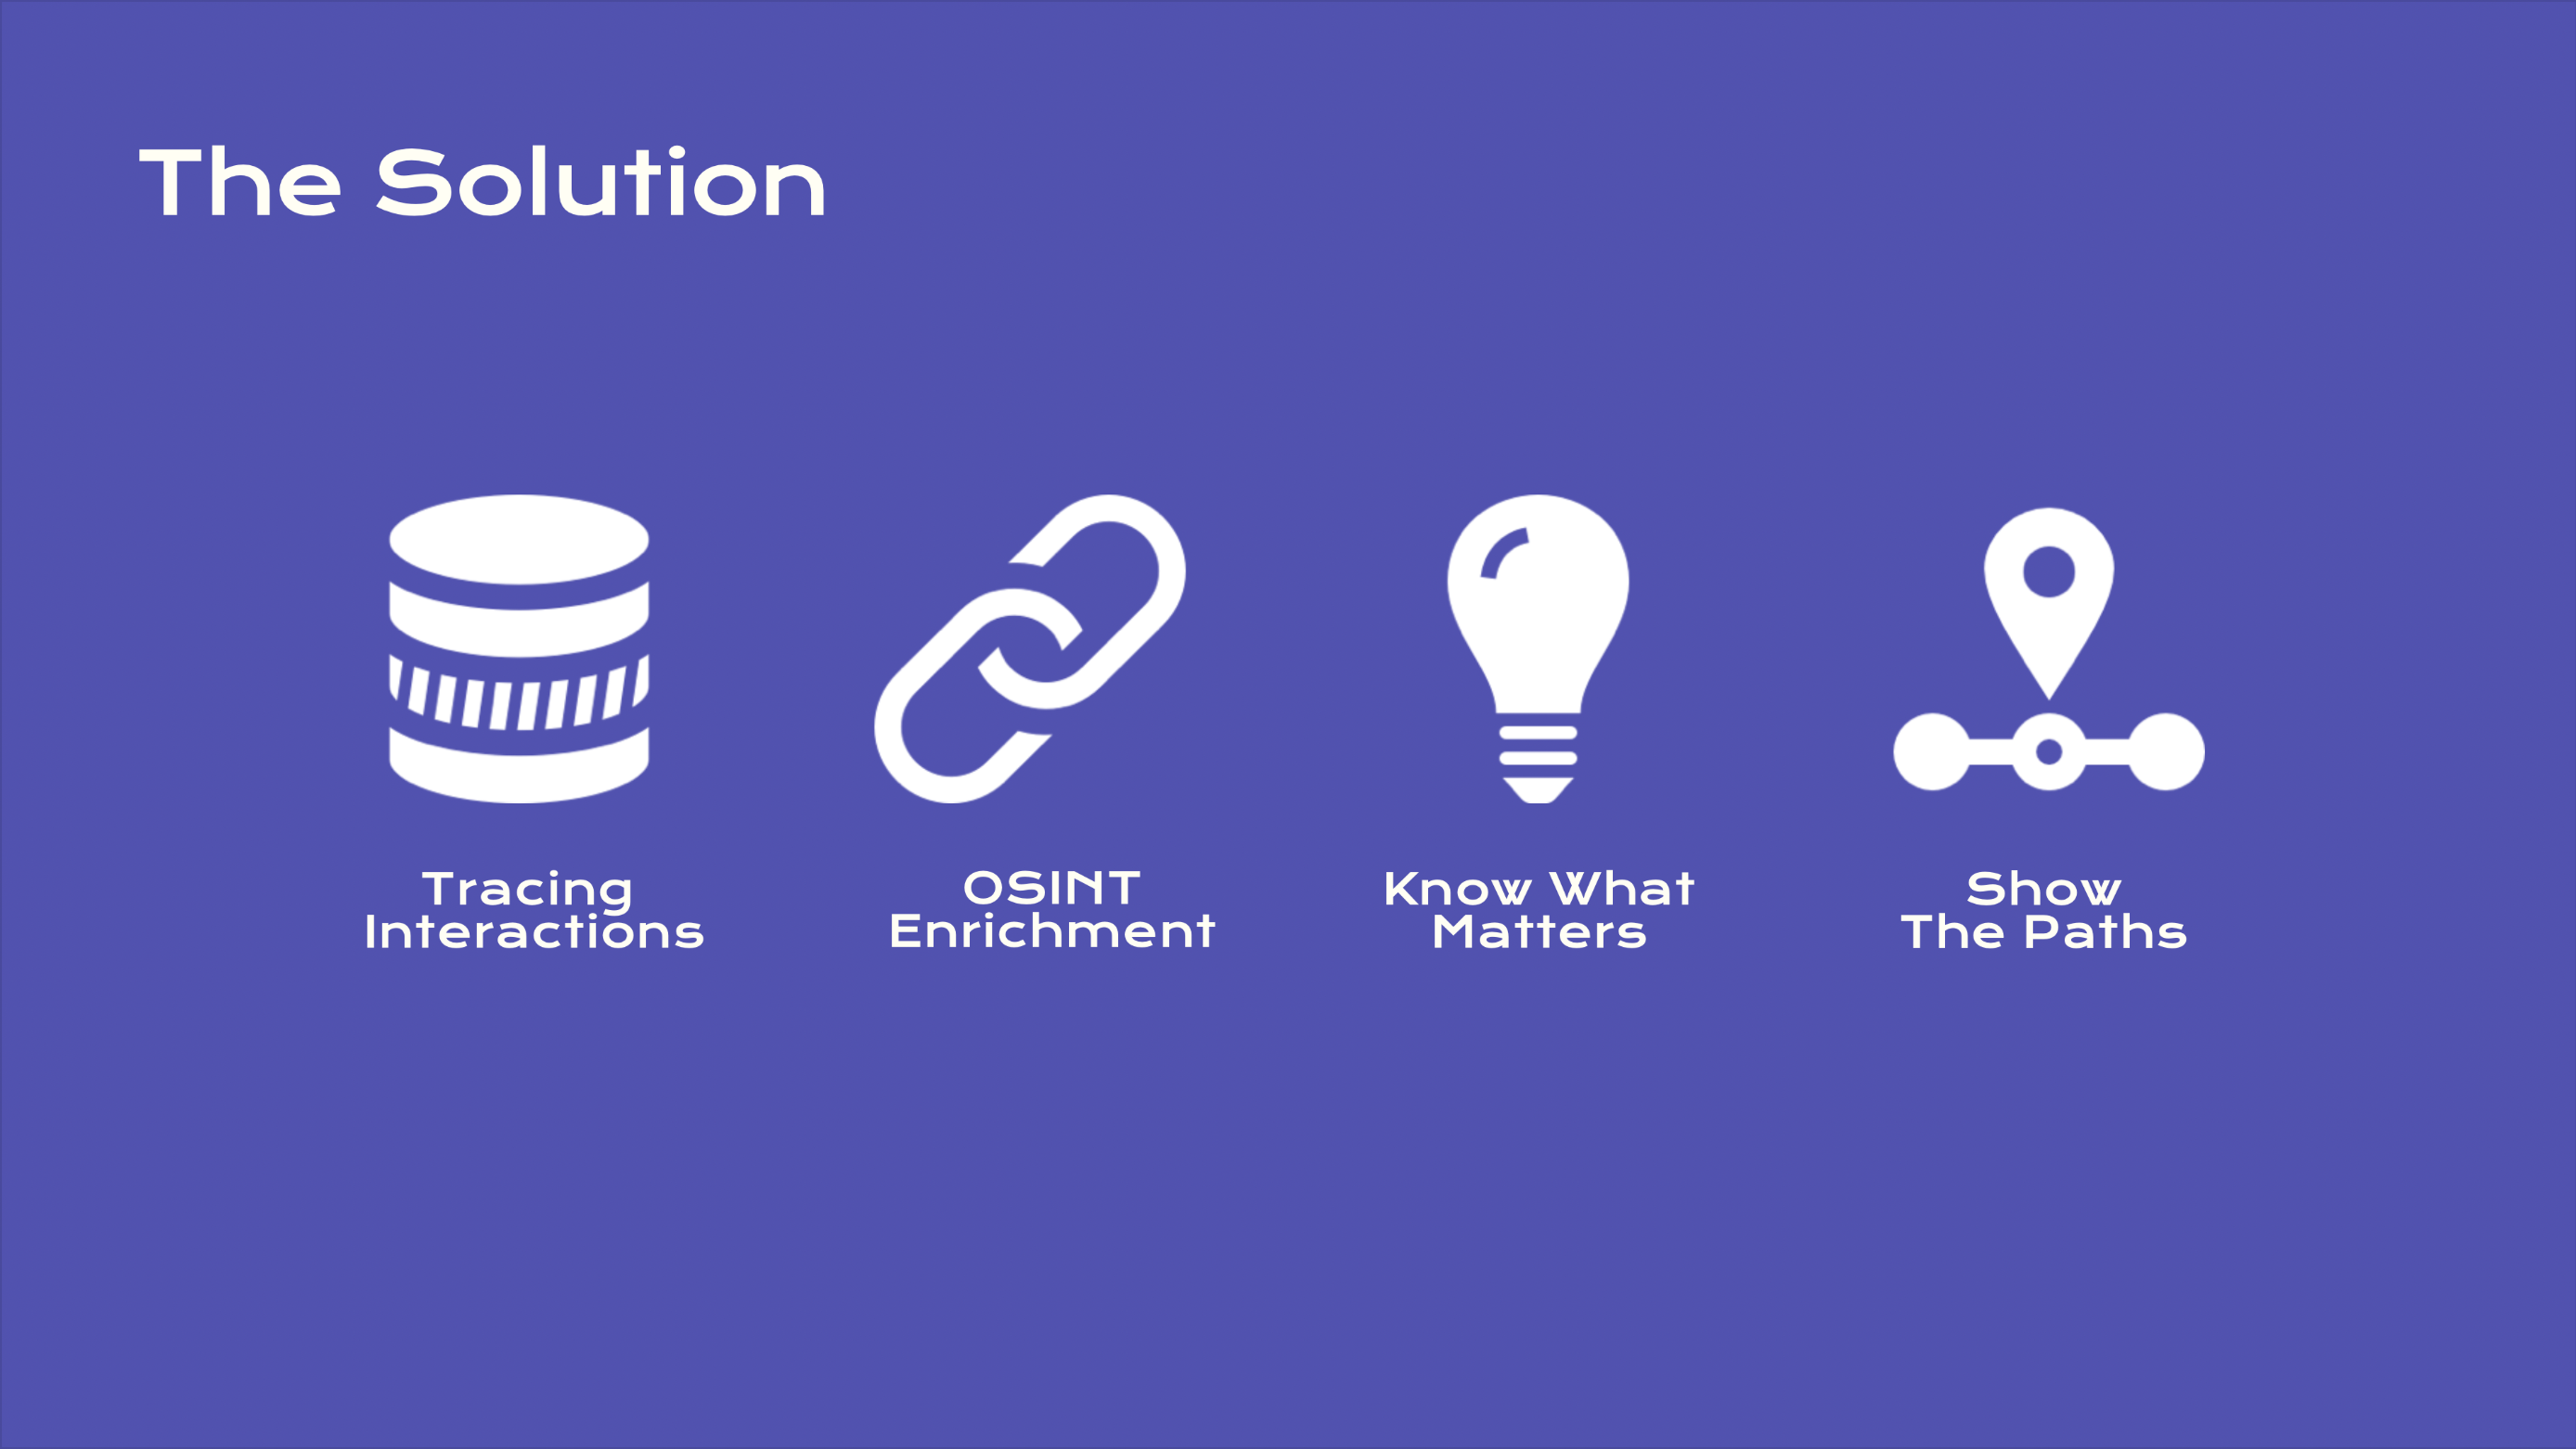
The tool builds a graph from logfiles, enriches the graph with Open Source Intelligence (OSINT) and Cyber Threat Information (CTI), prioritizes nodes of the graph and renders the files in an easy-explorable way.
How we built it
We build the backend system with the data processing pipeline using Flask and the frontend using React.
Challenges we ran into
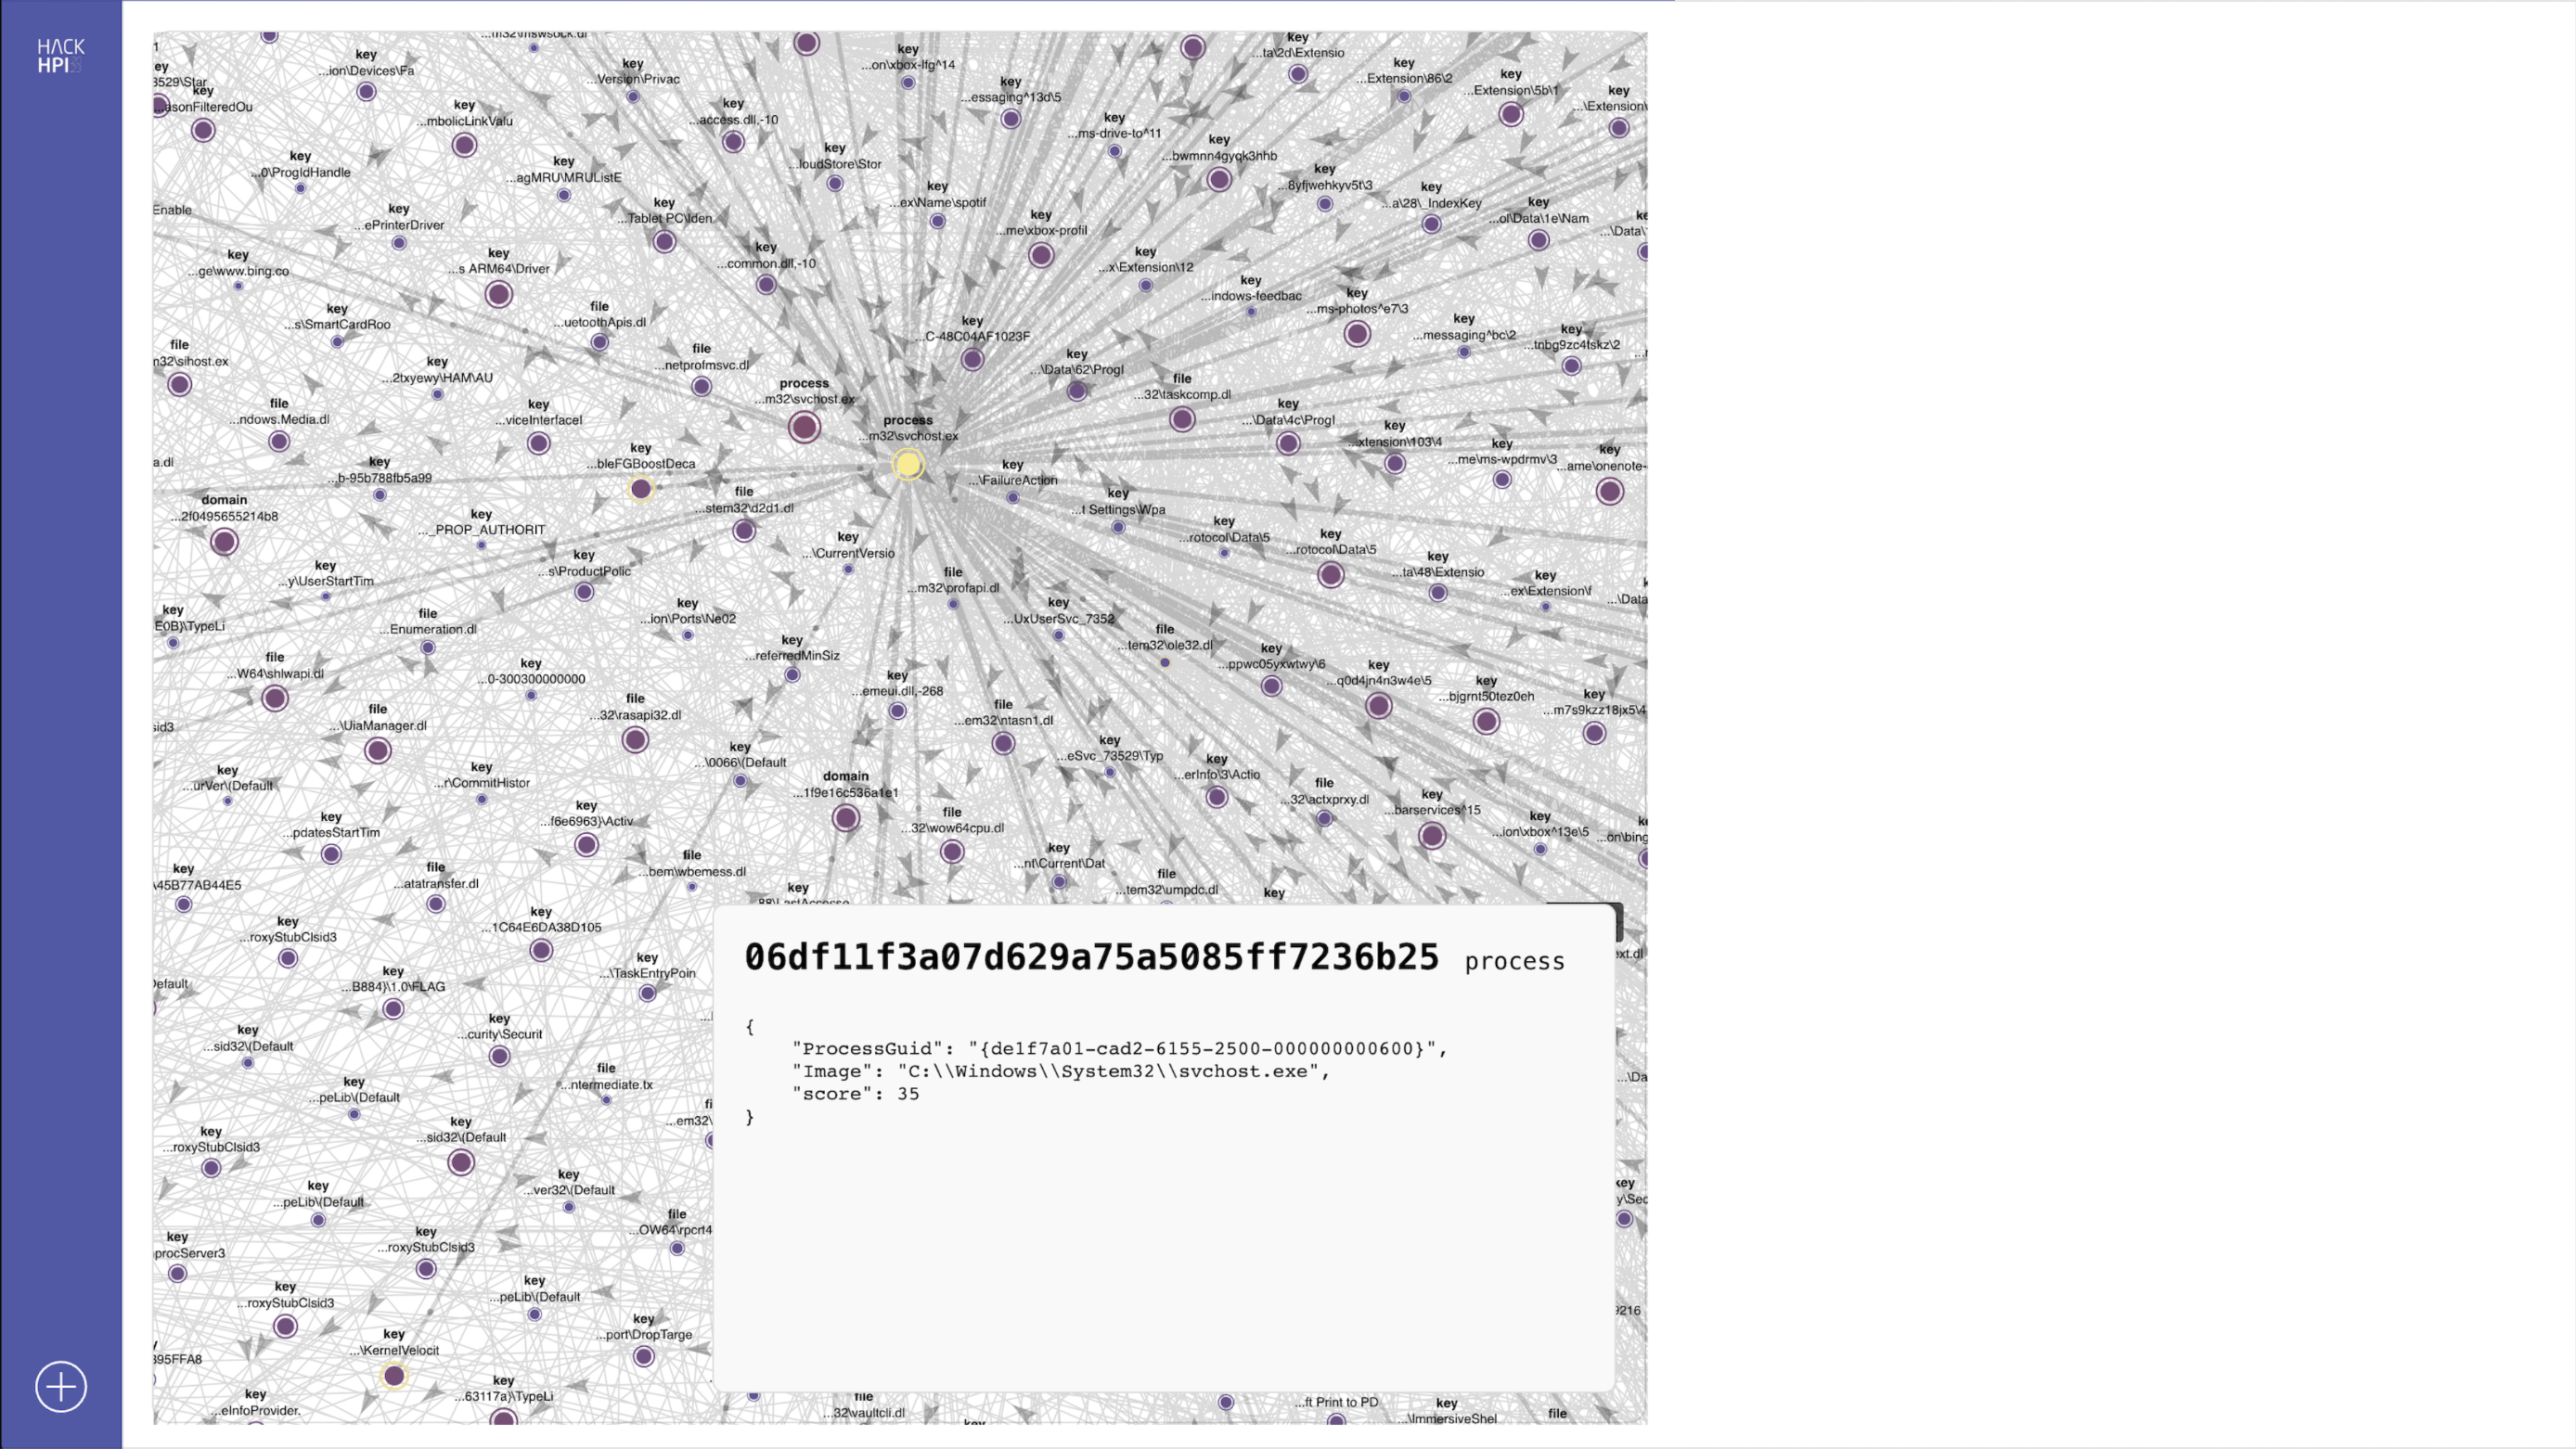
Data acquisition, reliable parsing, enrichment API limitations, drafting a suitable scoring function, visualization of thousands of nodes
Accomplishments that we're proud of
Getting everything running in 24h. "There are commercial products working worse"
What we learned
All about SOC operations, event log sources, OSINT and security provenance graphs
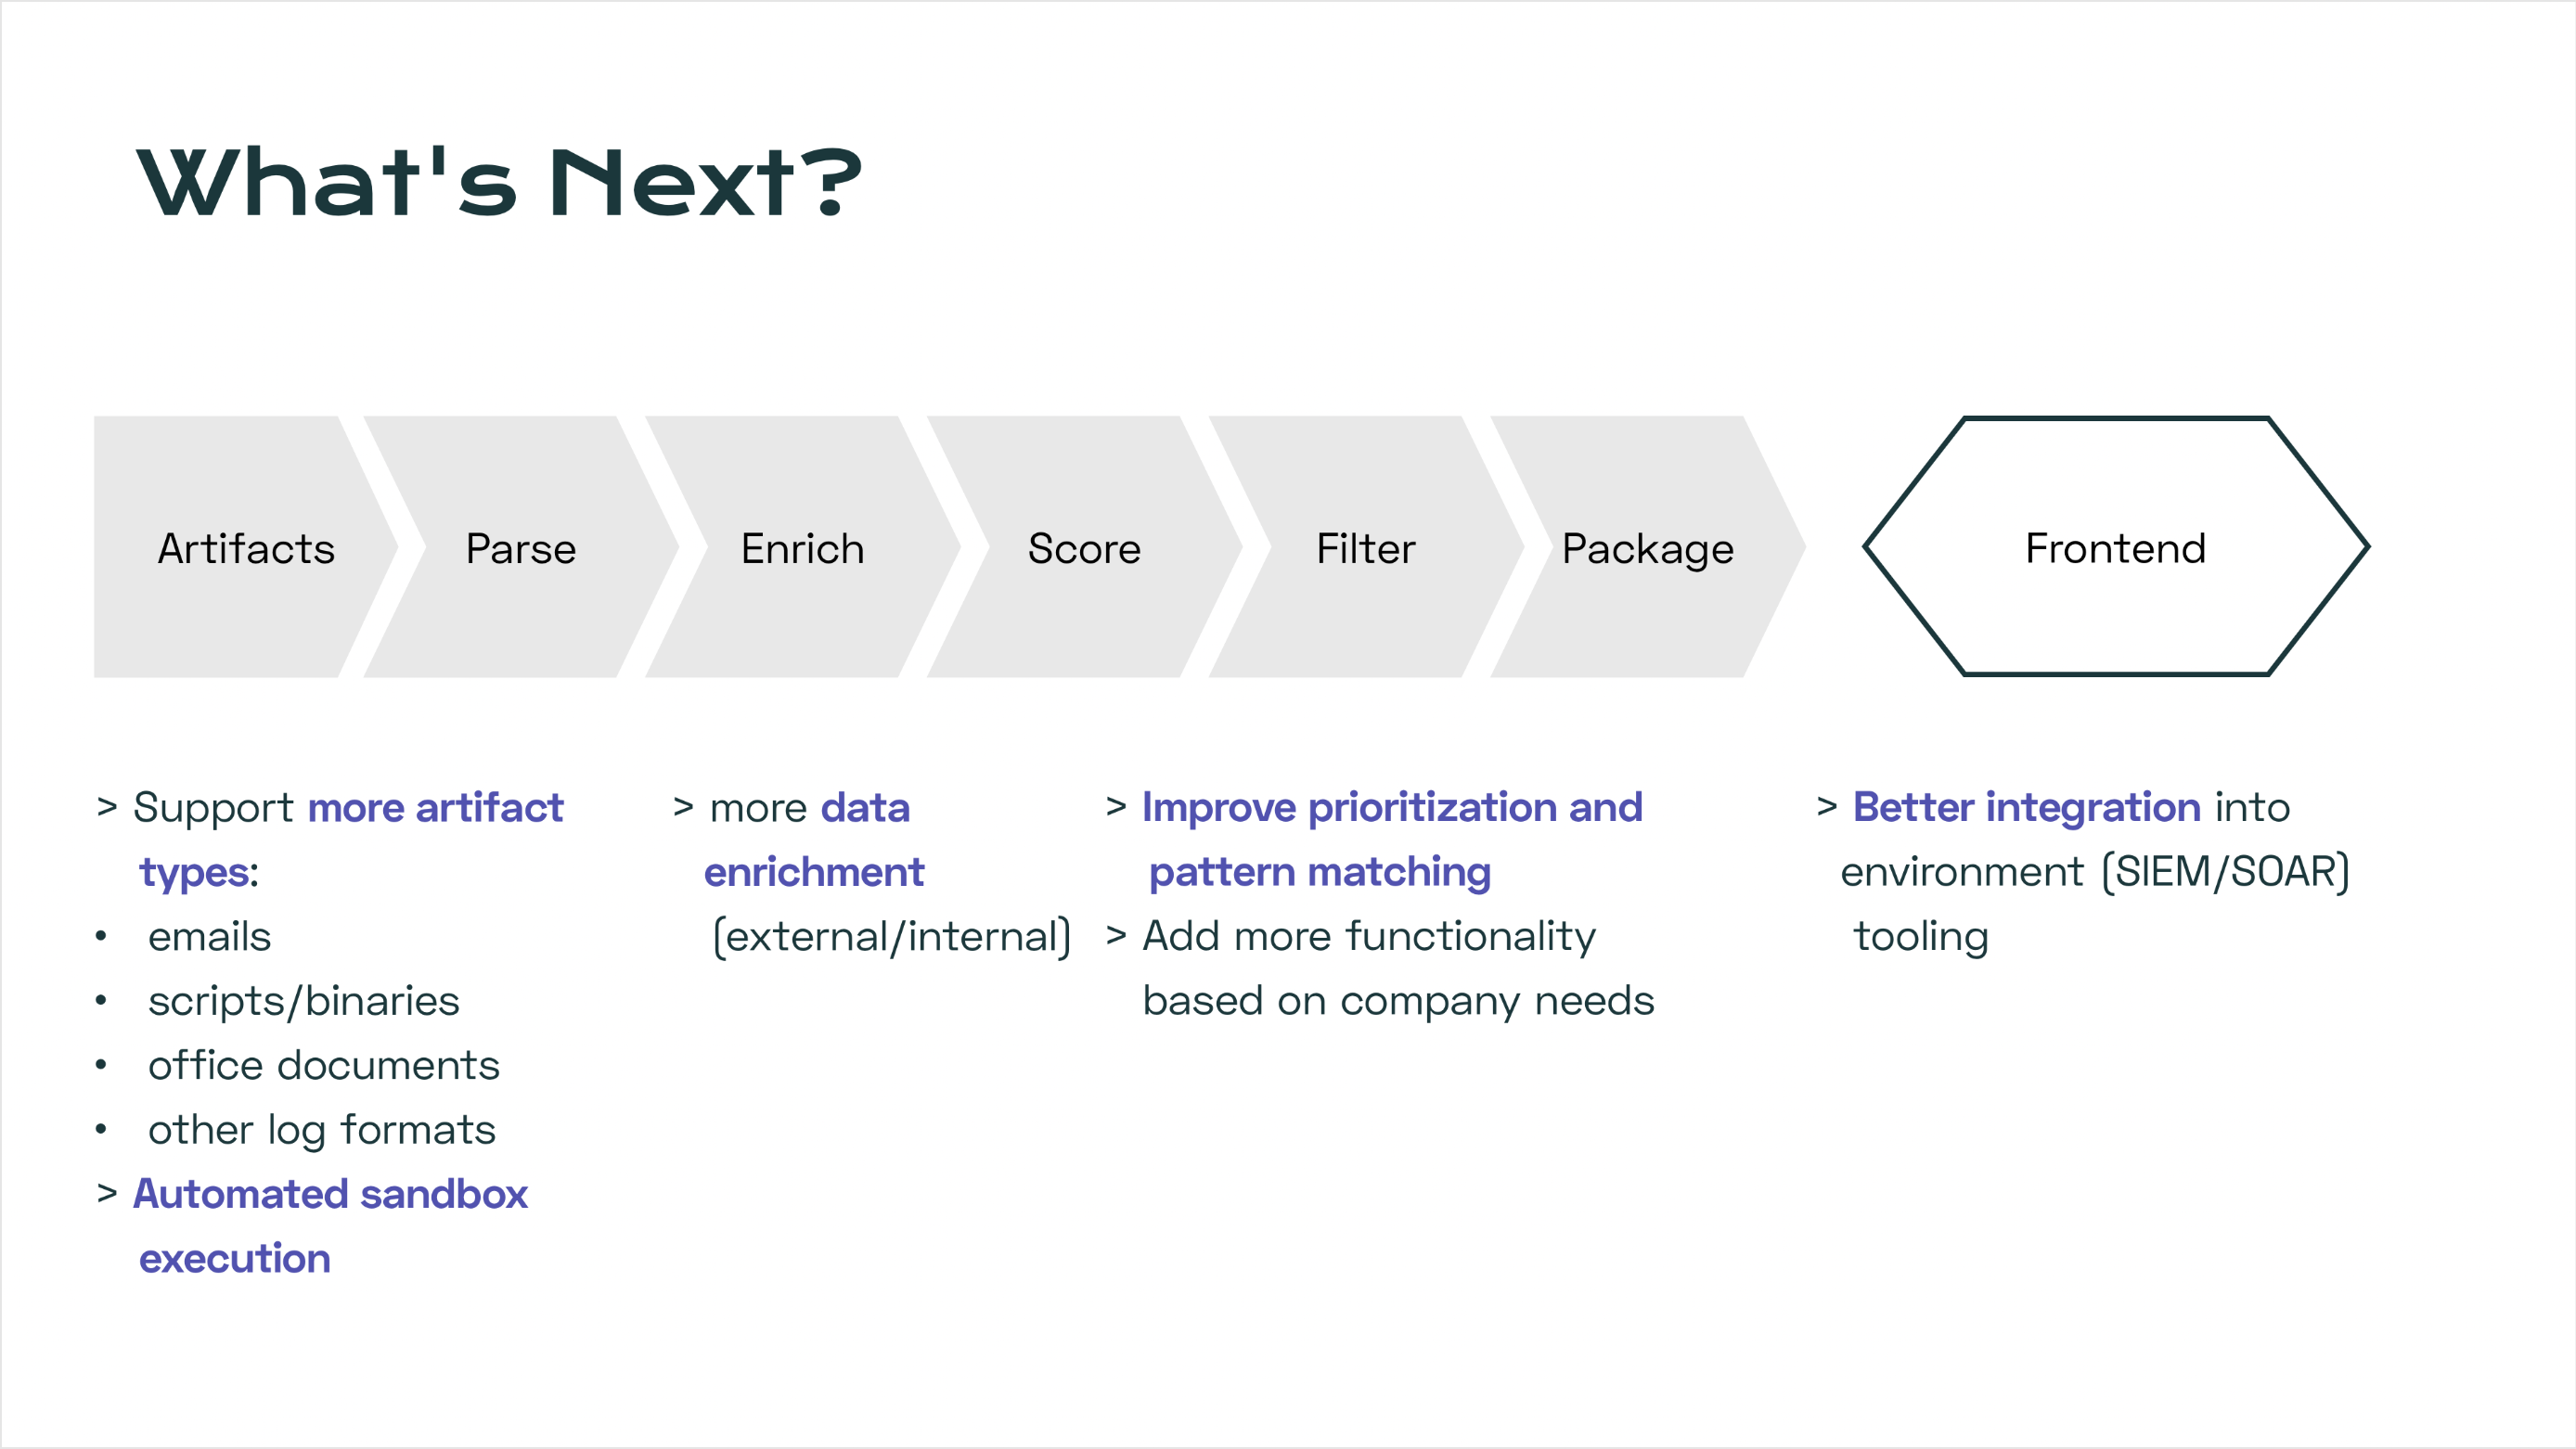
What's next for Luminary
Better scoring, more enrichers, more formats

Log in or sign up for Devpost to join the conversation.