-
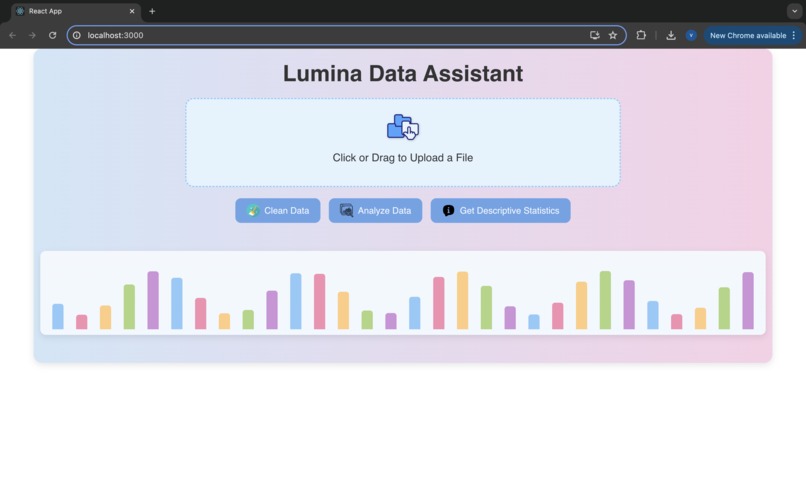
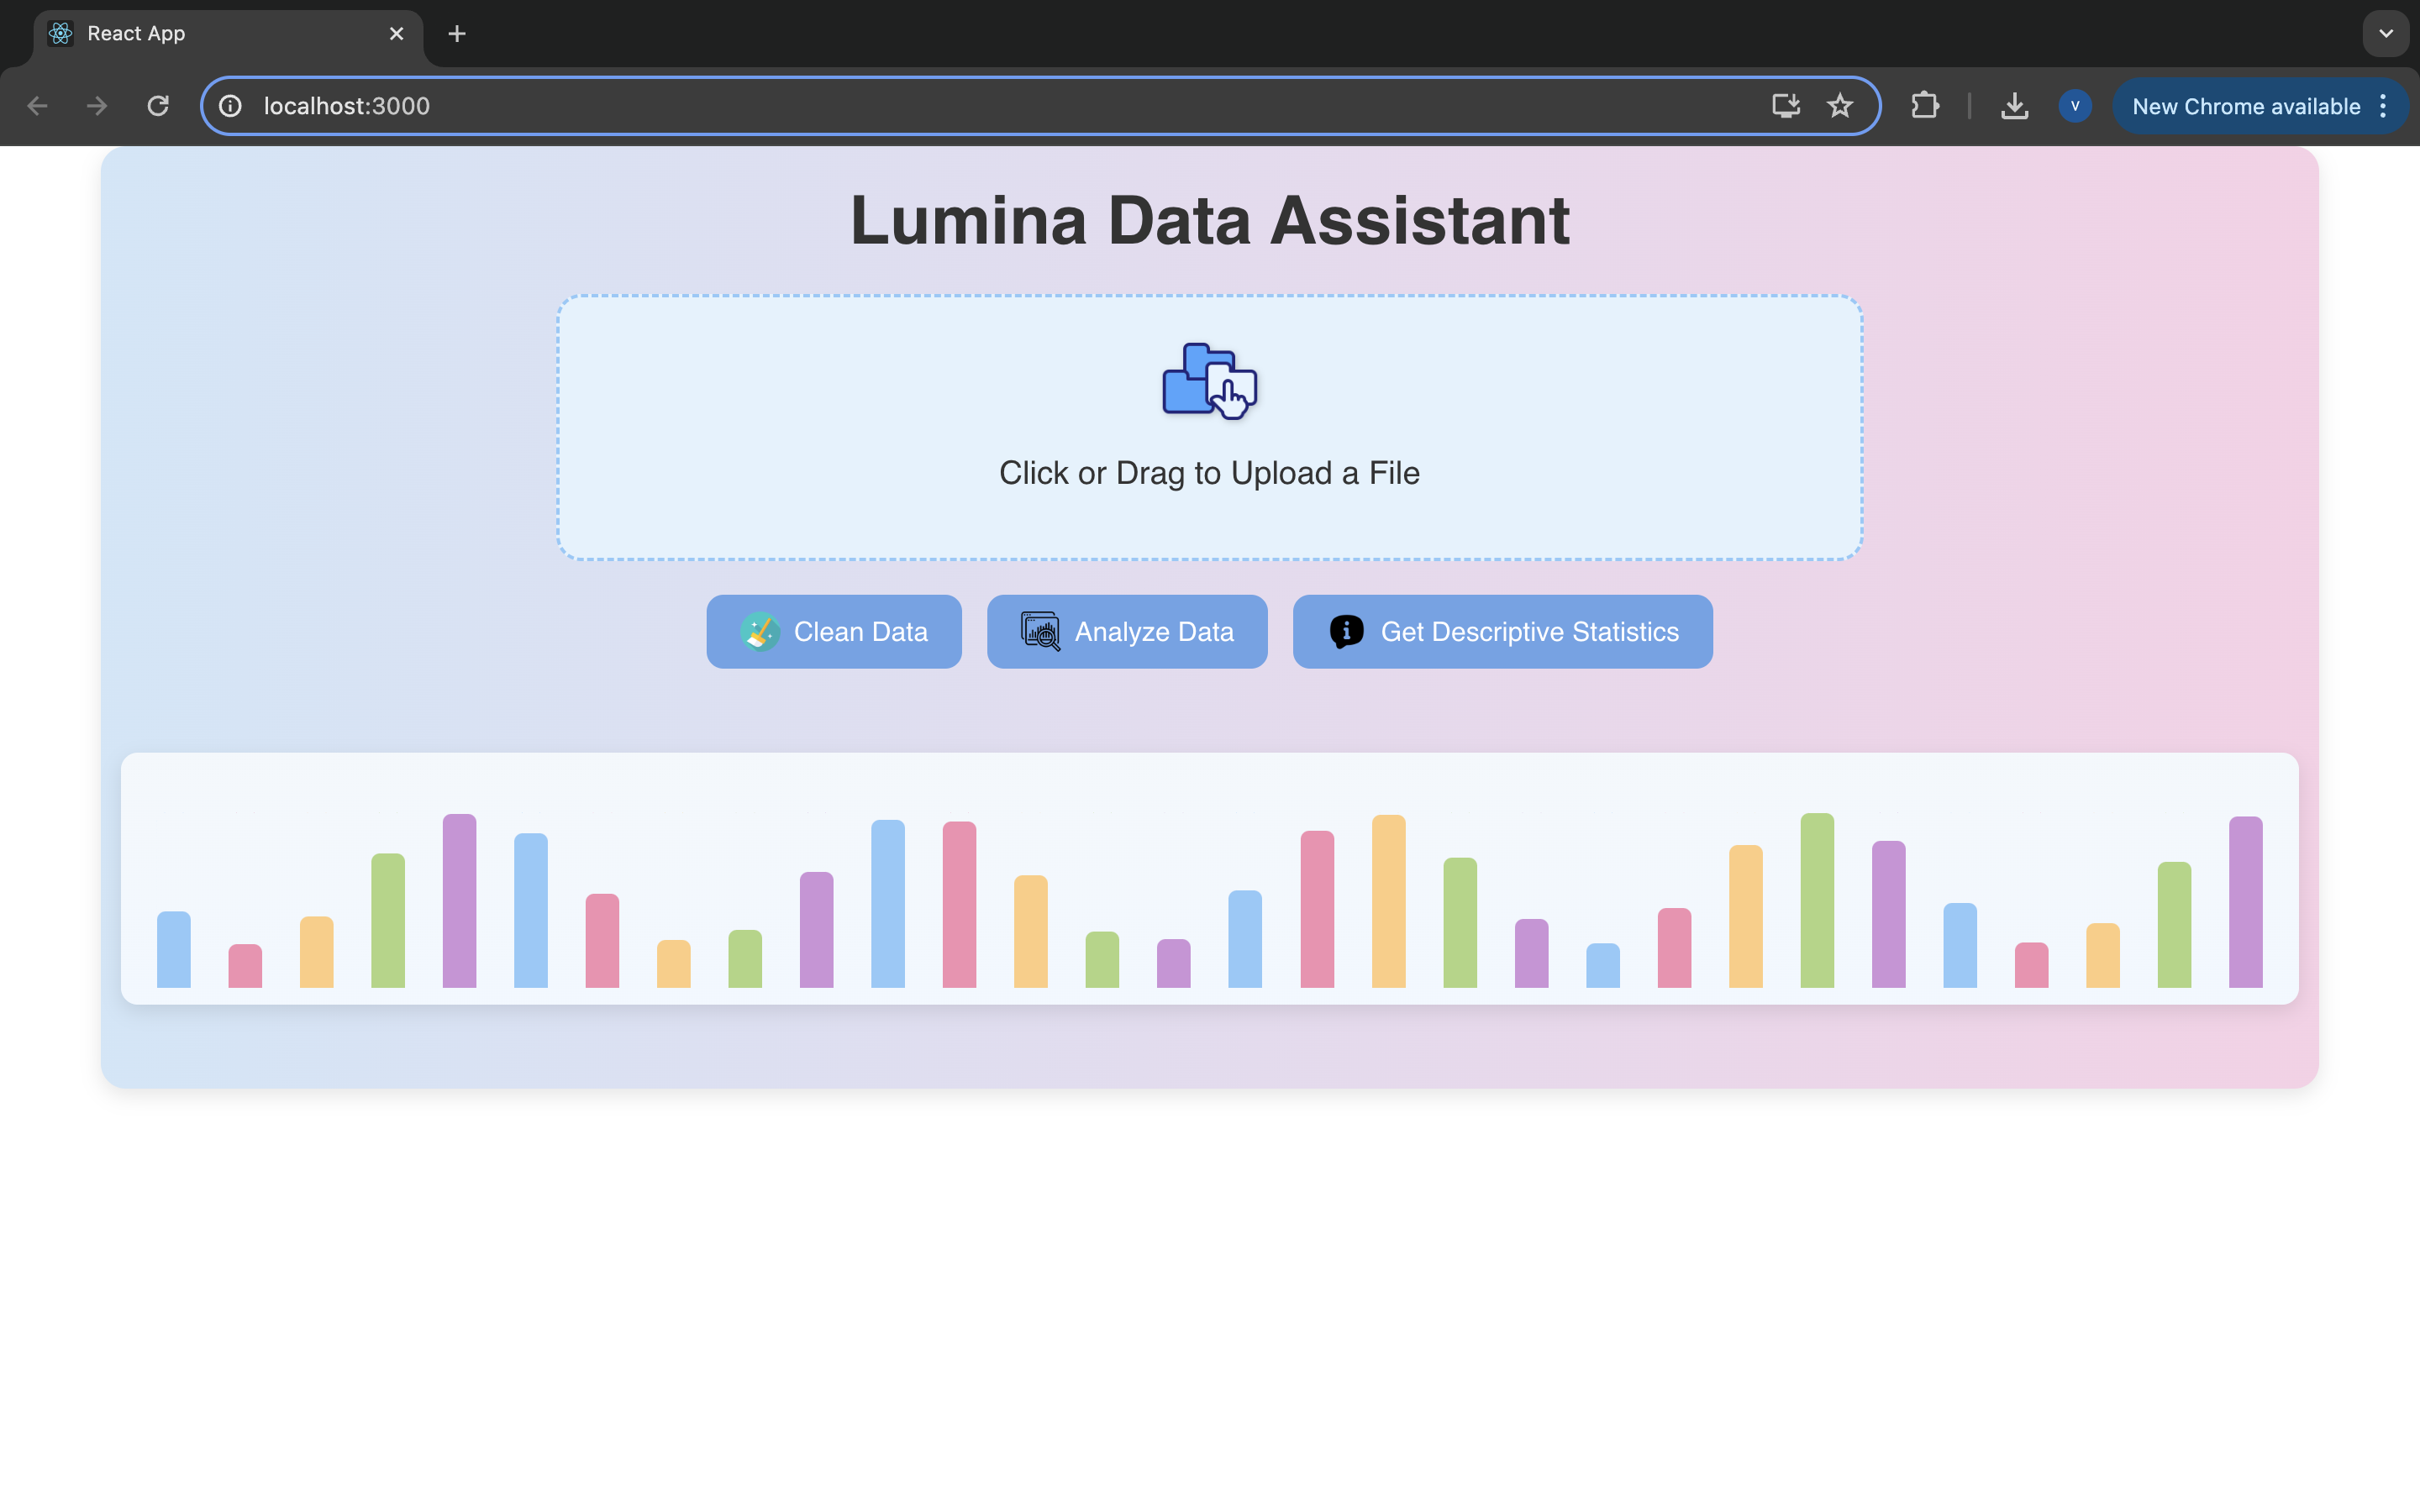
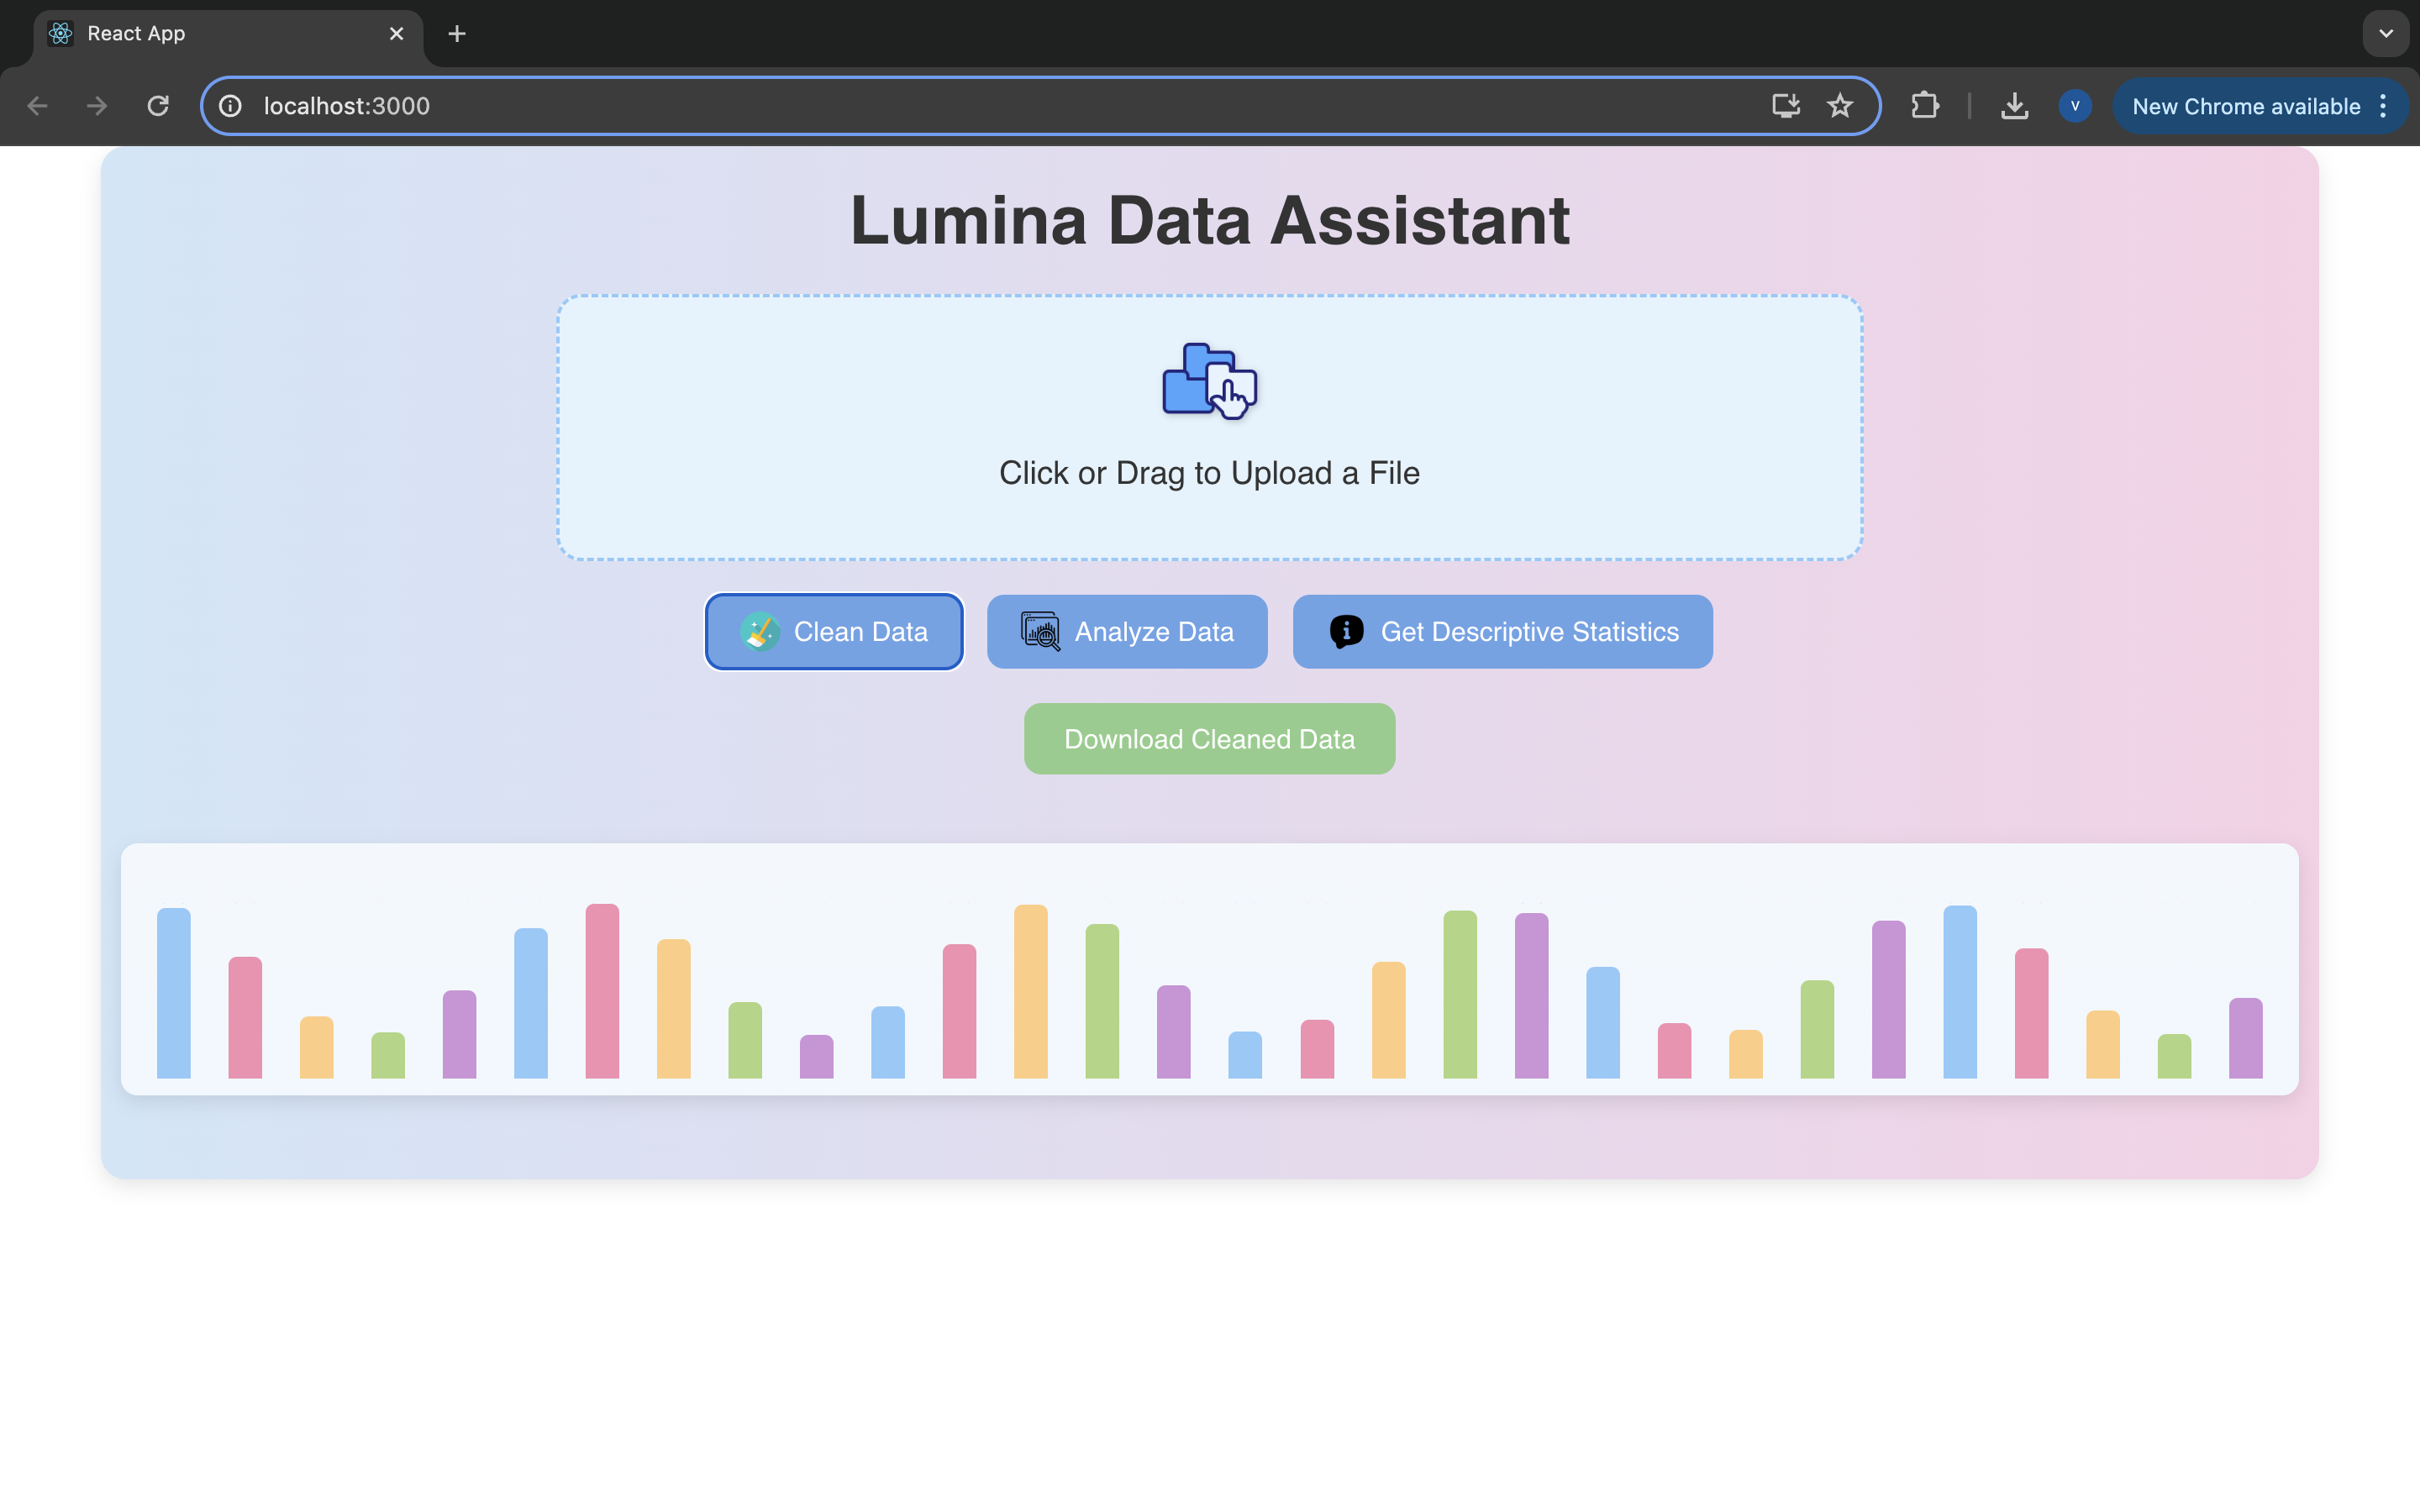
Home Screen
-
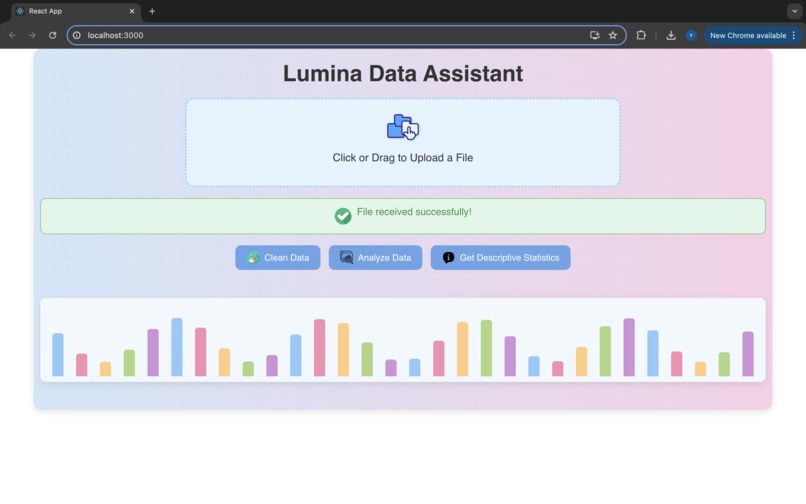
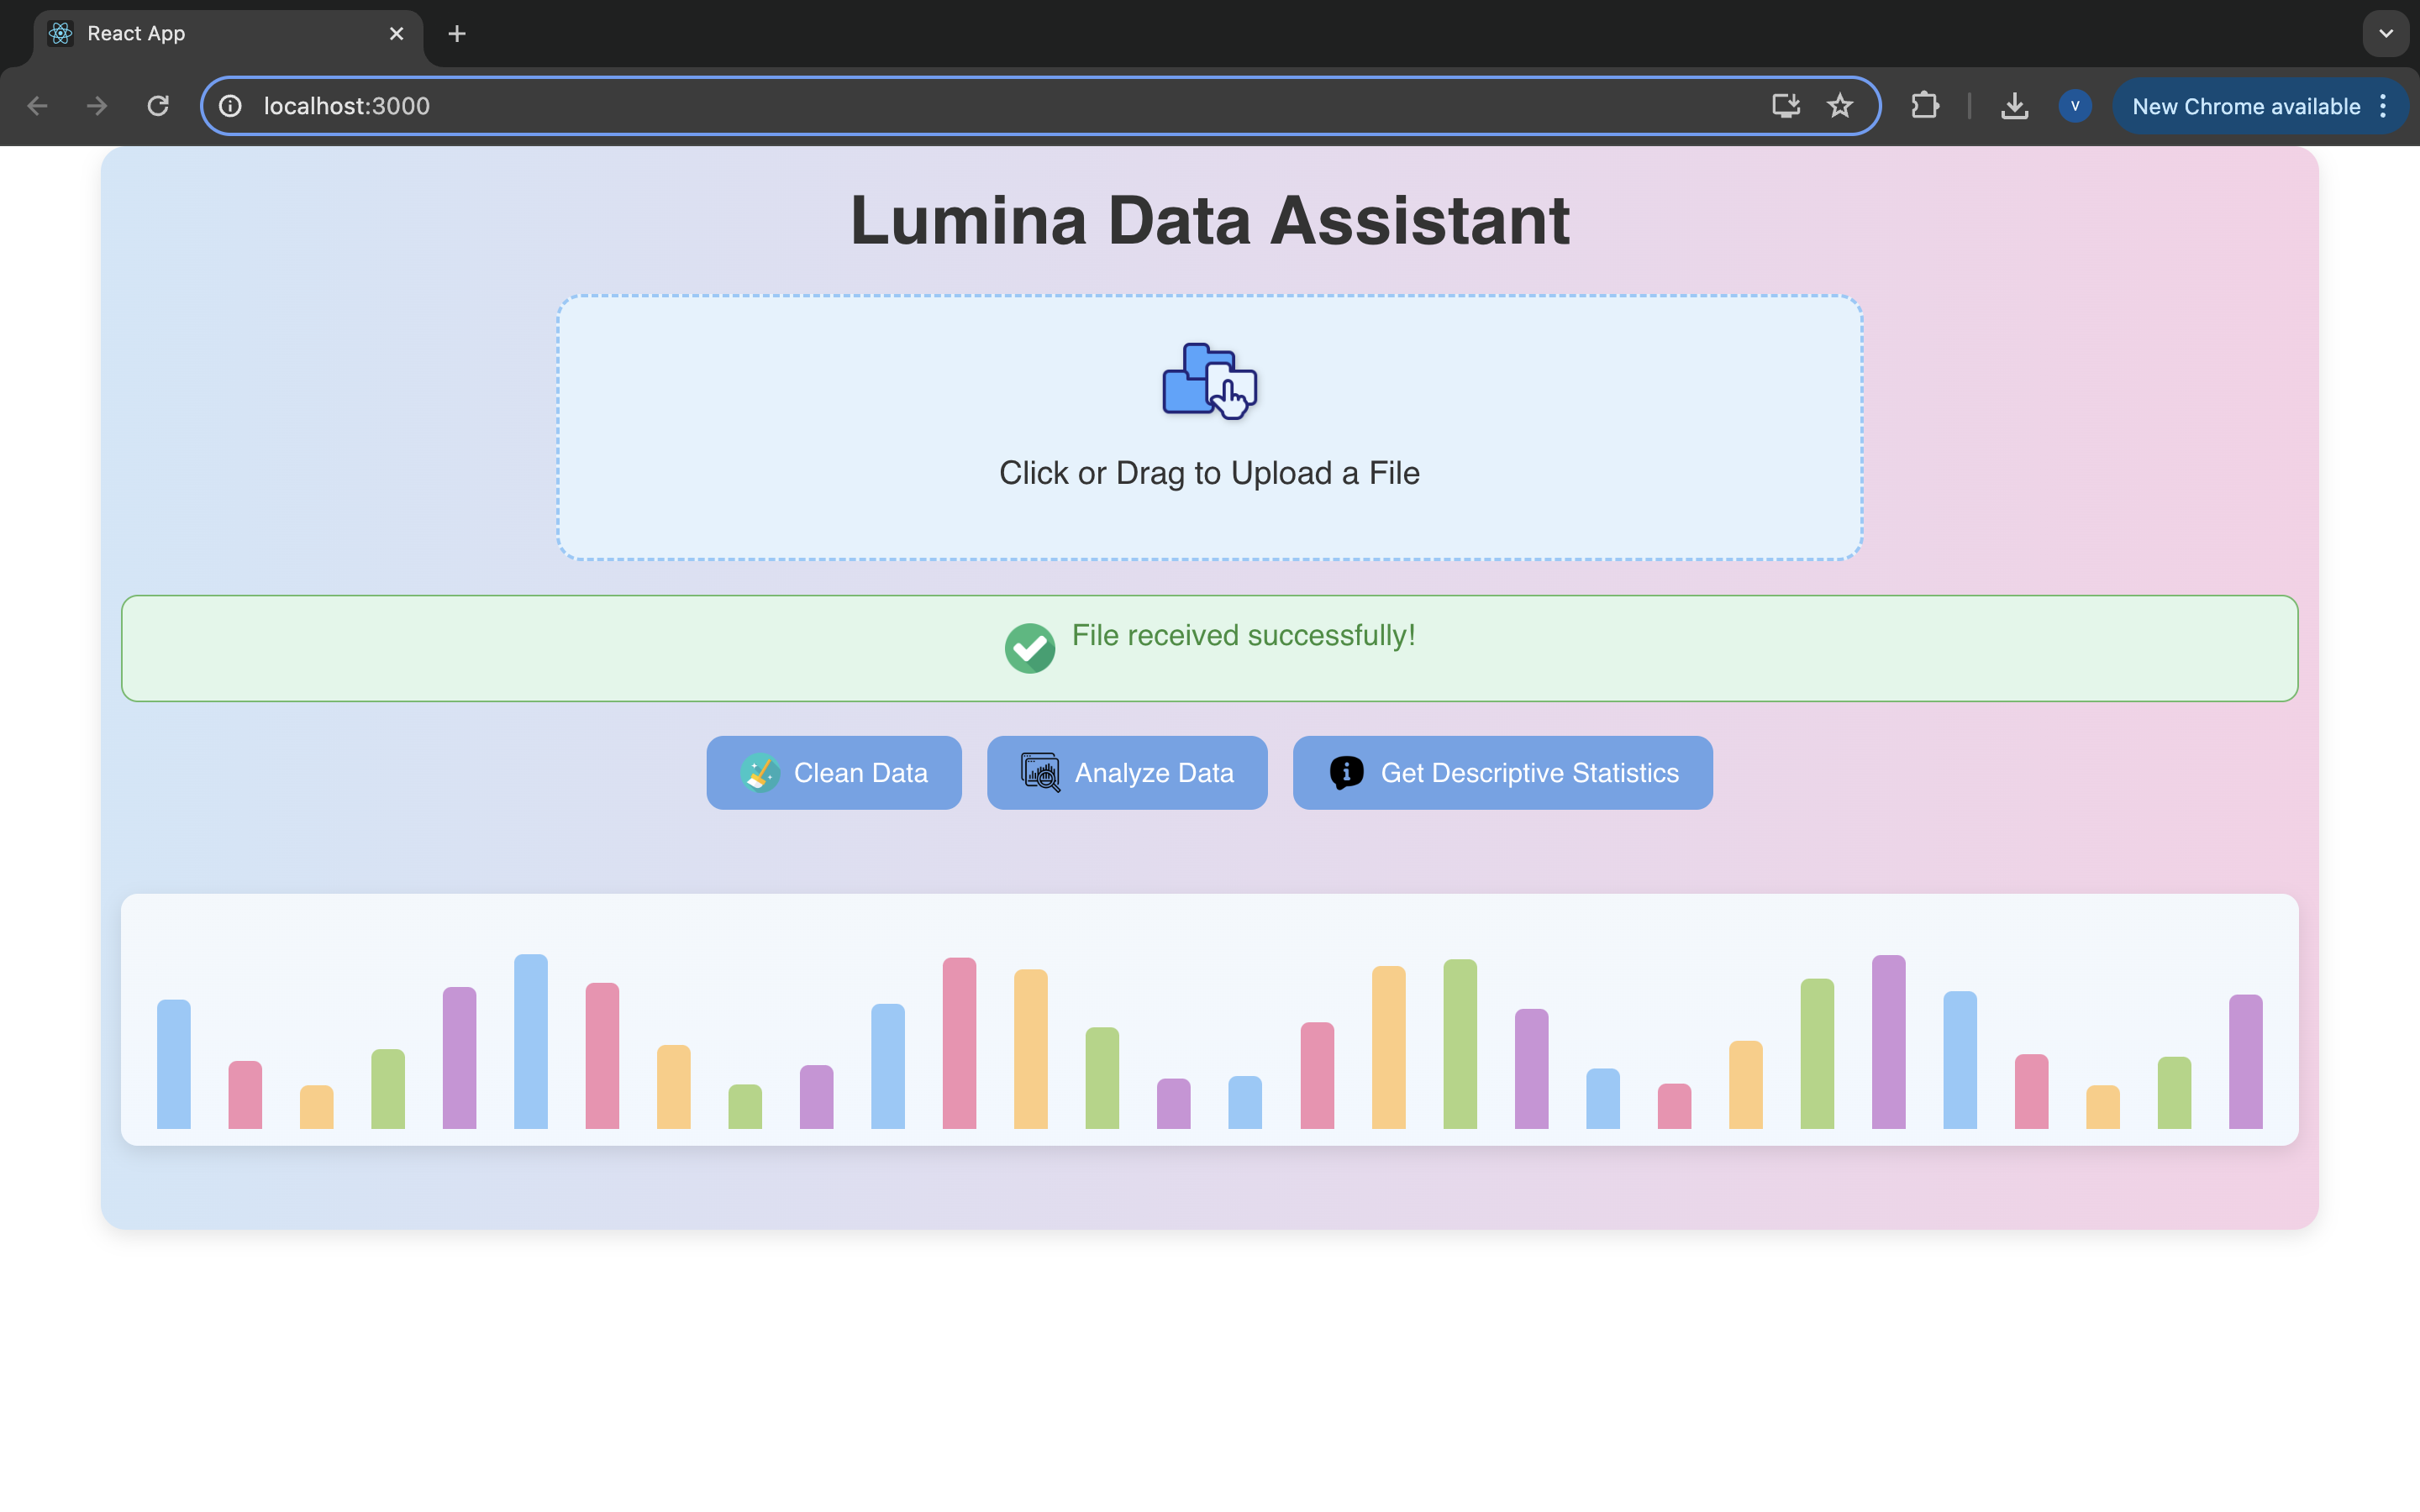
File Received
-
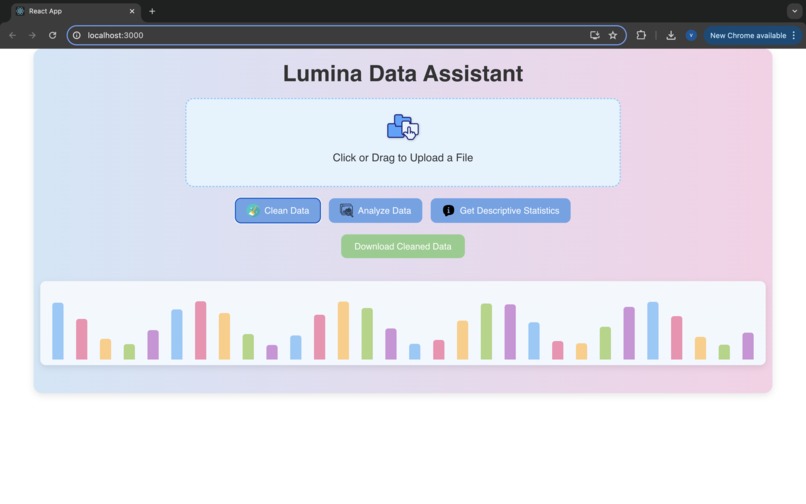
Downloadable Cleaned Data
-
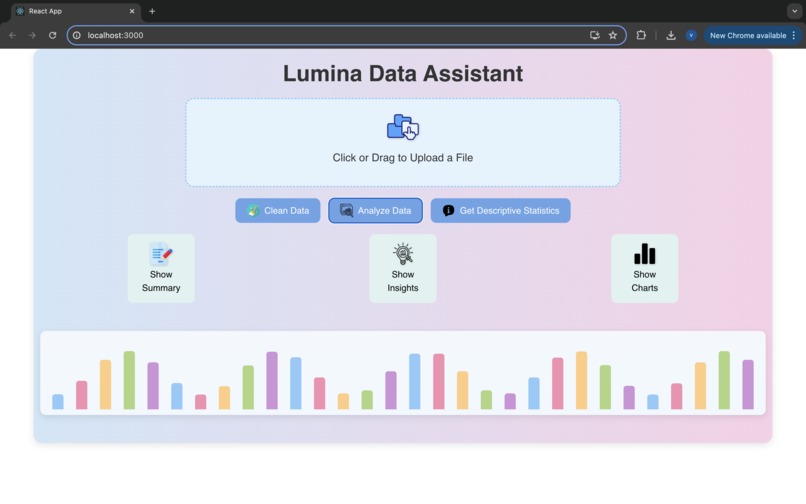
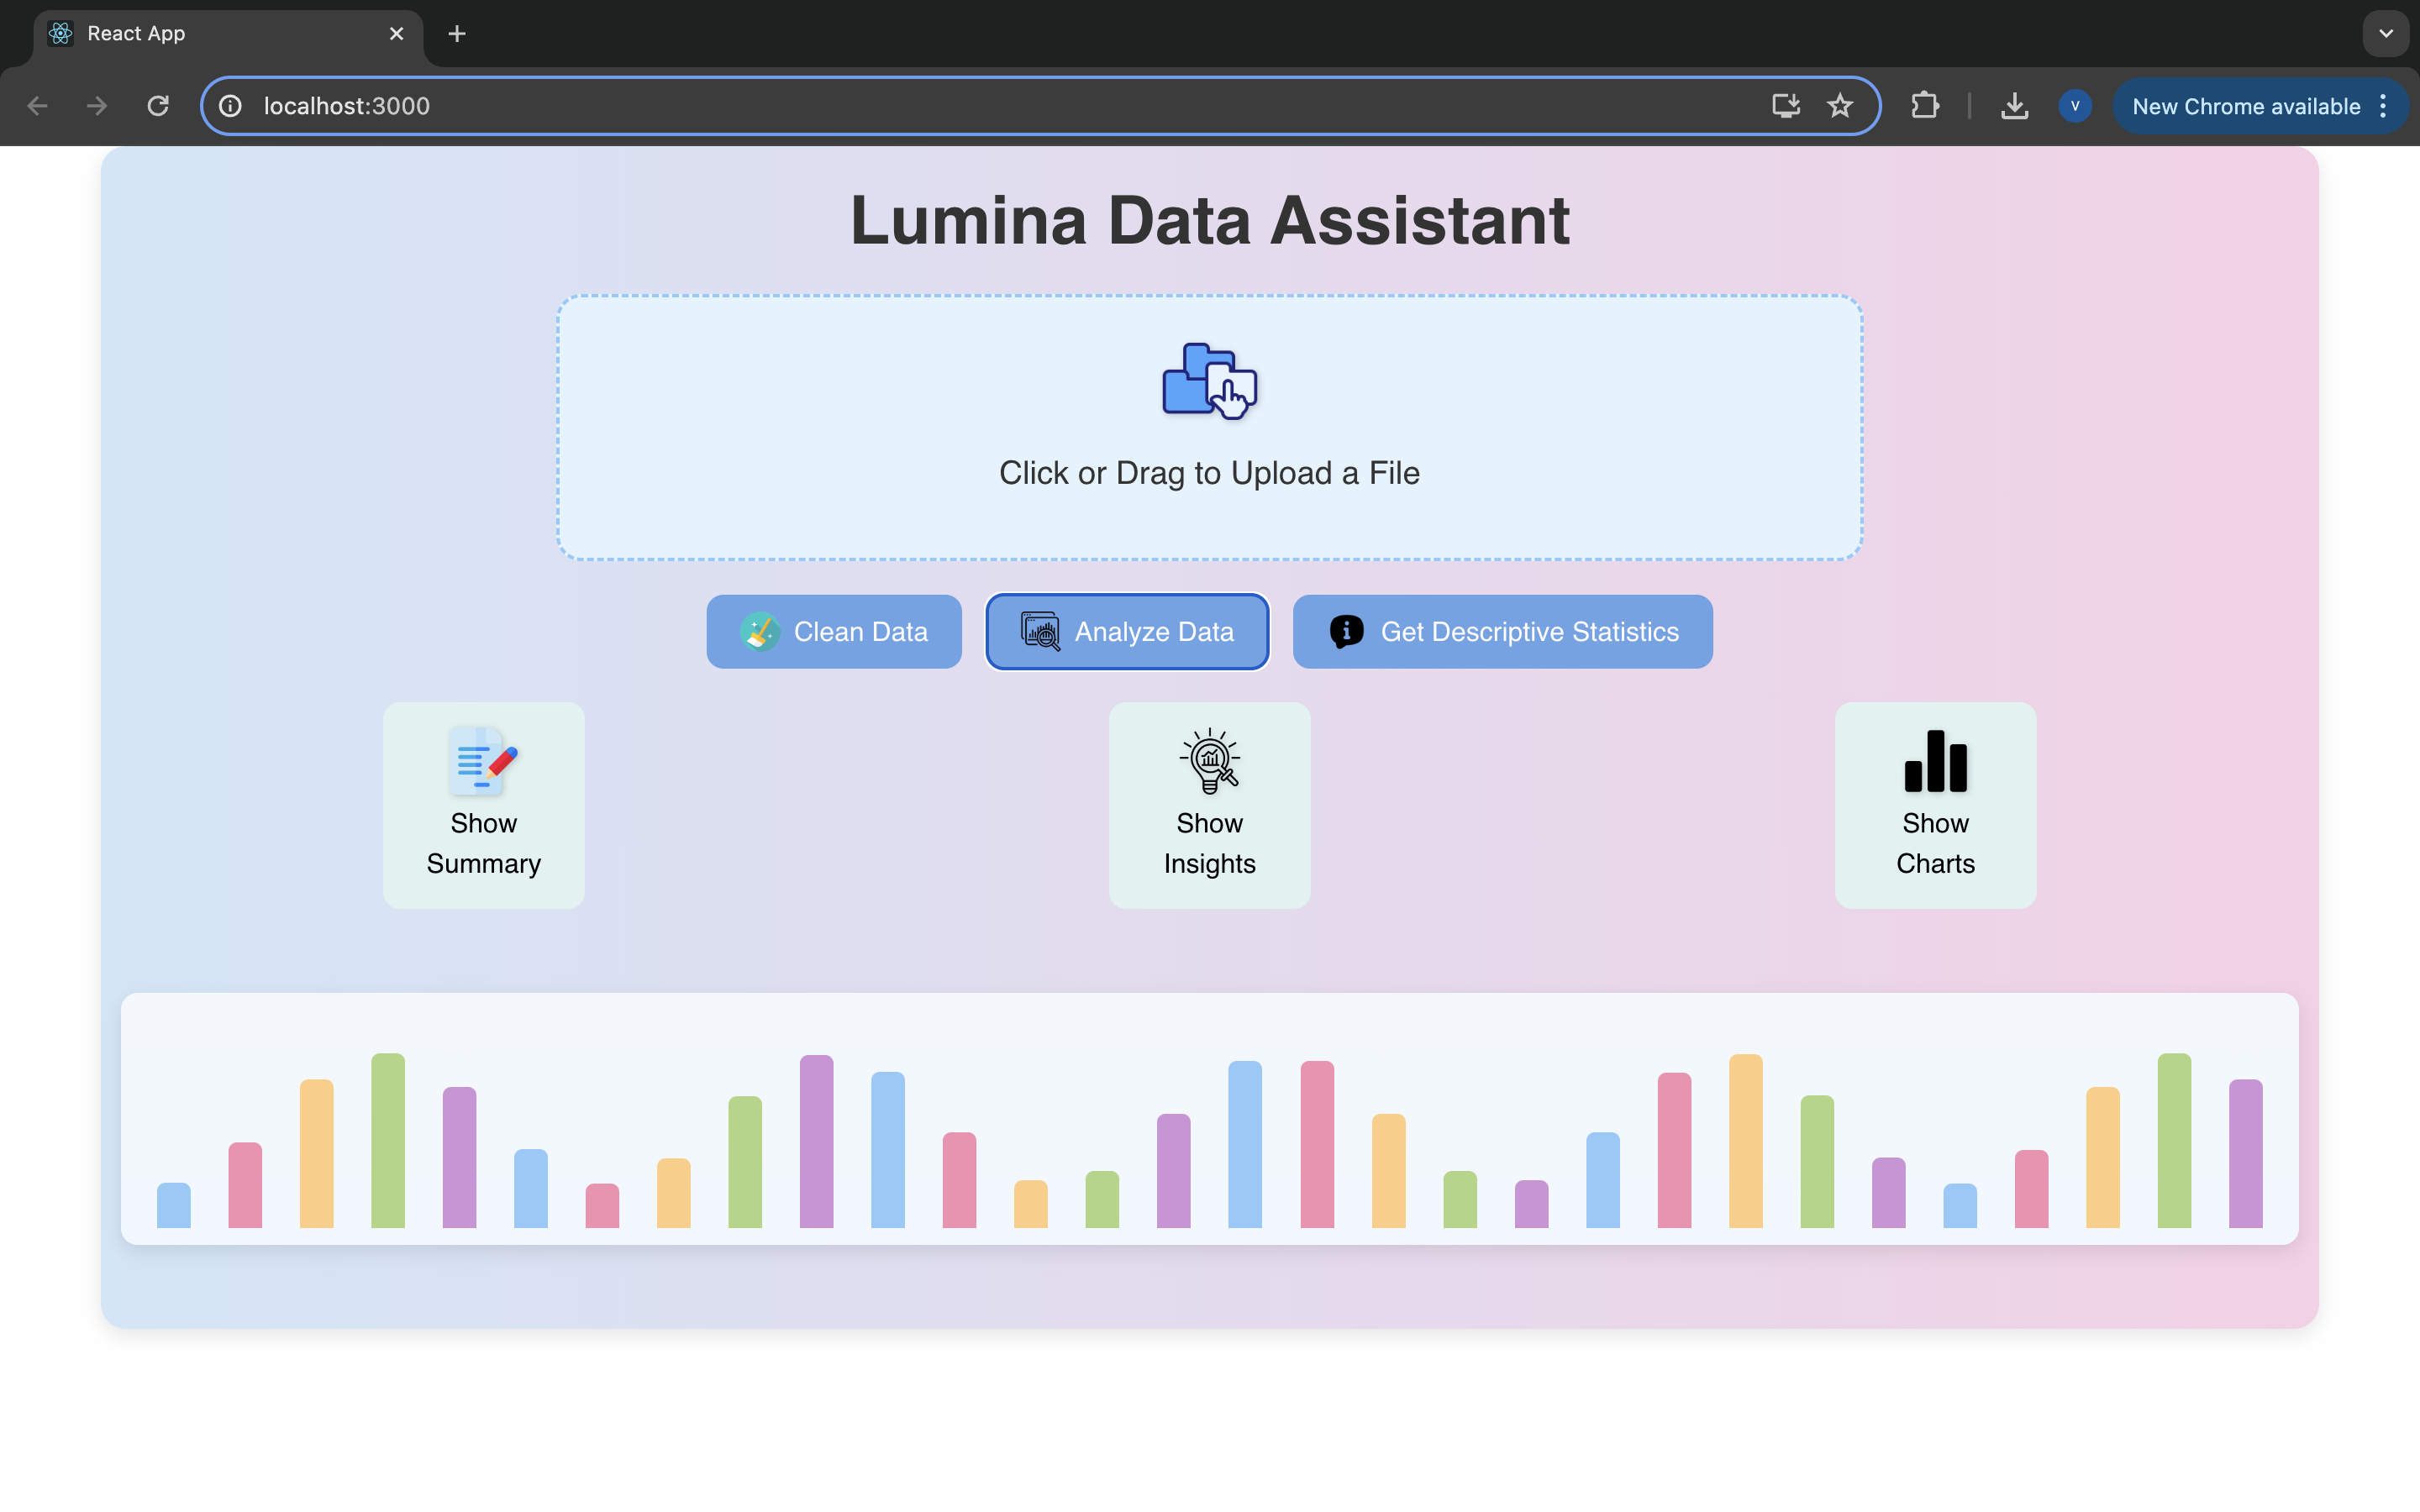
Data Analysis Output Options
-

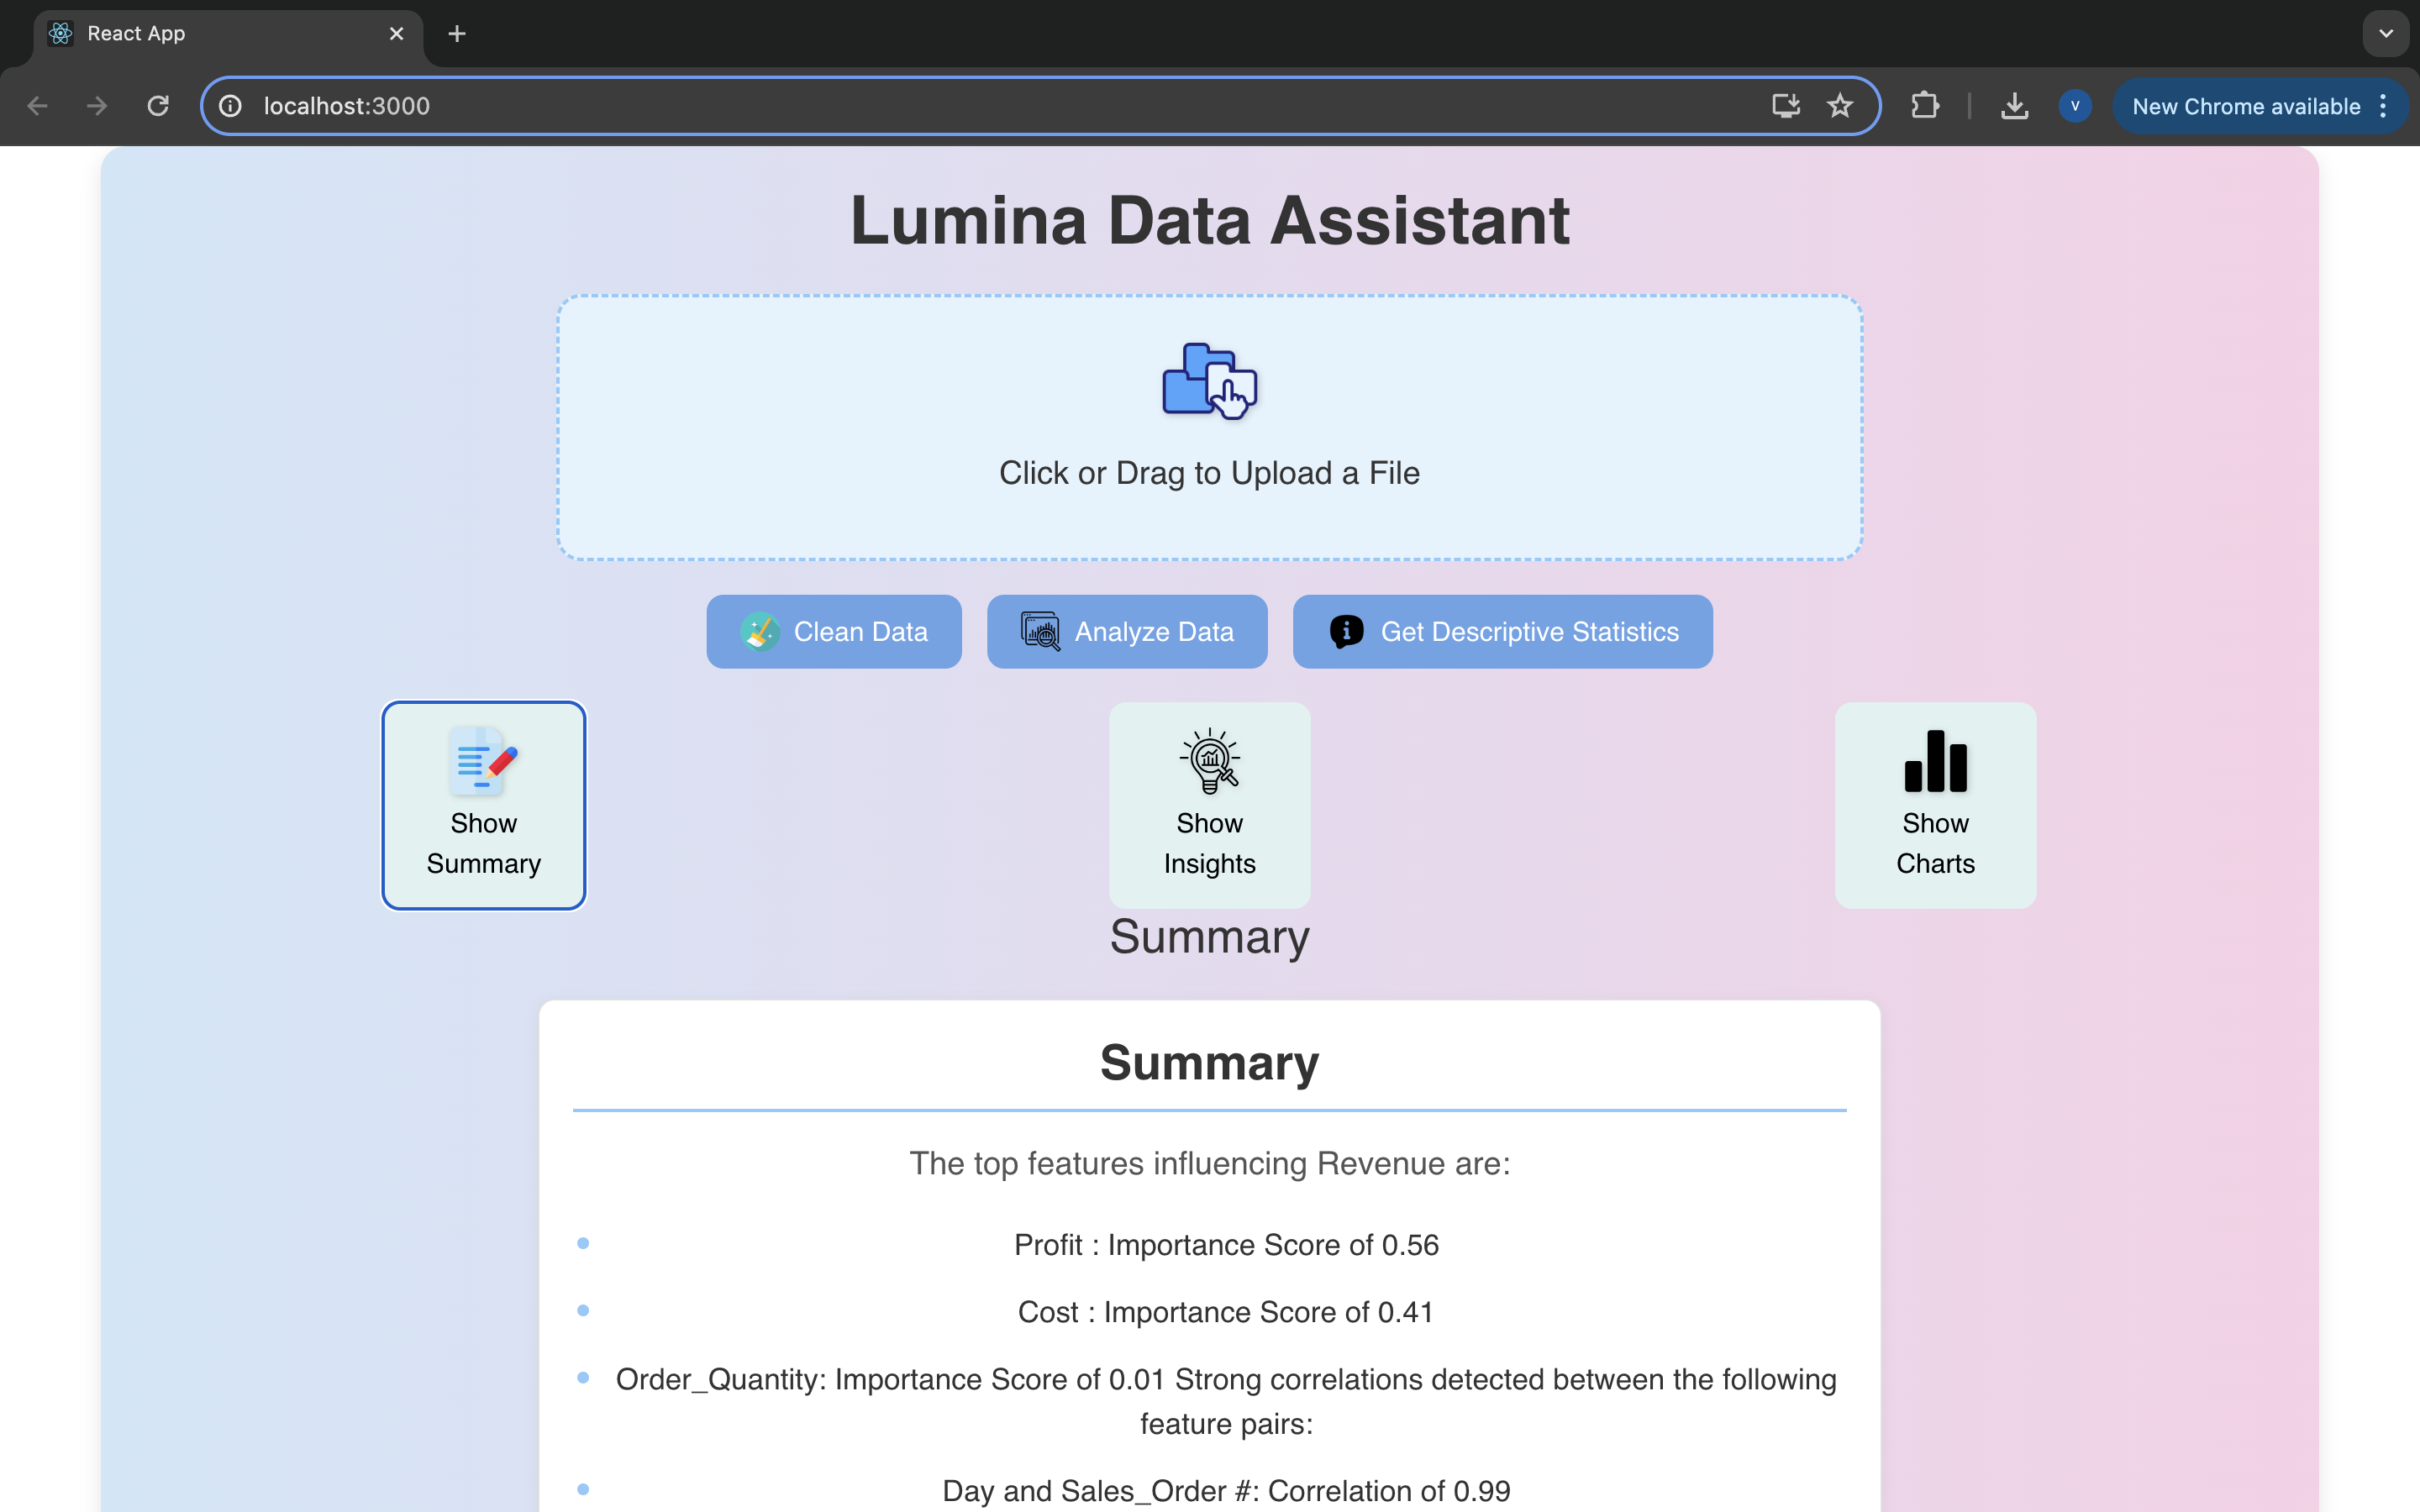
Provided Summary of Data
-

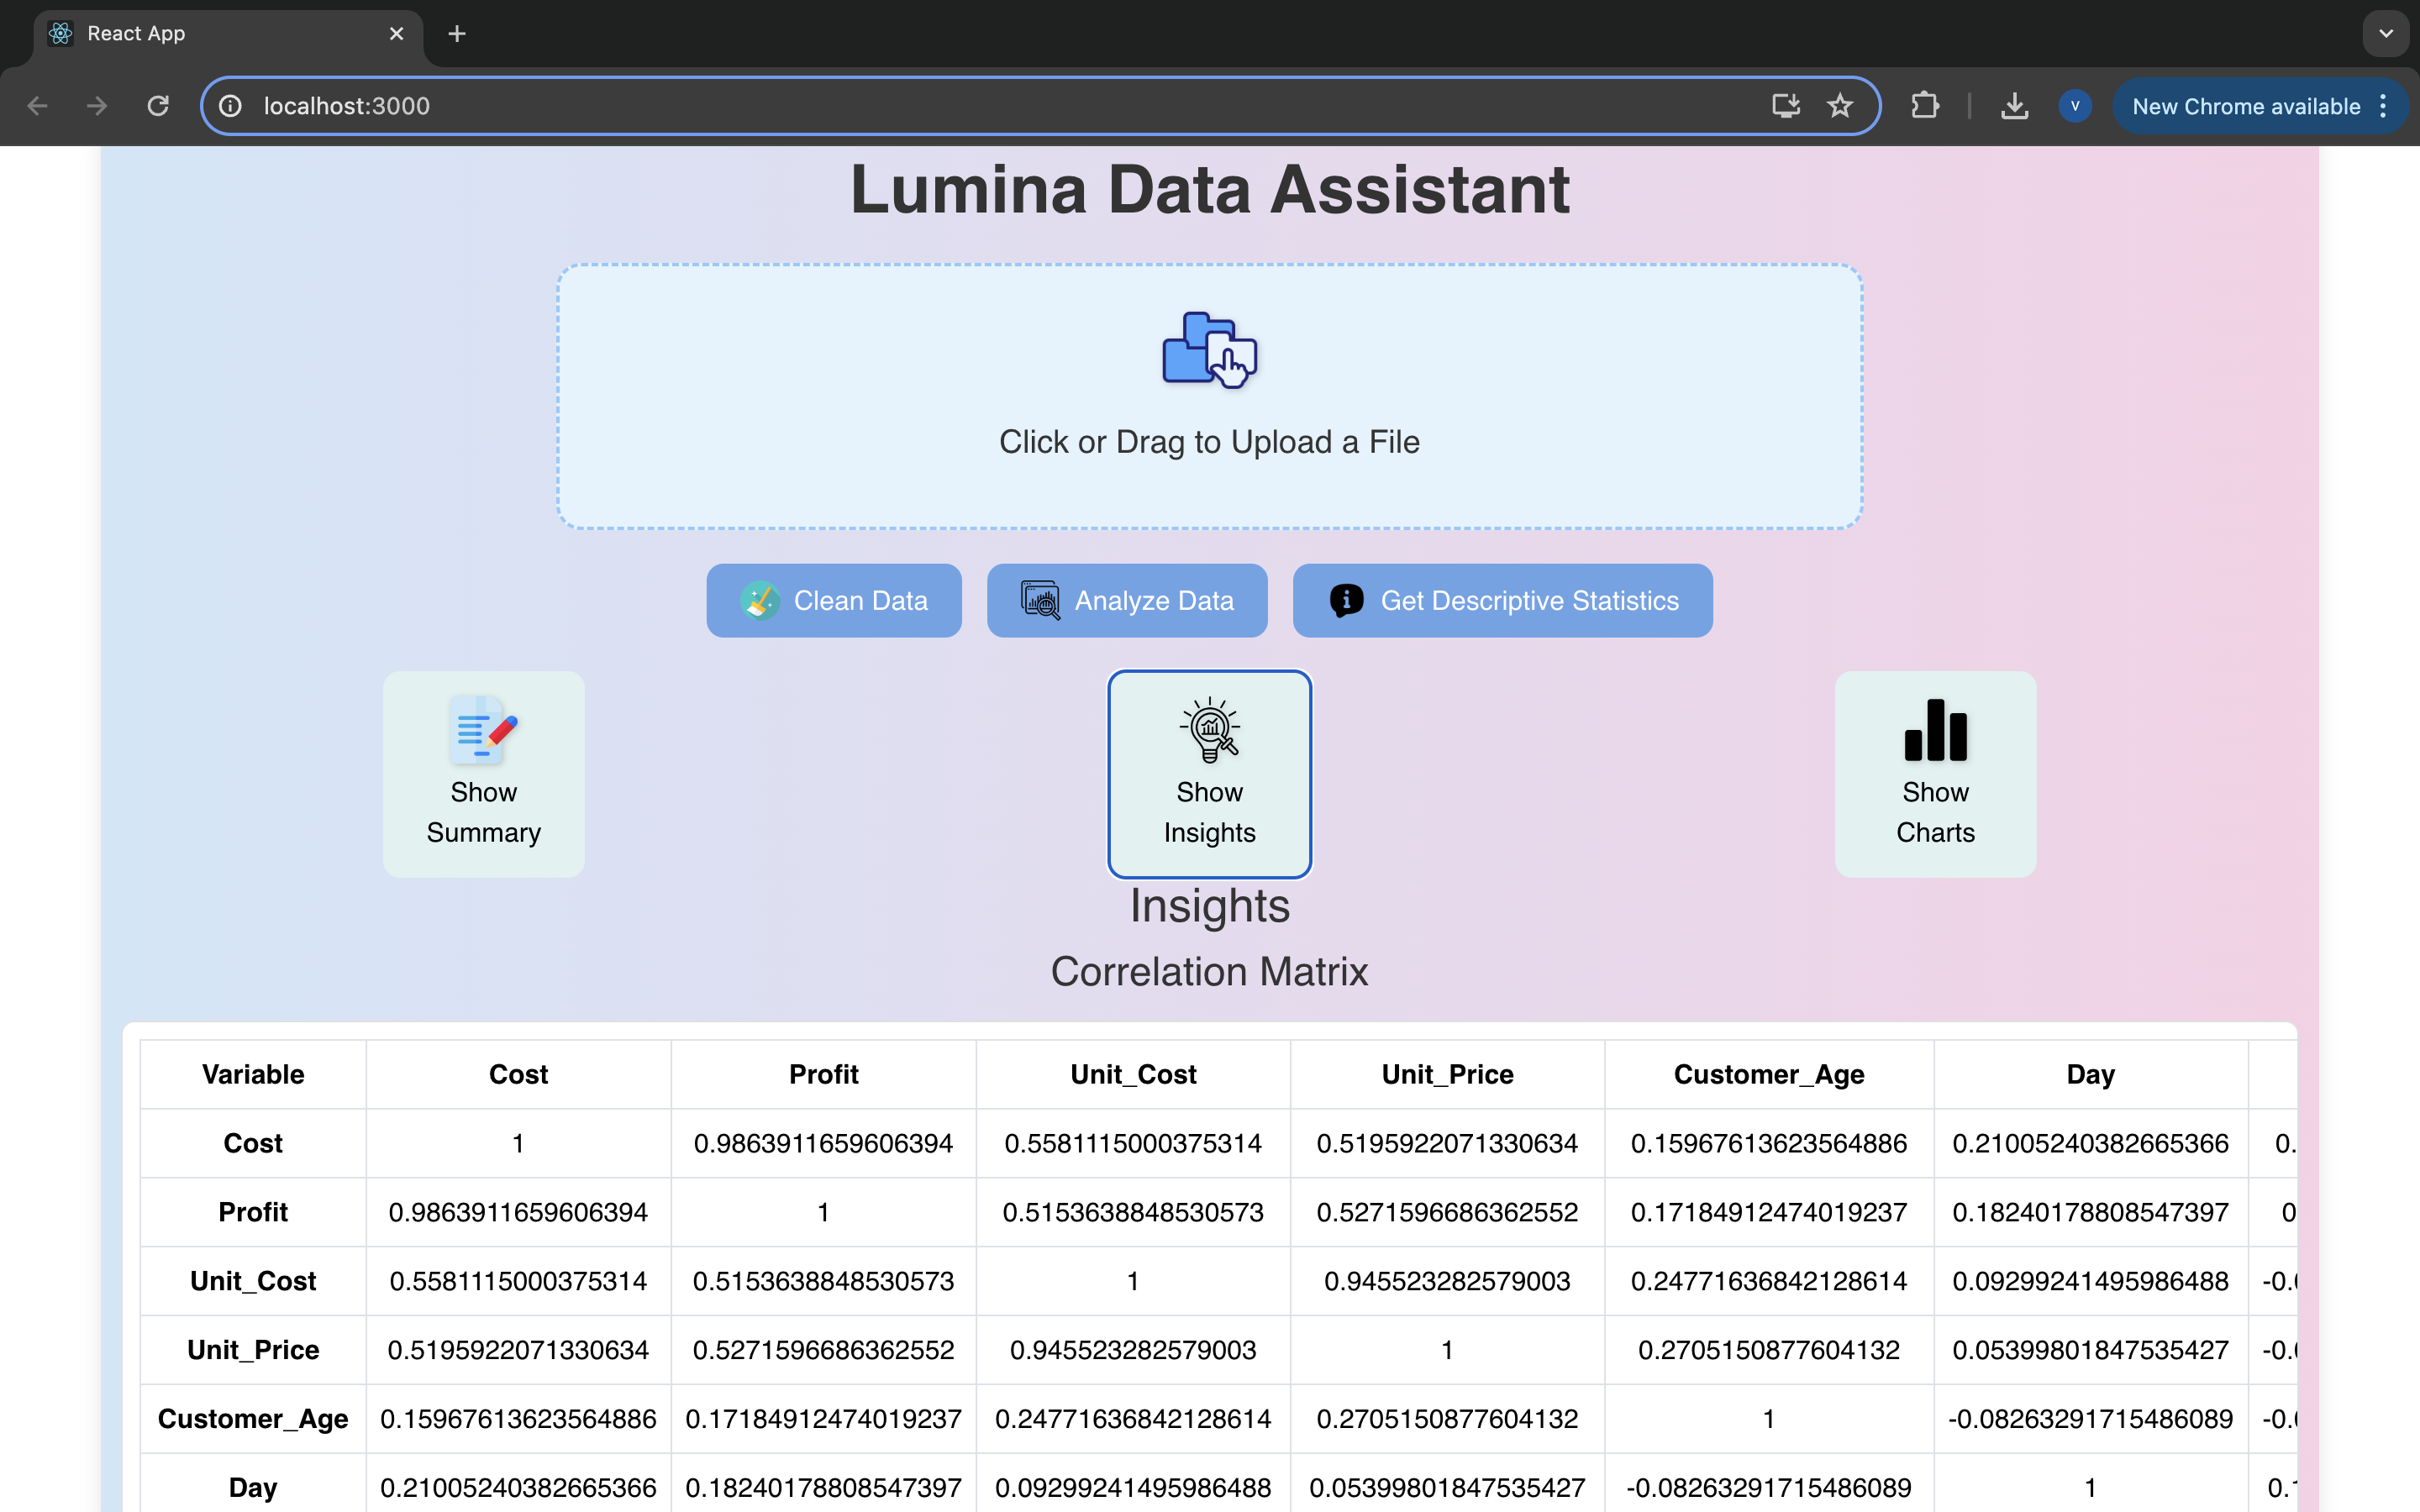
Provided Data Insights
-
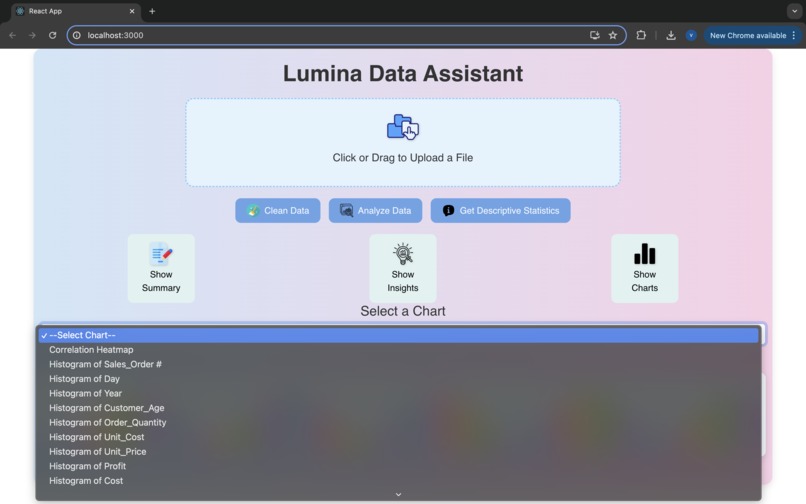
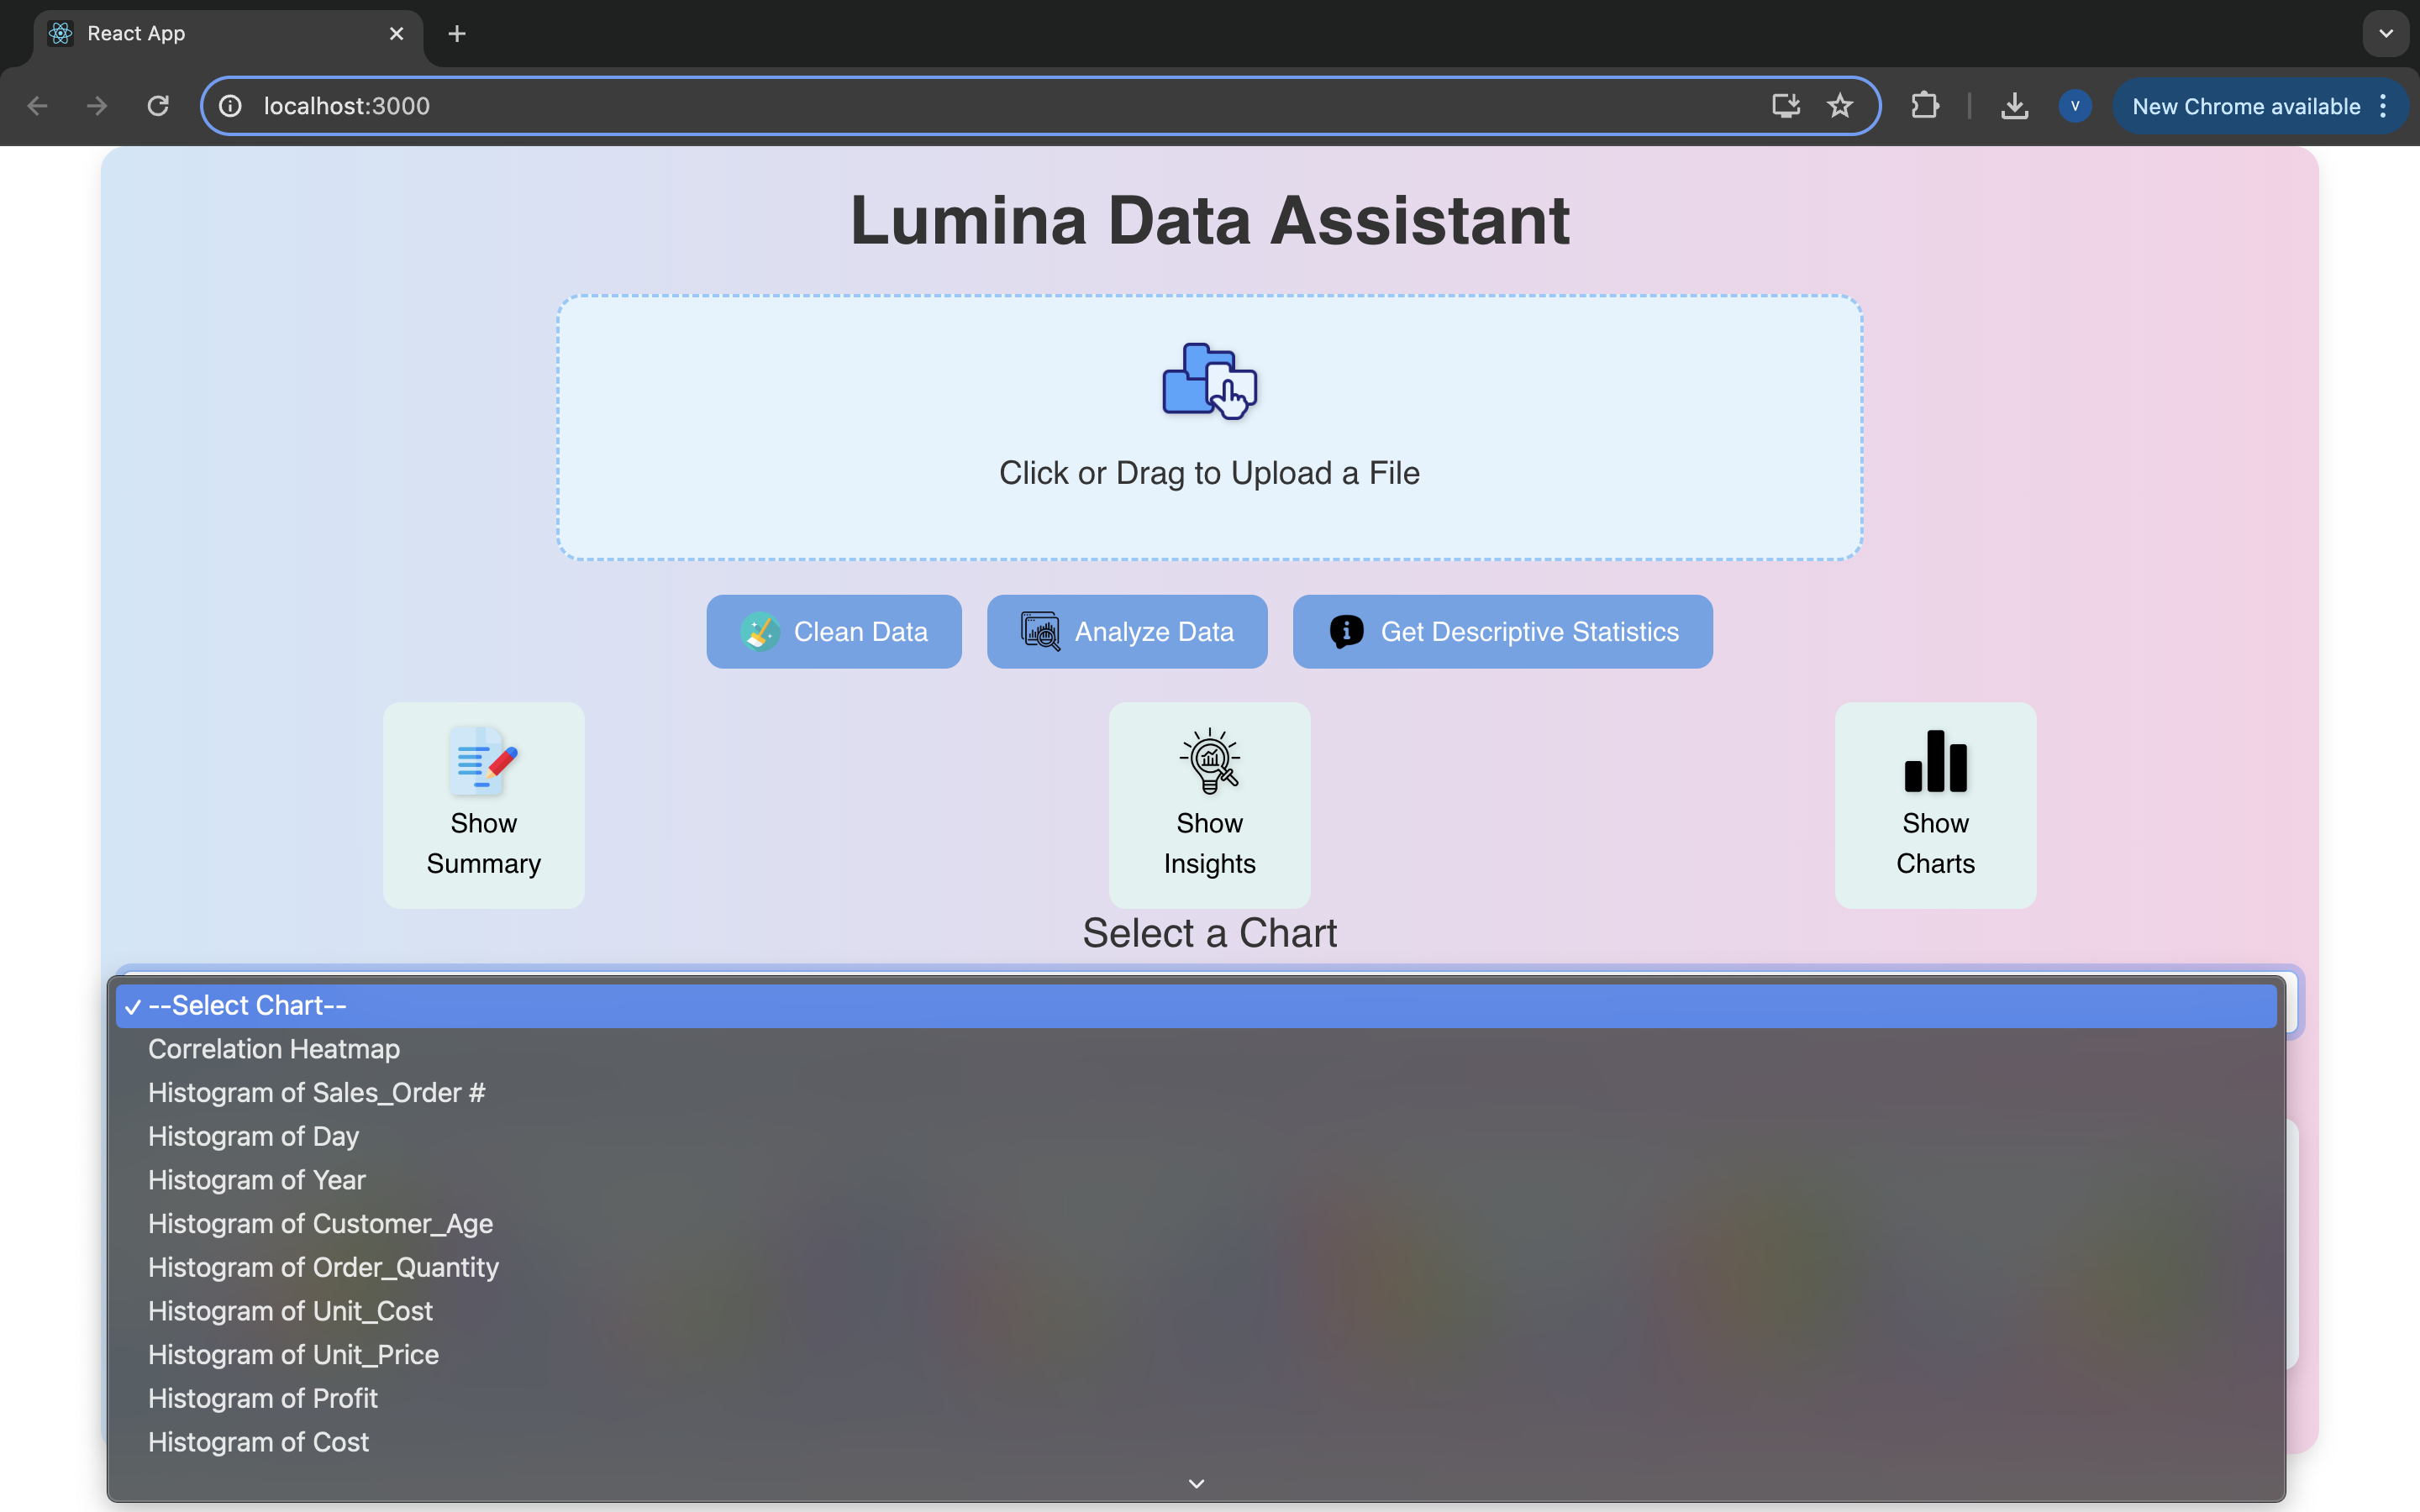
Provided Charts to Display from
-
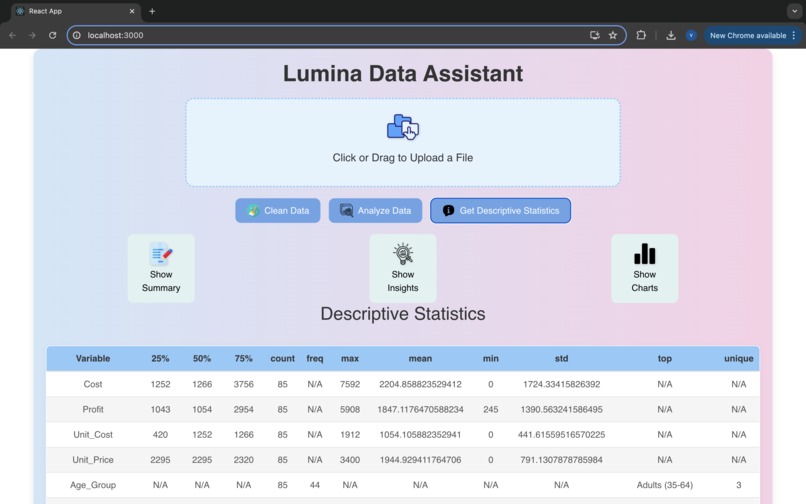
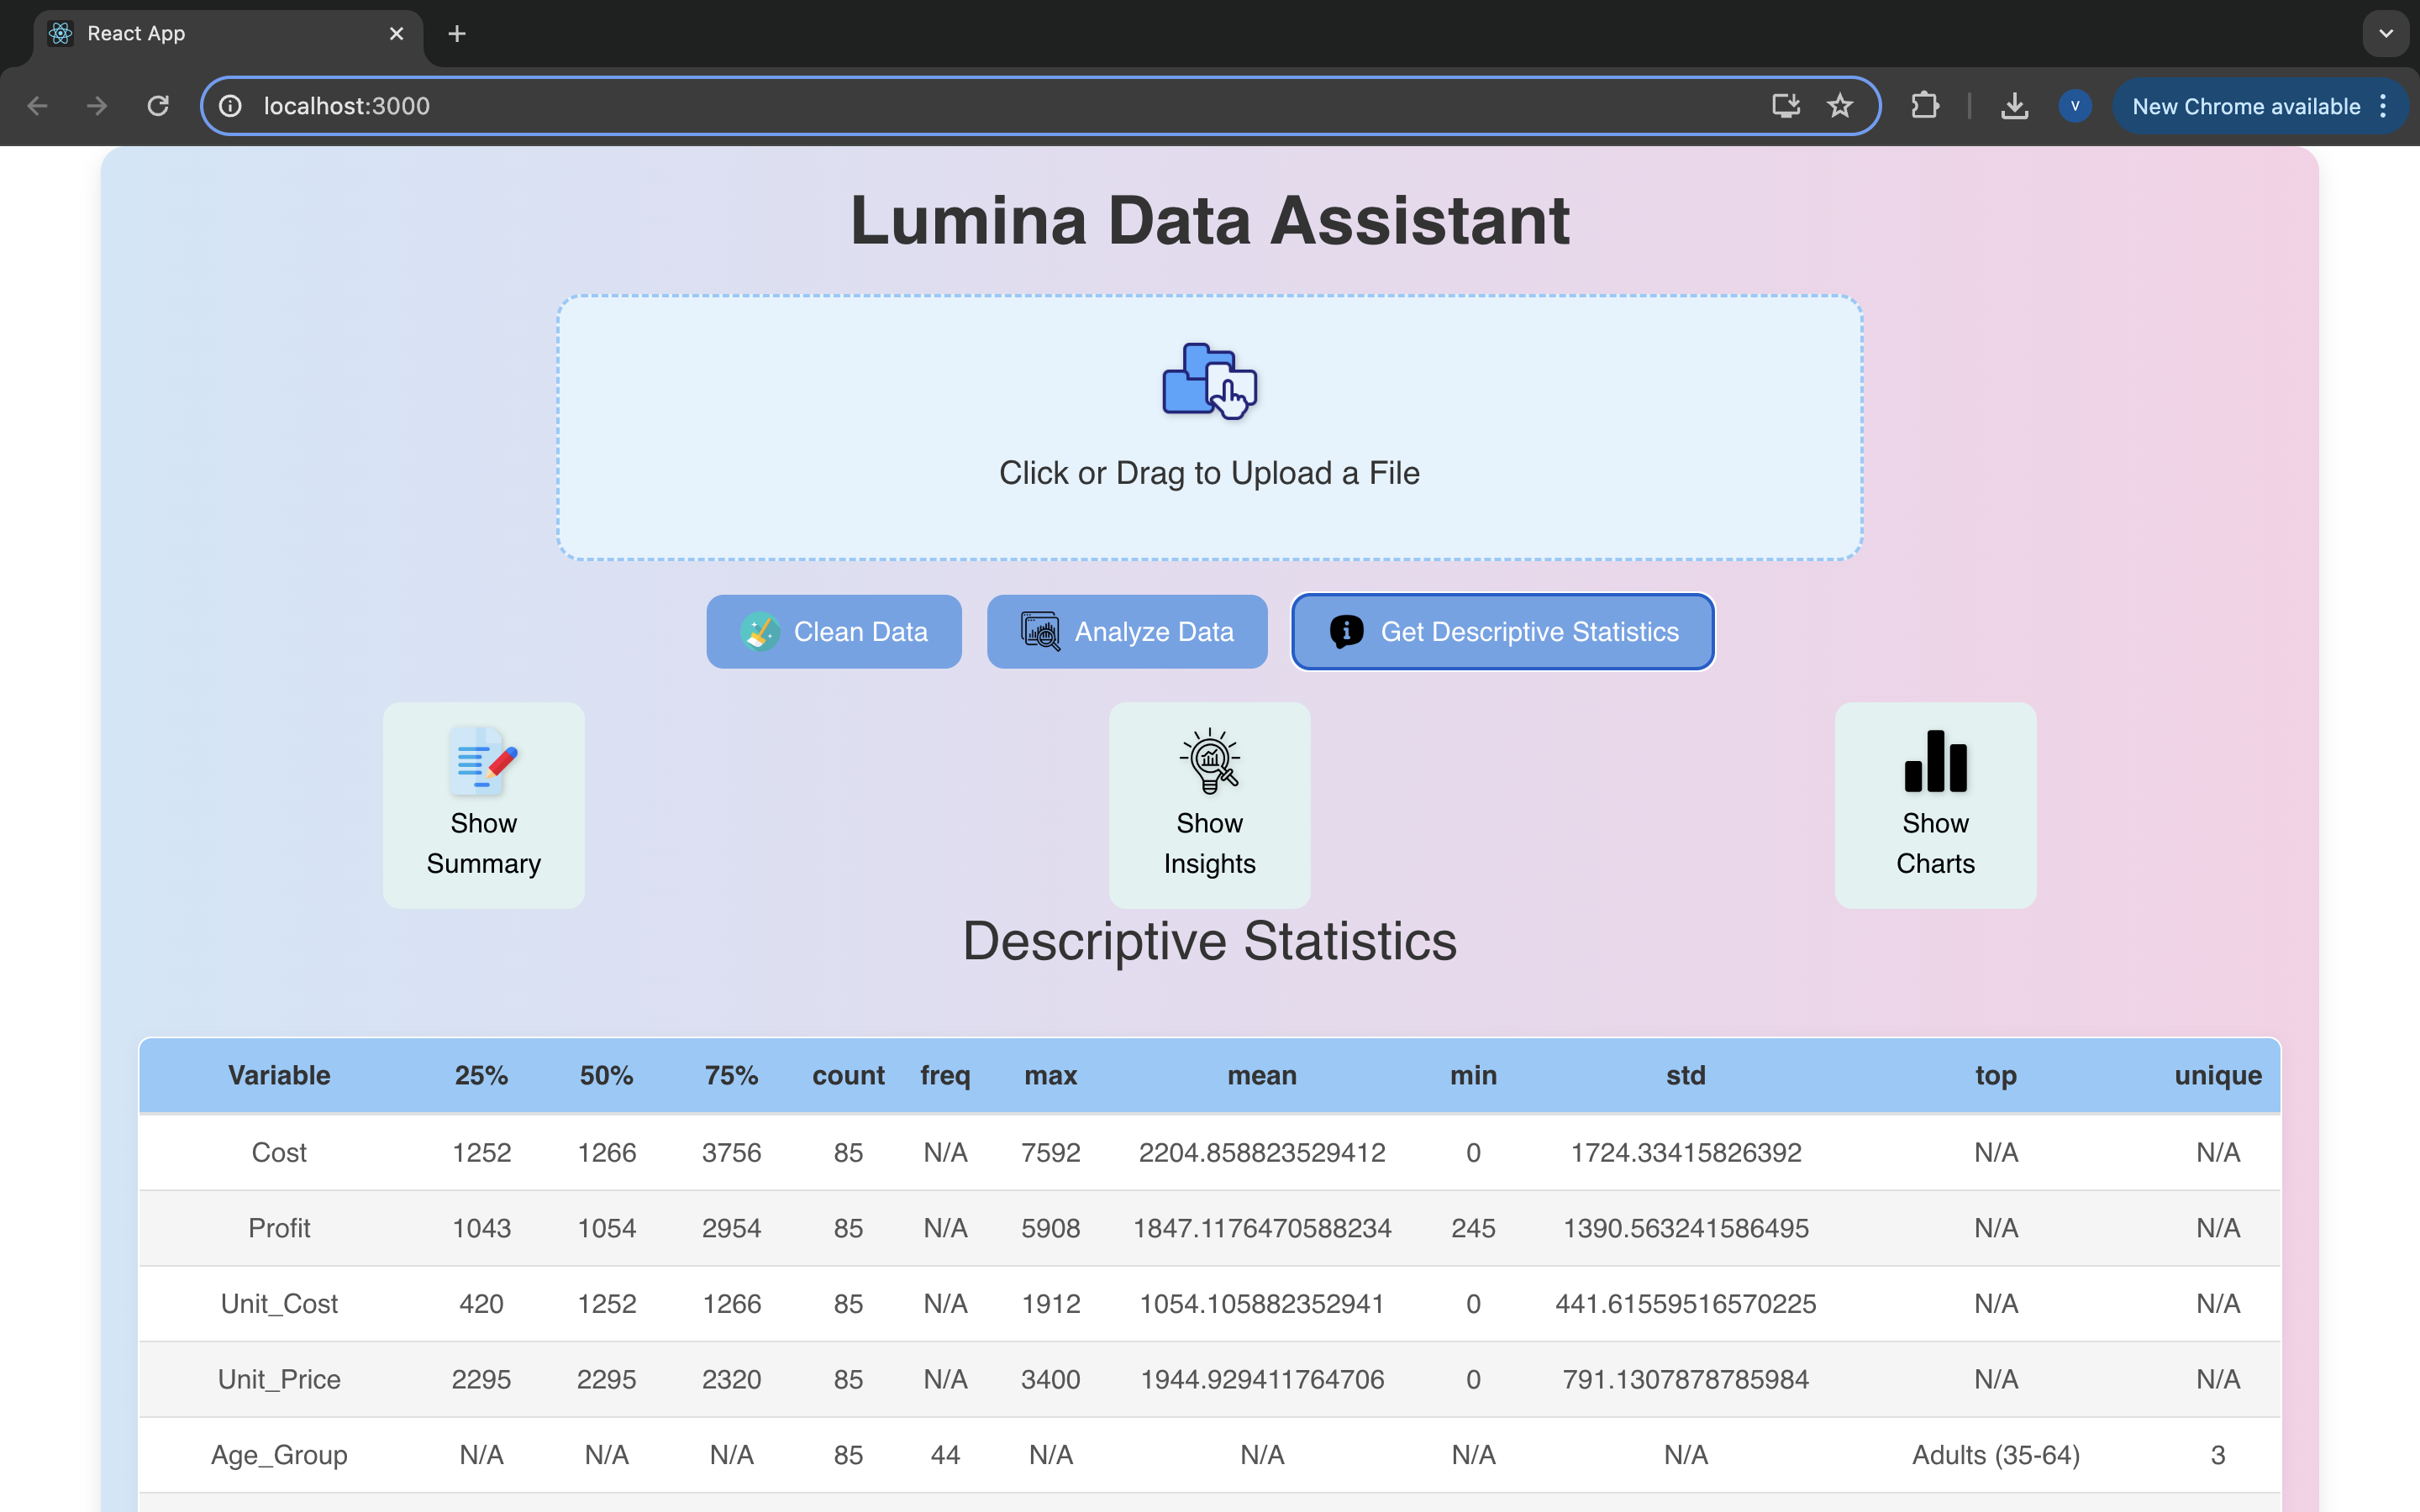
Provided Descriptive Statistics
Inspiration
Data is the backbone of decision-making in many fields, yet working with data can be a daunting task for those without specialized tools or expertise. We wanted to simplify the data processing experience, enabling users to clean, analyze, and visualize data effortlessly in one cohesive, web-based platform. Our goal with Lumina Data Assistant was to make data exploration accessible and engaging for both data novices and experienced analysts by creating a solution that combines intuitive design with powerful analytical capabilities.
What it does
Lumina Data Assistant is a comprehensive data management and analysis tool that empowers users to:
- Upload and Clean Data: Users can upload datasets in formats like CSV or XLSX, and Lumina offers built-in data-cleaning features to prepare the data for analysis with a few clicks.
- Analyse Data: By initiating a single-click analysis, users receive insights through features like correlation matrices, feature importance scores, and model accuracy, which help uncover underlying patterns and relationships.
- Generate Descriptive Statistics: Essential metrics, including mean, median, and standard deviation, are automatically computed to provide users with a snapshot of their dataset’s key characteristics.
- Visualise Data: Lumina presents data insights visually through charts like bar, line, and pie charts, allowing users to interpret their data more effectively.
- Interactive and Aesthetic Interface: The user experience is enhanced through an intuitive interface with engaging animations and visually appealing elements, making data exploration both seamless and enjoyable.
How we built it
We used React on the frontend to create a dynamic, responsive user experience that allows users to interact with and navigate through data analysis workflows seamlessly. For data processing and machine learning, we integrated Python libraries for handling data cleaning, analysis, and predictive modeling, enabling Lumina to provide sophisticated insights like feature importance, correlation, and predictive analytics. The backend API handles data processing requests, while the frontend is built to update instantly with results and visualizations, allowing users to see insights generated in real-time.
Challenges we ran into
Creating a tool with comprehensive data cleaning, analysis, and visualization capabilities presented a few significant challenges:
- Data Handling: Ensuring Lumina could efficiently process large datasets while maintaining smooth performance was a priority and required optimizing our backend for scalability.
- User Experience Design: Building an interface that feels both powerful and approachable was challenging. We focused on balancing functionality with a clean, intuitive design to ensure users of all levels would feel comfortable navigating the app.
- Machine Learning Integration: Integrating machine learning models seamlessly in a way that would provide valuable insights without overwhelming users was another technical challenge we overcame through model optimisation and backend handling.
Accomplishments that we're proud of
We’re proud to have developed a tool that can assist a wide range of users—from students and data enthusiasts to business professionals and researchers—in exploring their data effectively. Achieving a polished, interactive, and feature-rich experience is something we’re particularly proud of. The successful integration of machine learning capabilities means Lumina doesn’t just process data; it provides actionable insights, making it a valuable tool for informed decision-making.
What we learned
Throughout this project, we learned a lot about the balance between usability and functionality. Building a complex tool with a user-friendly experience required constant refinement and an understanding of how different user groups approach data analysis. We also deepened our knowledge in data processing, visualisation, and machine learning integration within a React framework.
What's next for Lumina Data Assistant
Looking ahead, we’re excited to:
- Expand Machine Learning Capabilities: Adding more sophisticated predictive models and customisation options for users who wish to conduct advanced analyses.
- Enhance Visualisation Options: Offering more chart types and customisation to allow users to explore their data in even greater depth.
- Introduce Collaboration Features: Enabling users to share datasets, visualisations, and insights with others to facilitate collaborative data exploration and decision-making.

Log in or sign up for Devpost to join the conversation.