
🌊 Lumina
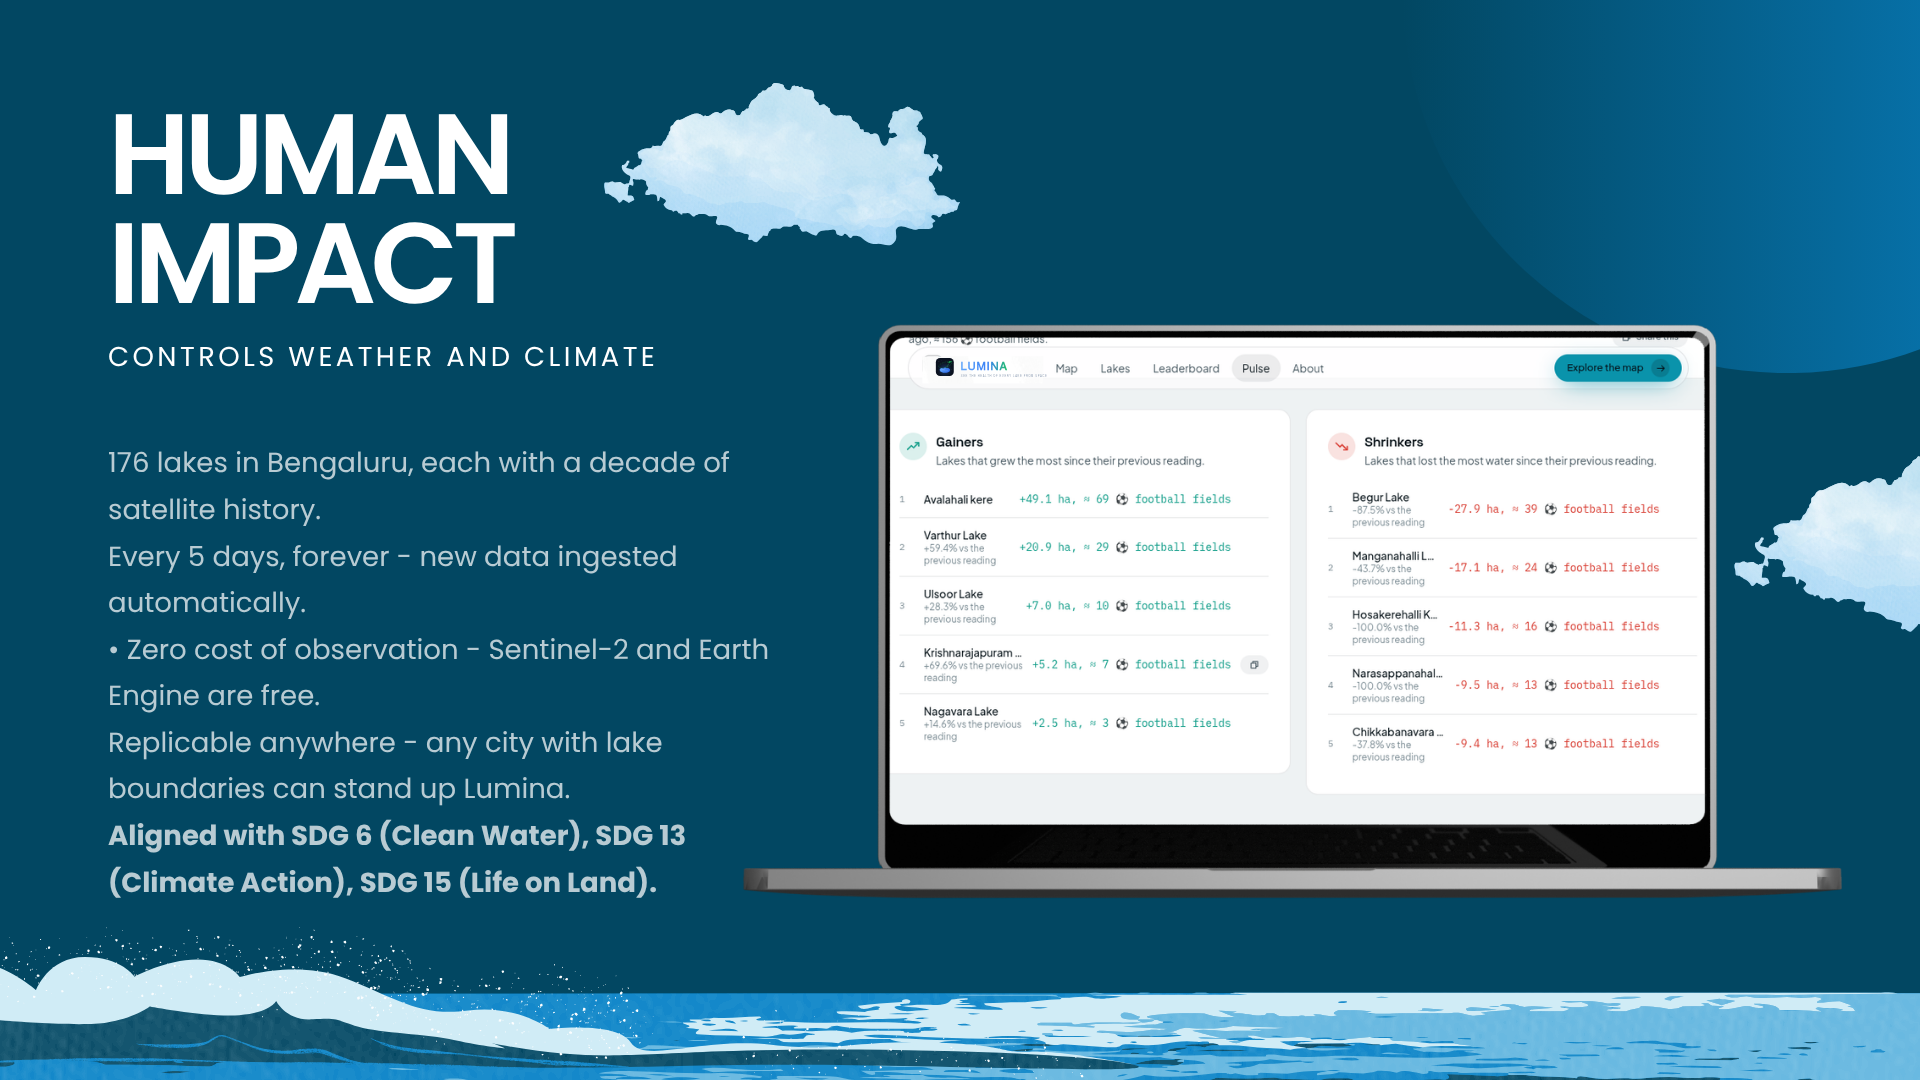
176 lakes, tracked live. Ten years of satellite history, backfilled to 2015. New imagery every 5 days at 10 m per pixel. A colorblind-safe health scale. $0 per lake, MIT licensed.
Lumina turns free Sentinel-2 imagery into a live, public intelligence platform for urban lakes — measuring water loss, algae blooms, and recovery for every lake in a city, every few days. It finally reads the photographs.
🛰️ The Quiet Crisis
Every lake on Earth is photographed every five days. Nobody reads the photographs.
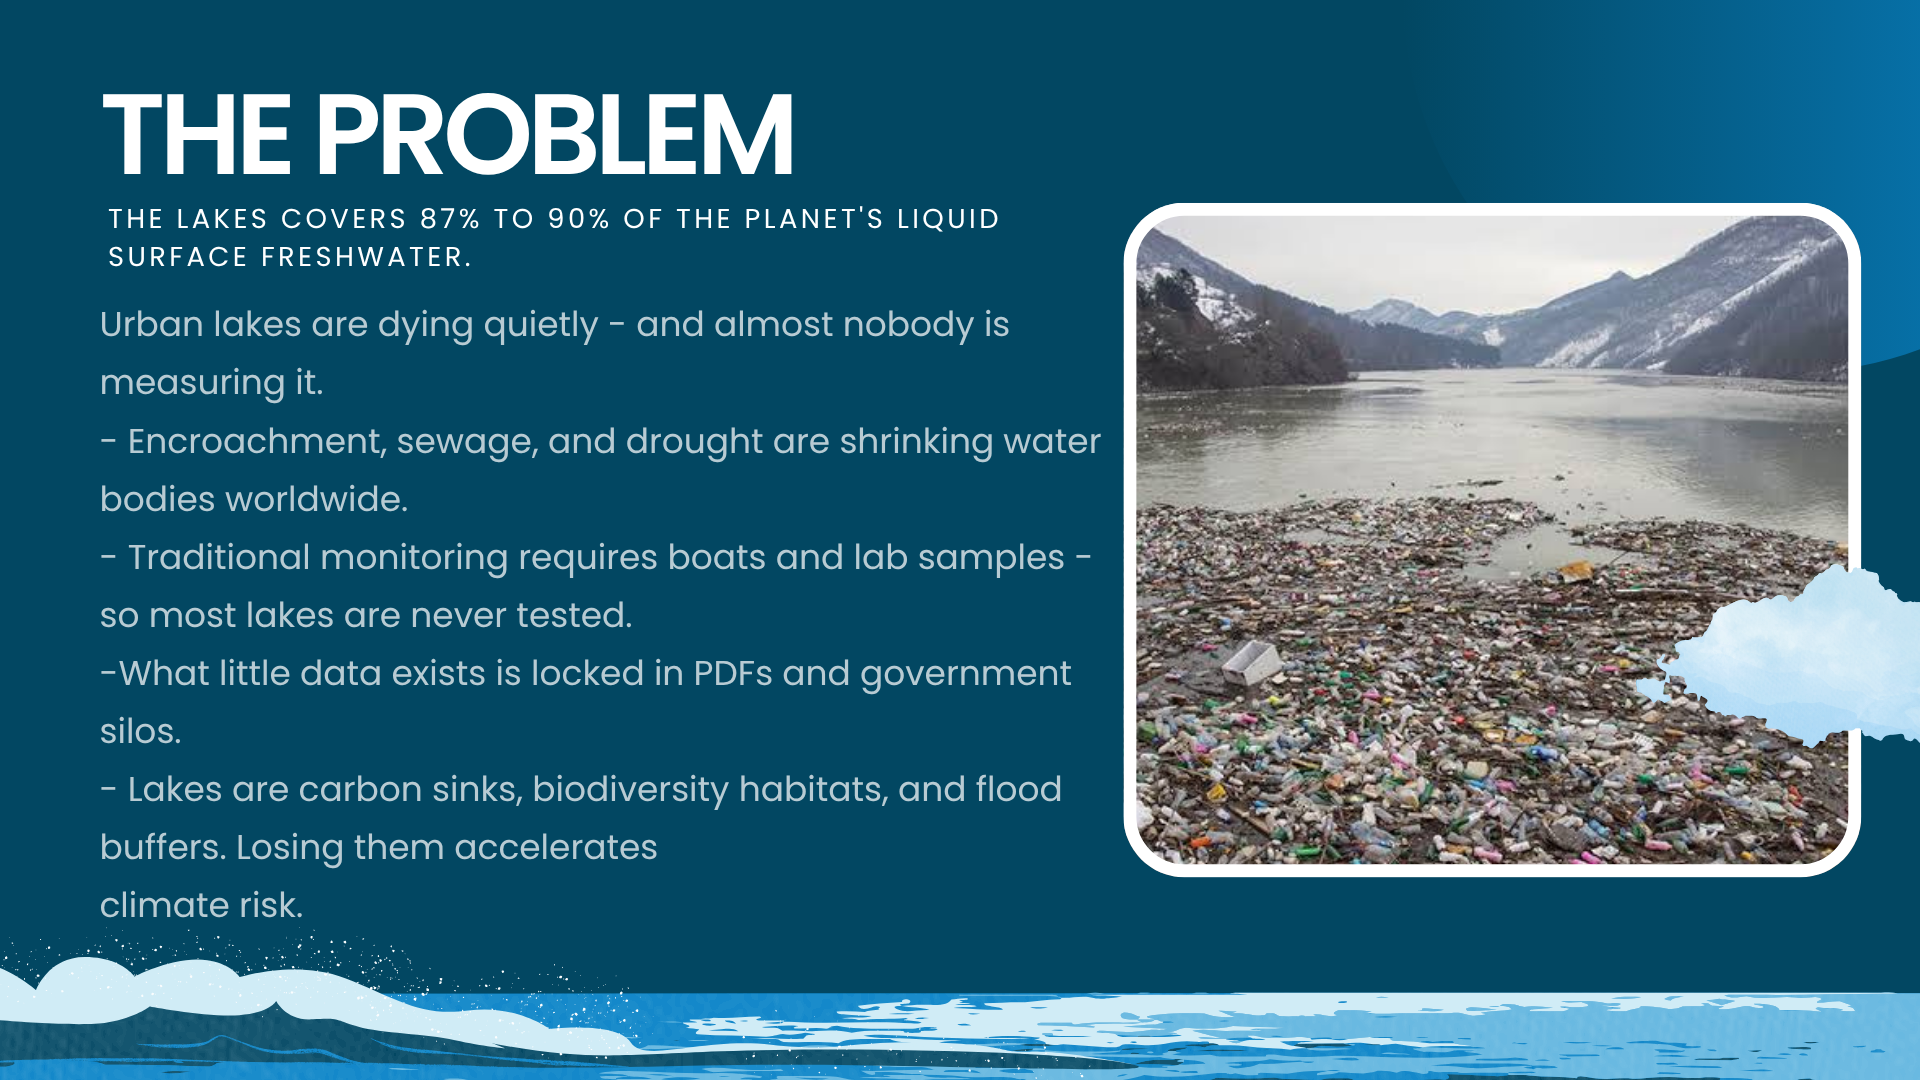
That single observation is the heart of Lumina. Cities bleed their lakes away — encroached, silted, blooming with algae — and the official record is a PDF table somebody drew once a year. The photograph of the problem exists. It's just unread.
The data is captured; comprehension is the bottleneck.
| 🏙️ Vanishing lakes | Encroachment, sewage, drought; Bengaluru lost dozens of ~200 lakes in one generation |
| 🧪 Unscalable monitoring | Boats, lab samples, funding — most lakes are never tested; by the time it's visible from shore, it's often irreversible |
| 🗄️ Locked data | PDFs and silos, invisible to citizens, activists, planners |
| 🌡️ Planetary stakes | Lakes are carbon sinks, habitats, flood buffers, groundwater recharge |
🔬 The Pixel That Tells the Truth
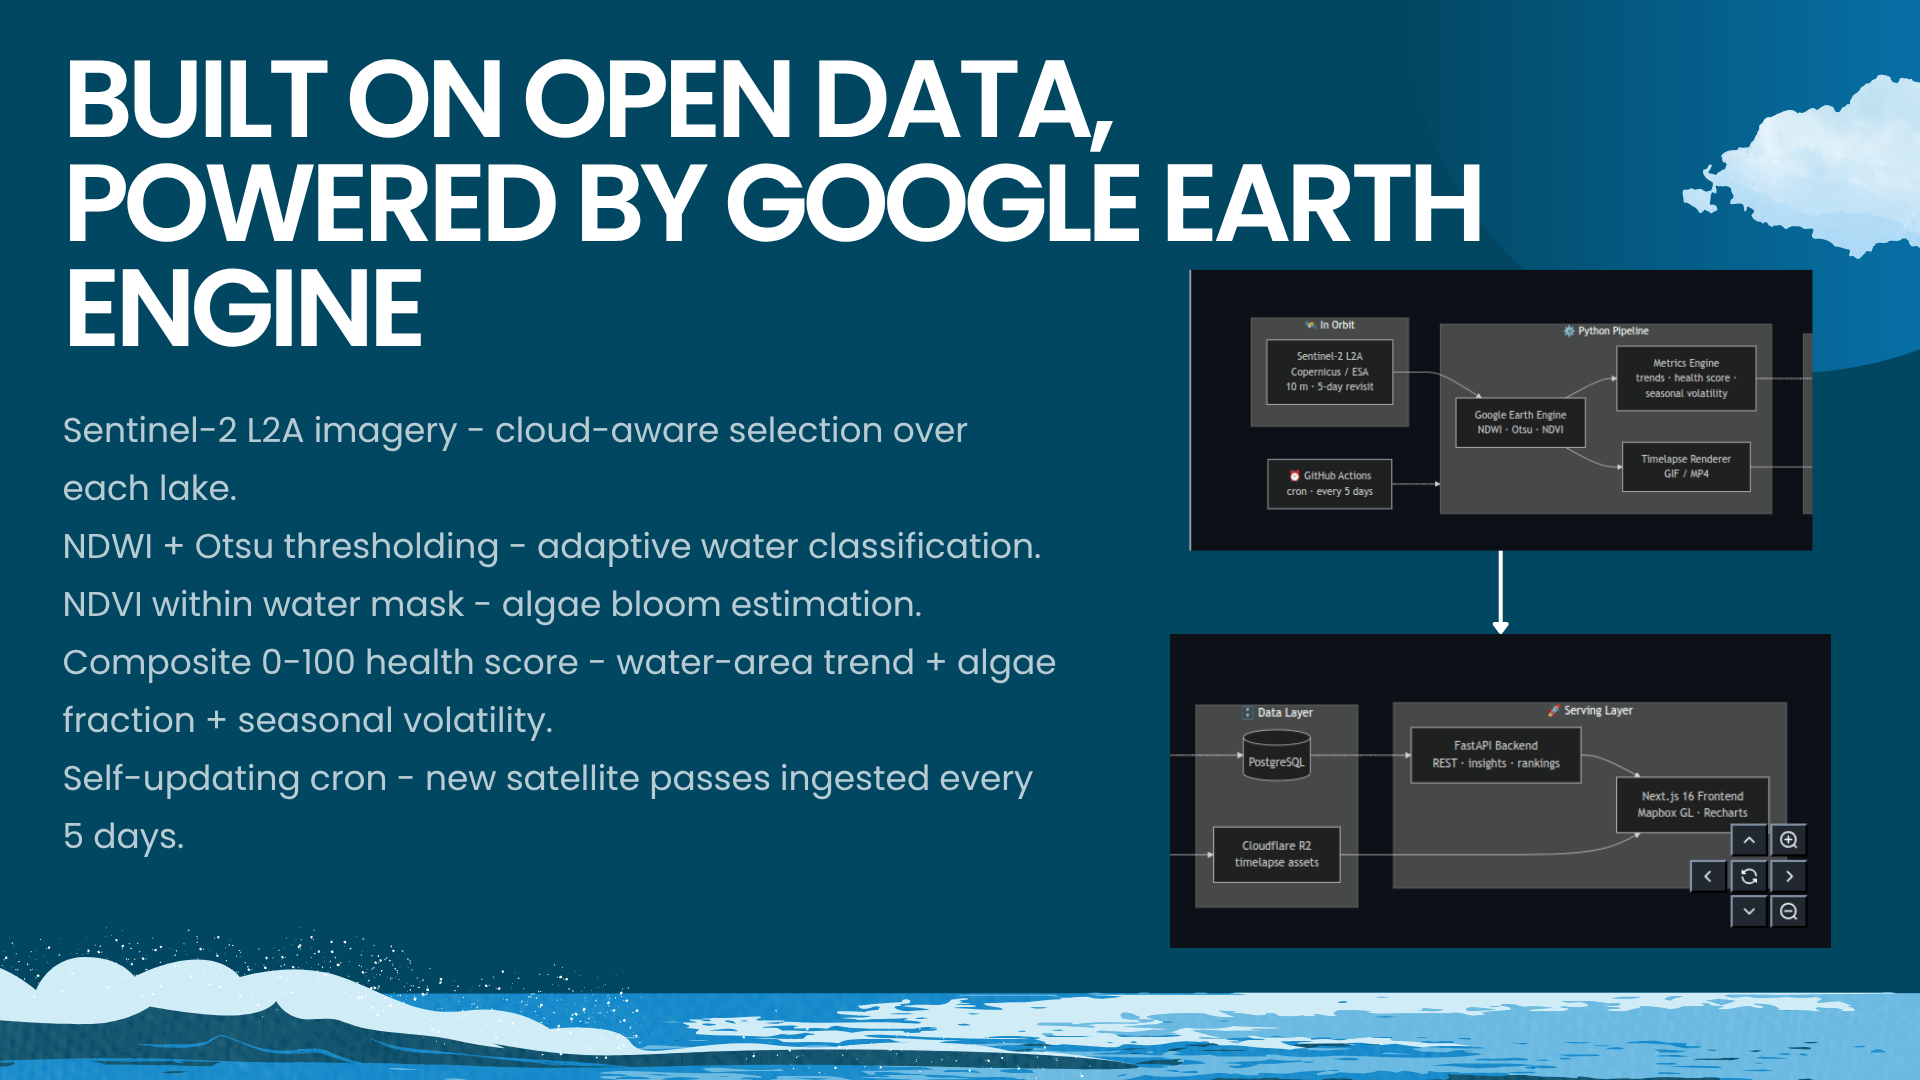
Lumina closes the loop — computed server-side on Google Earth Engine.
  Sentinel-2 passes overhead (every ~5 days)
                    │
                    ▼
   ┌───────────────────────────────────────┐
   │  📡 Pull imagery automatically          │
   │  💧 NDWI + adaptive Otsu threshold      │
   │     → exact water surface area          │
   │  🦠 NDVI within the water mask          │
   │     → algae blooms & weed cover         │
   │  💯 Health score 0–100                  │
   │     trend · algae · volatility          │
   └───────────────────────────────────────┘
                    │
                    ▼
  🗺️ Live map · 🏆 Leaderboards · 🎞️ Timelapses · 📊 Charts
Answers in one glance:
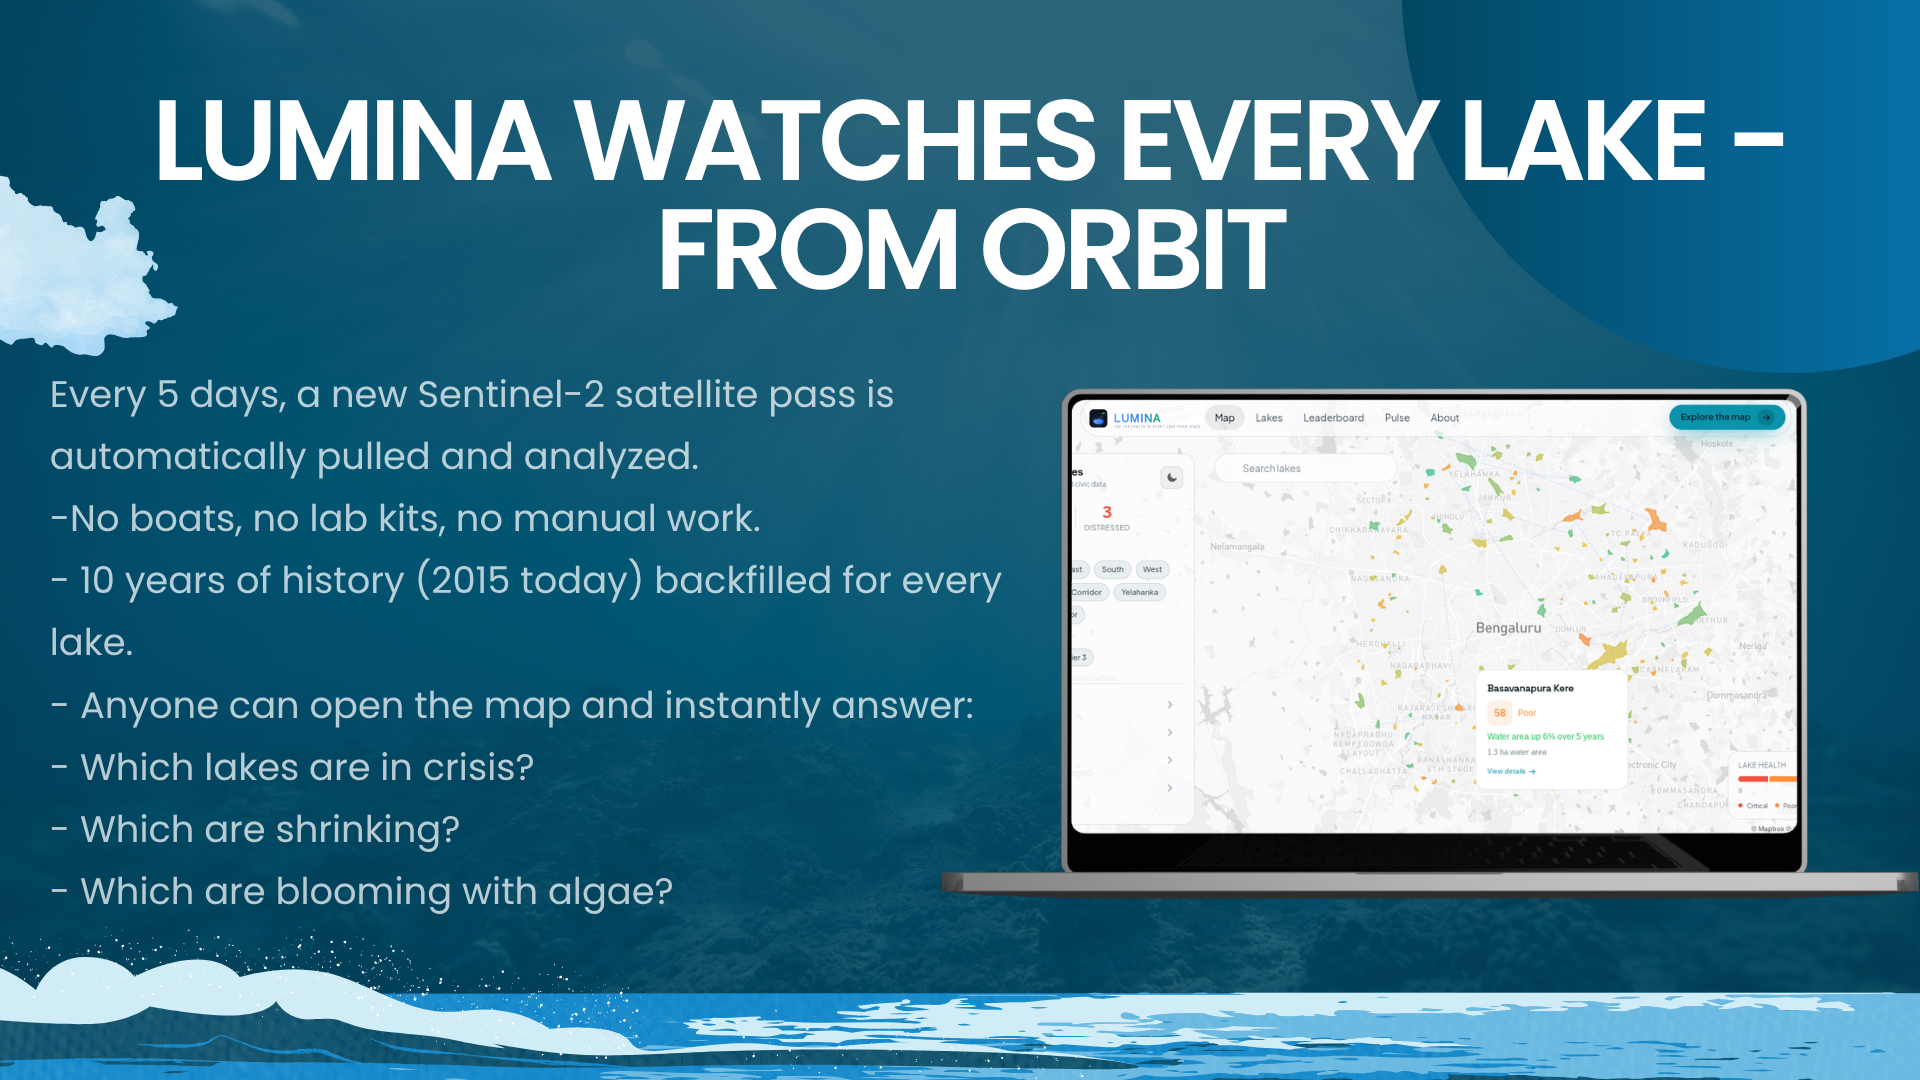
- 🔴 Which lakes are in crisis now (ranked health)
- 📉 Which lakes shrink (10-year trends)
- 🦠 Which bloom (NDVI proxy)
- 🆚 What changed since 2017 (drag-to-compare)
Colorblind-safe by design — teal, not green; distinct luminance at every stop; survives grayscale.
🌅 A Decade of History
Ten years backfilled on day one, so trends surface in weeks — while restoration is still possible.
| 🛰️ Sentinel-2 archive | COPERNICUS/S2_SR_HARMONIZED, 10 m/pixel |
| ☁️ Lake-level cloud filter | Rejected only if the lake is cloudy — rescues monsoon scenes |
| 💧 NDWI + Otsu adaptive threshold | Self-calibrates per scene — no fragile fixed cutoff |
| 🦠 NDVI algae estimate | Within the water mask |
| 💯 Health Score 0–100 | Trend + algae + seasonal volatility |
| ⚖️ Relatable units | "≈35 football fields lost" — citizens feel the number |
🌍 From Orbit to Action
Remote sensing stops being a science project when it becomes civic infrastructure.
| Earth Forward pillar | Mechanism | Outcome |
|---|---|---|
| 🌊 Water conservation | Per-lake area tracked every 5 days, decade-deep | Shrinkage detected in weeks |
| 🌡️ Climate resilience | Quantify failing flood buffers/recharge | Cities see failure before the flood |
| 🦆 Ecosystems | Automatic algae-bloom detection + health scoring | Pollution surfaces without dead fish |
| 🏘️ Communities | Free dashboard, relatable units, shareable cards | One trusted picture for all |
| ⚖️ Equity | $0/lake, open source, any city deployable | Monitoring as public infrastructure |
UN SDGs: 🎯 SDG 6 · SDG 11 · SDG 13 · SDG 15
🧭 The System, Instrumented
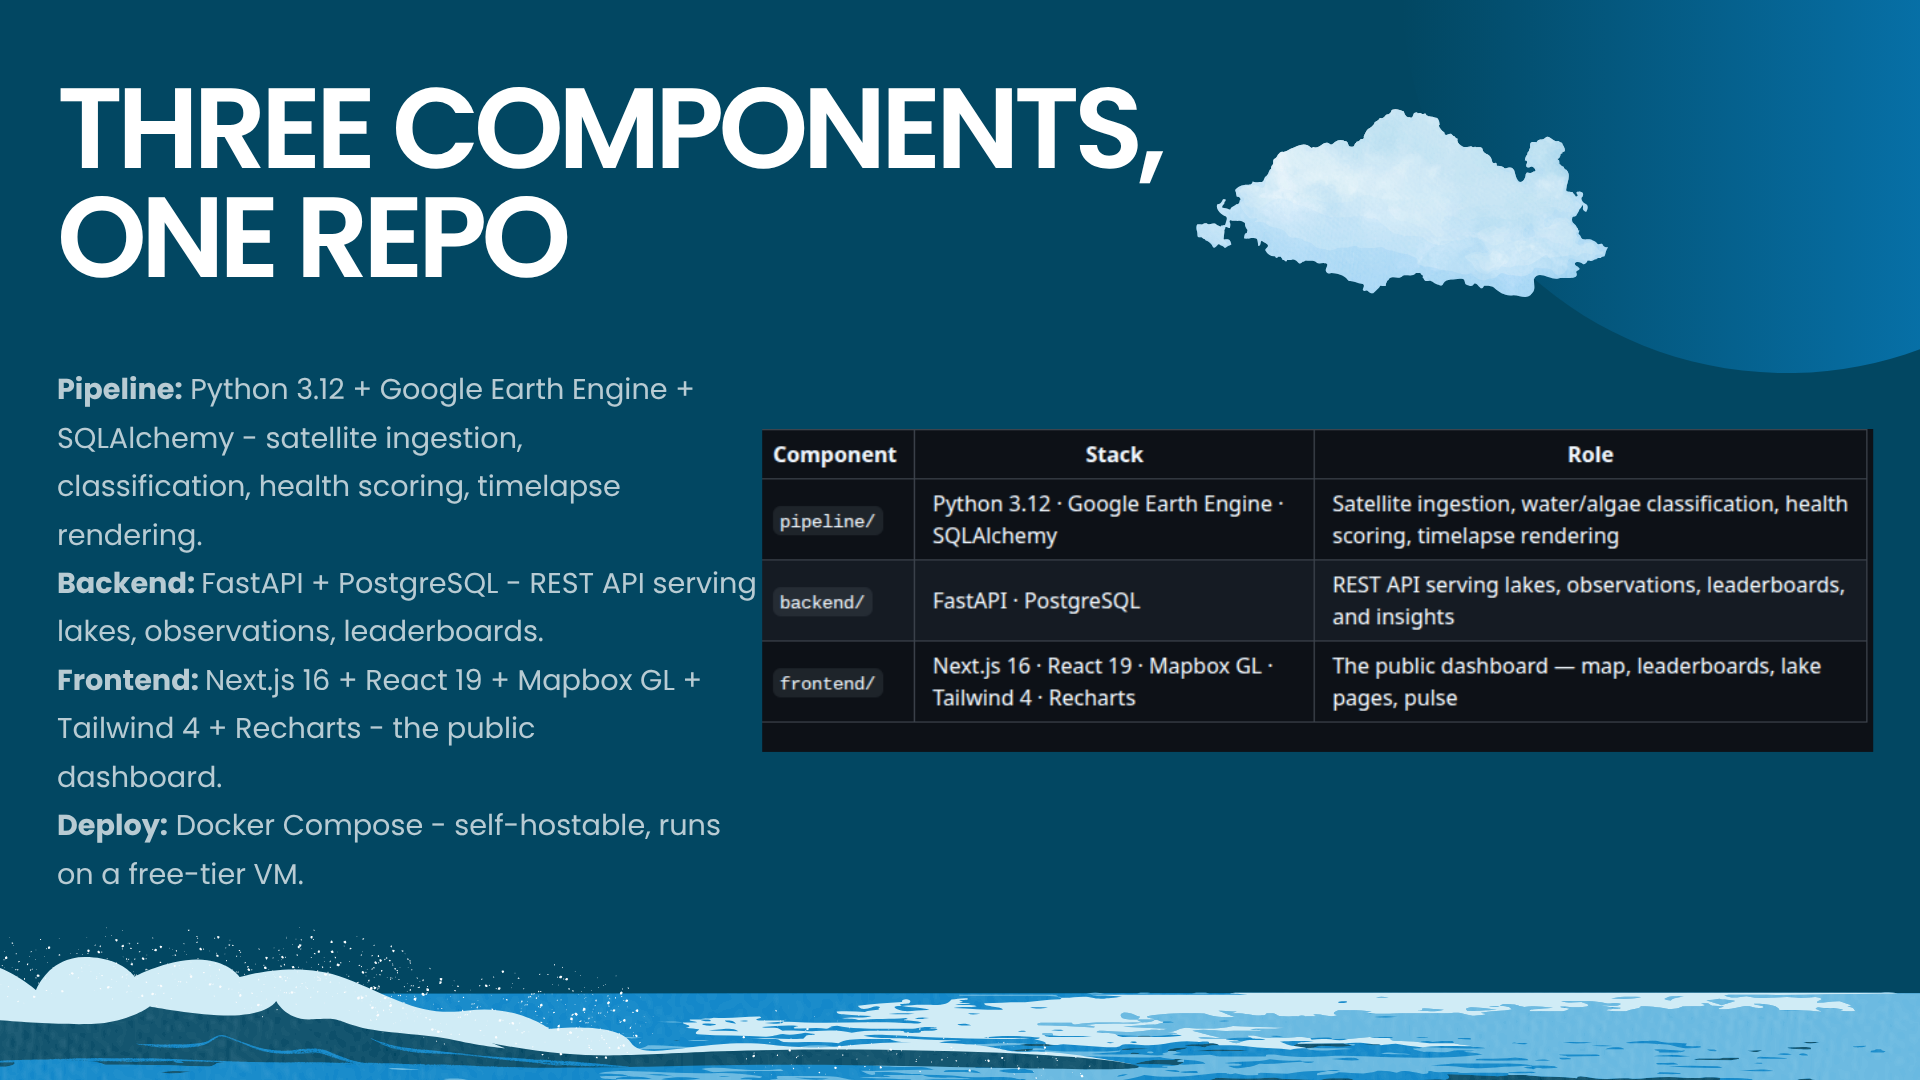
Three independently deployable components, one city-agnostic config:
| Component | Stack | Role |
|---|---|---|
pipeline/ |
Python 3.12 · Google Earth Engine · SQLAlchemy | Ingest, classify, score, render timelapse |
backend/ |
FastAPI · PostgreSQL | REST: lakes, observations, leaderboards |
frontend/ |
Next.js 16 · React 19 · Mapbox GL · Tailwind 4 · Recharts | Public dashboard |
🔄 Self-updating forever — GitHub Actions cron re-ingests every 5 days; zero manual work.
🏙️ Any city, one config — drop in city.config.json + a lake-boundary GeoJSON.
🏔️ The Climb
- ☁️ Monsoon clouds — judge cloudiness over each lake polygon, not the tile
- 📐 Adaptive Otsu thresholding — per-scene NDWI cutoff, not a planet-wide guess
- 💾 Petabyte-scale, zero downloads — server-side GEE compute; only numbers return
- 🎨 A scale everyone can read — colorblind-safe by design
- 💬 Numbers that feel — football fields, not hectares
📖 What We Learned
We came in knowing web development; we left knowing remote sensing. NDWI/NDVI, Otsu thresholding, Sentinel-2 band math, GEE's server-side model, seasonal time-series, timelapse rendering — and the truth that good environmental tech is 20% science, 80% communication.
🔭 After the Horizon
- 🌧️ Rainfall correlation — drought vs. encroachment
- 🚨 Early-warning alerts on sharp score drops
- 🌐 Multi-city federation
- 🧪 Ground-truth integration with lab and field data
- 🛰️ Sentinel-1 SAR through monsoon clouds
🎞️ The Record, on Screen
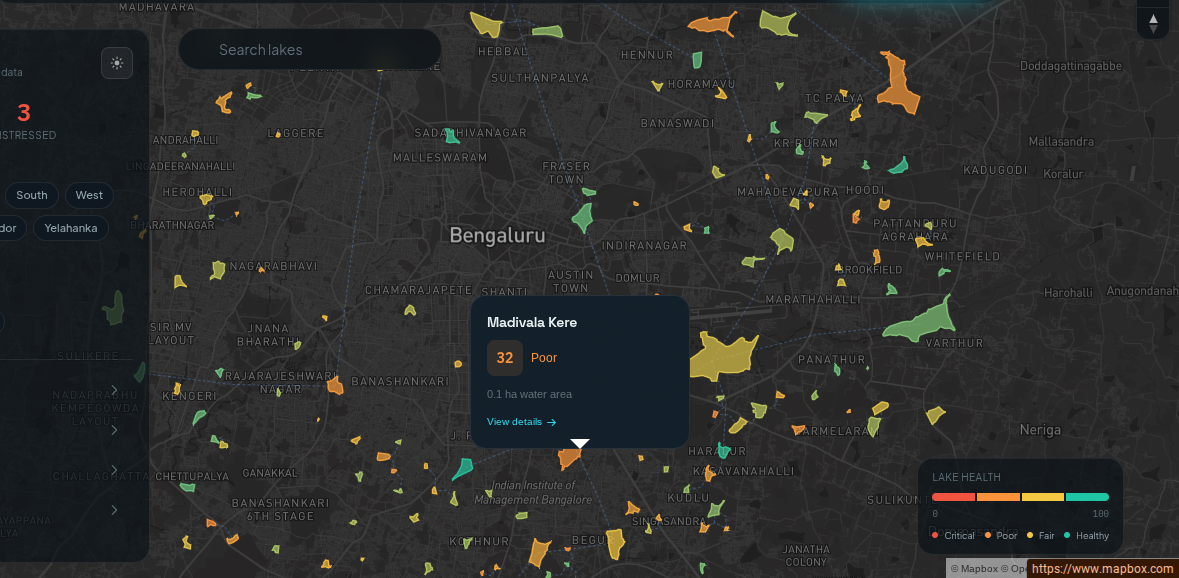 The city at a glance — every lake as a polygon colored by its health score.
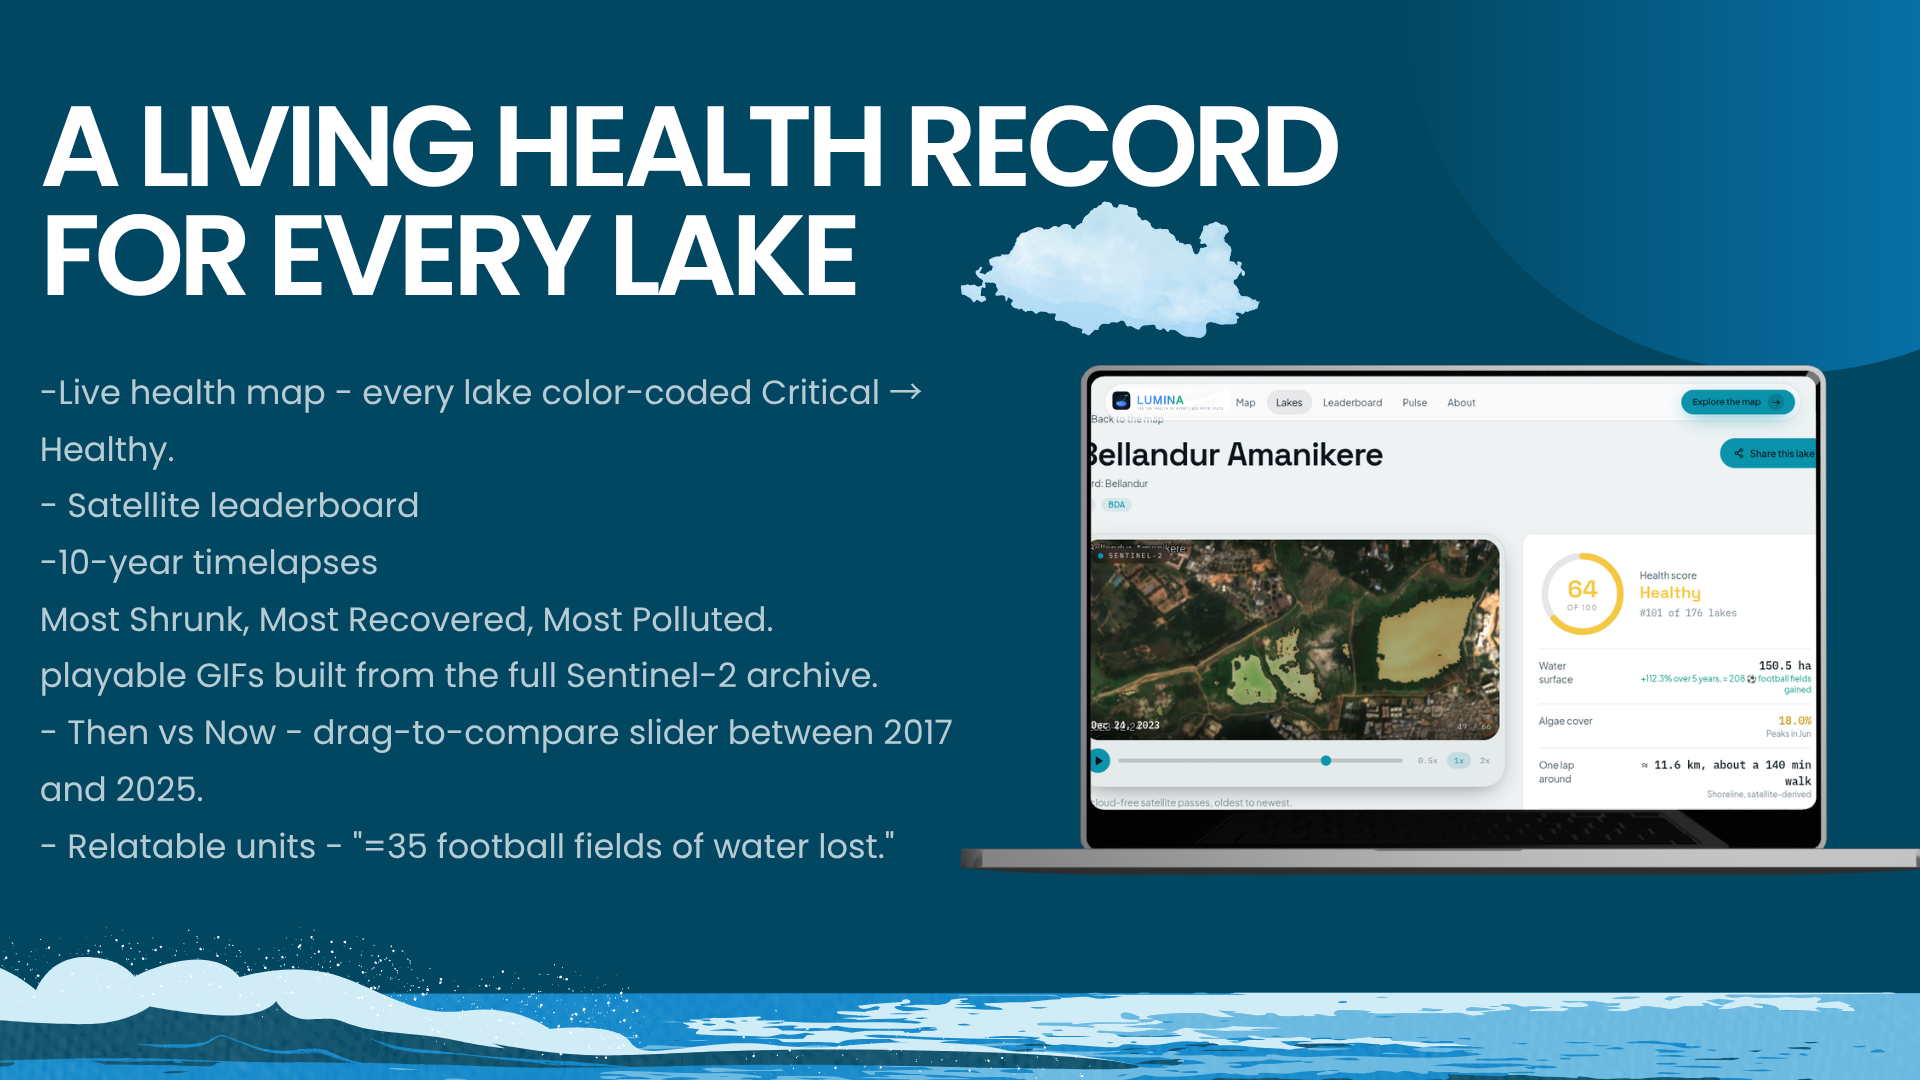
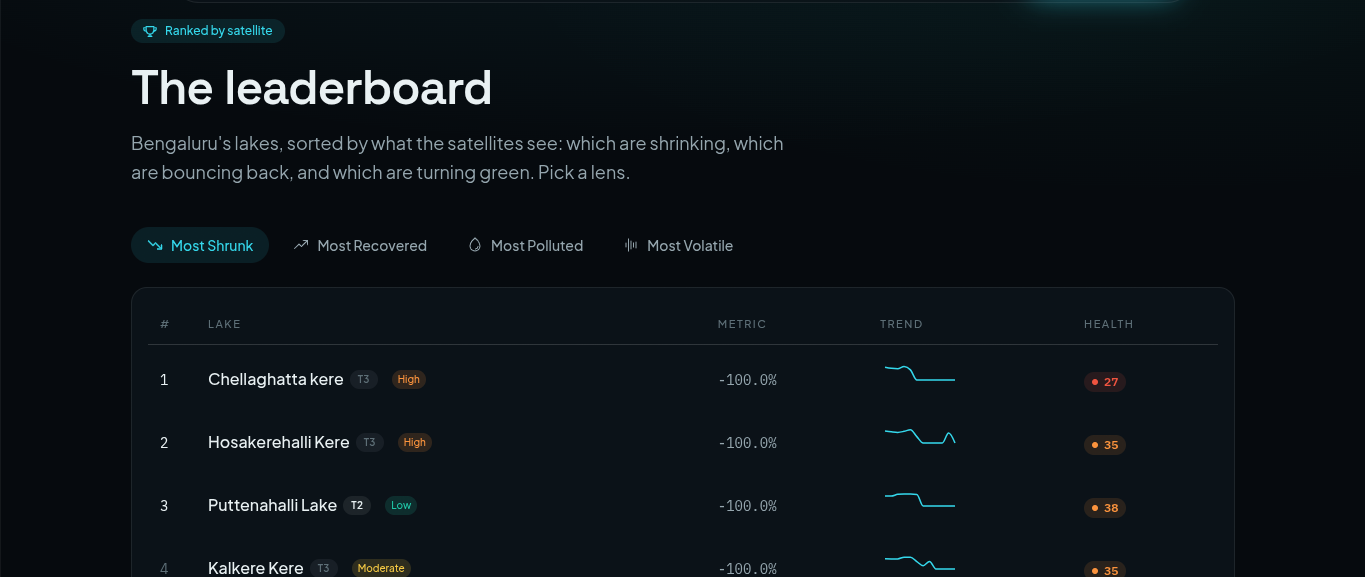 The leaderboard — Most Shrunk, Most Recovered, Most Polluted, Most Volatile.
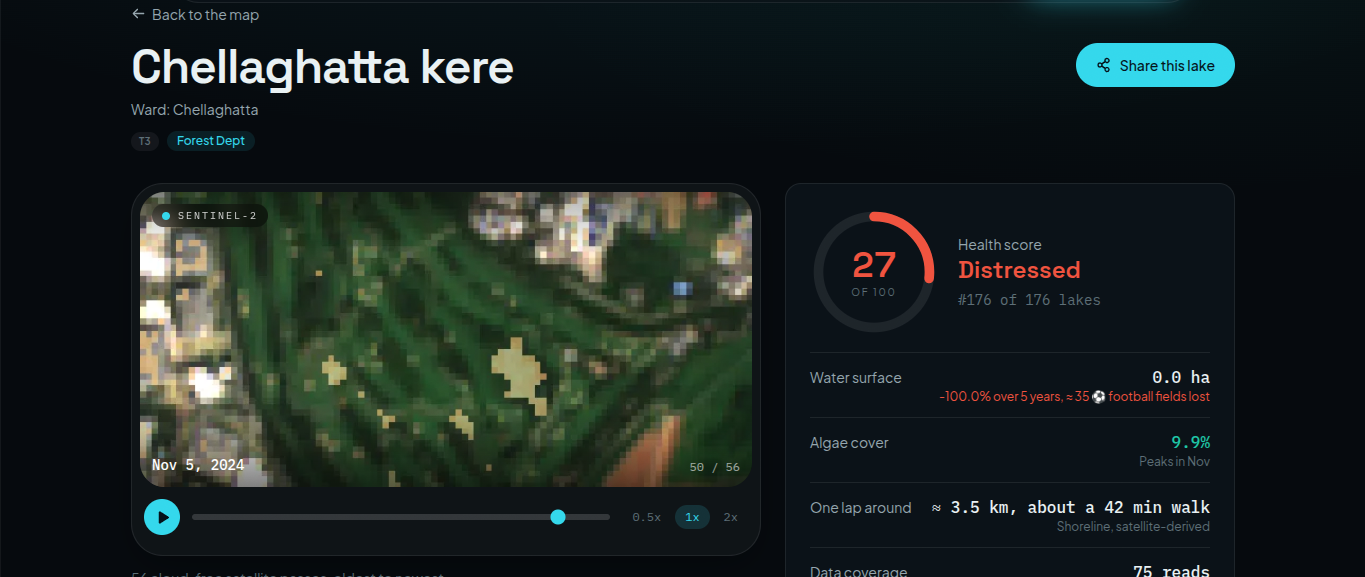 Every lake's dashboard — playable 10-year timelapse and relatable shoreline stats.
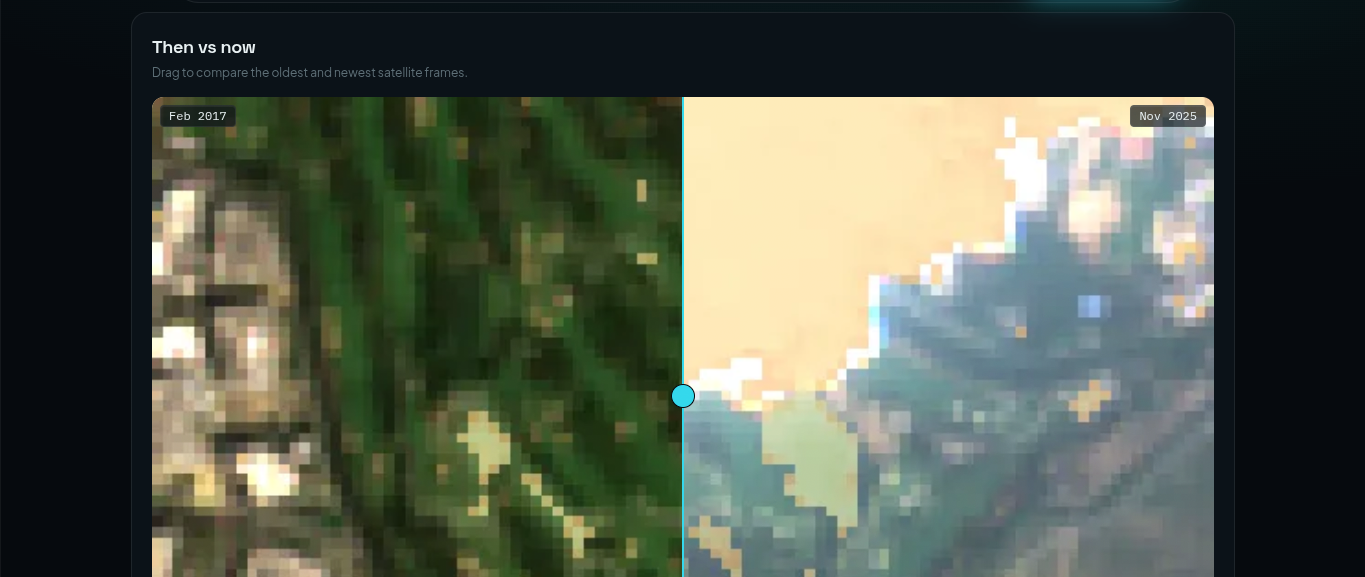 Then vs now — drag the slider. The change is undeniable.
🥇 The Case for Lumina
- Originality: Orbital Earth observation as a civic product: backfilled decade, explained trends, then-vs-now, per-lake timelapses
- Earth Forward: Ecosystem monitoring + conservation + community resilience, implemented fully
- Completion: Live dashboard, real lakes, real data, leaderboards, charts, timelapses, compare slider, self-updating cron
- Learning: Web dev → remote sensing, spectral indices, adaptive thresholding, cloud geospatial compute
- Design: Calm dark map-first UI, colorblind-safe scale, relatable units, social-ready cards
- Technology: GEE server-side pixel math + Otsu + NDWI/NDVI + volatility scoring + 5-day ingestion + GIF/MP4 timelapse + FastAPI + Next.js
📜 The Stewardship
Contains modified Copernicus Sentinel-2 data, processed via Google Earth Engine. © European Space Agency (ESA).
All figures are satellite-derived estimates at 10 m resolution — powerful for trends, intended for pairing with local field data.
🌊 Lumina — because every lake deserves to be seen.
Built With
- cloudflare
- earth
- engine
- fastapi
- gl
- mapbox
- ndvi
- ndwi
- next.js
- otsu
- postgresql
- python
- query
- r2
- react
- recharts
- sentinel-2
- sqlalchemy
- tailwind
- tanstack
- thresholding
- typescript
- zustand


Log in or sign up for Devpost to join the conversation.