-
-
Logo
-

-
-
-


Lumifer
OFFICIAL ADVERTISEMENT: https://youtu.be/1qHMOHjEvg0
Inspiration
A soil test costs $25 and takes 2 weeks.
A drone survey costs $2,000 per flight.
A smartphone costs $0 extra -- the farmer already owns one.
Precision agriculture today forces a brutal tradeoff: expensive hardware (hyperspectral cameras, drones) or slow, spatially-blind lab testing. Meanwhile, invisible nutrient deficiencies are silently destroying yields across 570 million smallholder farms worldwide. By the time a deficiency is visible to the naked eye, 20-40% of yield damage is already locked in.
We kept hearing the same story from growers and agronomists: they needed to know where stress was happening, what nutrient was responsible, and why it started. No single tool answered all three. So we built one.
| Tool | Where? | What? | Why? | Cost | Speed |
|---|---|---|---|---|---|
| Lab test | - | Yes | - | $25/sample | 2 weeks |
| Drone/hyperspectral | Yes | - | - | $2,000+/flight | Hours |
| Lumifer | Yes | Yes | Yes | Free | < 5 sec |
What it does
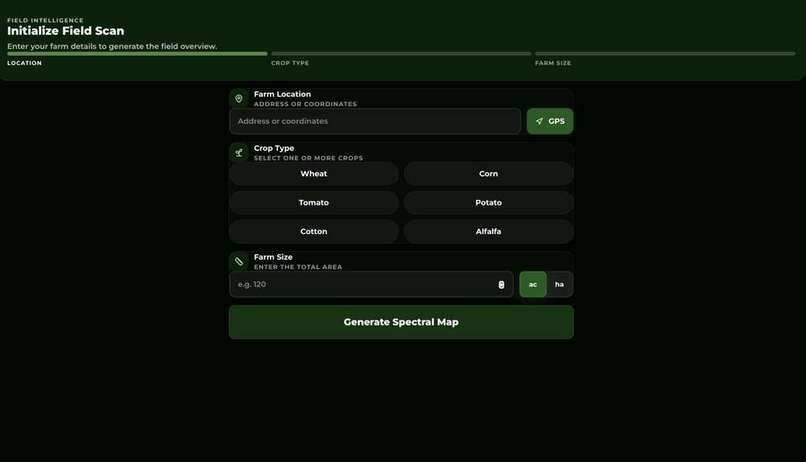
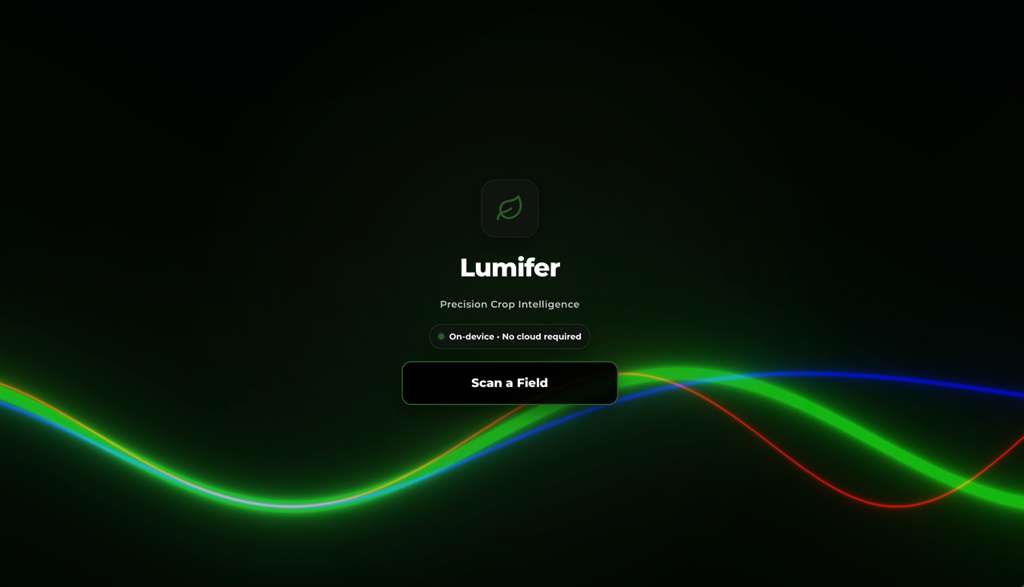
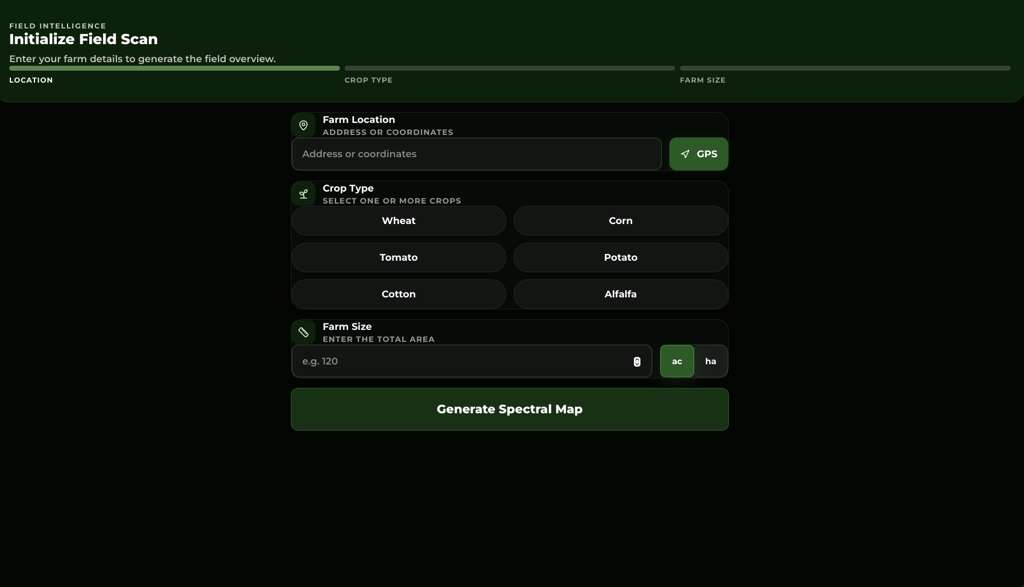
Lumifer is a mobile-first PWA that turns any smartphone into a crop nutrient diagnostic lab. Three stages, one workflow:
SATELLITE              PHONE                CLIMATE
─────────────          ─────────────        ─────────────
Sentinel-2 NDVI        Leaf photo AI        NASA POWER API
10m resolution         < 300ms on-device    90-day history

     |                      |                    |
     v                      v                    v
 +--------+           +----------+         +----------+
 | WHERE  |---------> |  WHAT    |-------> |   WHY    |
 | is the |           | is wrong?|         | did this |
 | problem|           | N? P? K? |         | happen?  |
 +--------+           +----------+         +----------+
                            |
                            v
                   +-----------------+
                   |   ACTION PLAN   |
                   | "Apply 120-150  |
                   |  kg N/ha urea   |
                   |  in Zone A3     |
                   |  within 3 days" |
                   +-----------------+
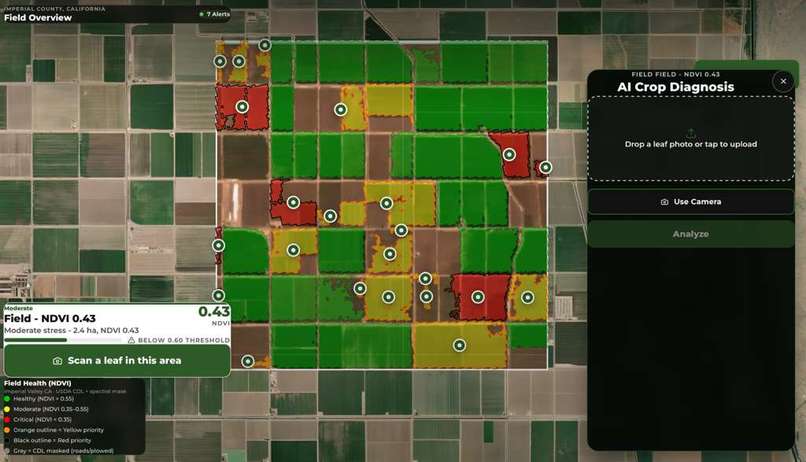
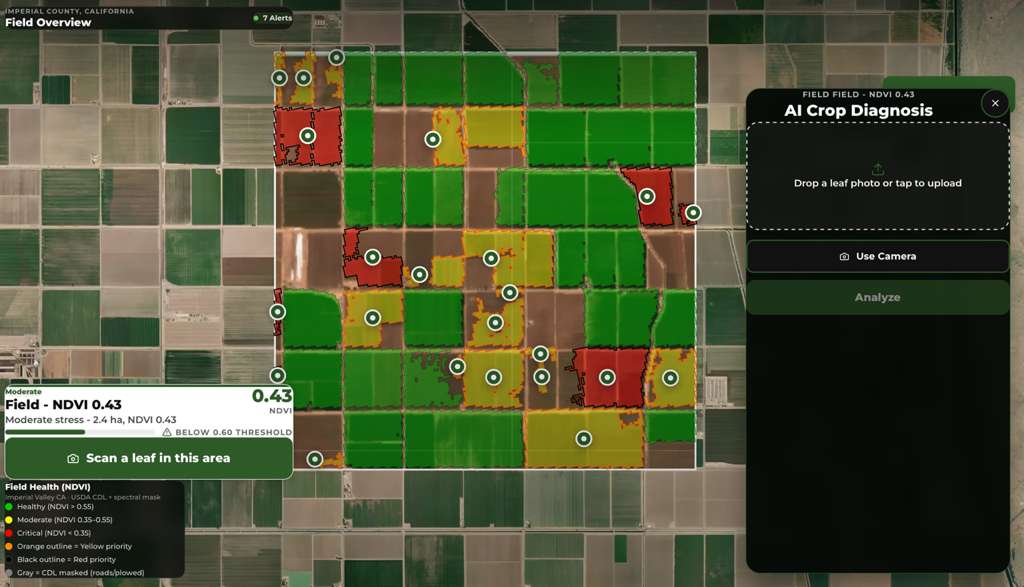
Stage 1 -- Satellite Triage: Sentinel-2 NDVI maps at 10-meter resolution scan the entire field and flag stressed zones (NDVI below 0.60). Instead of guessing where to sample, the farmer walks straight to the problem.
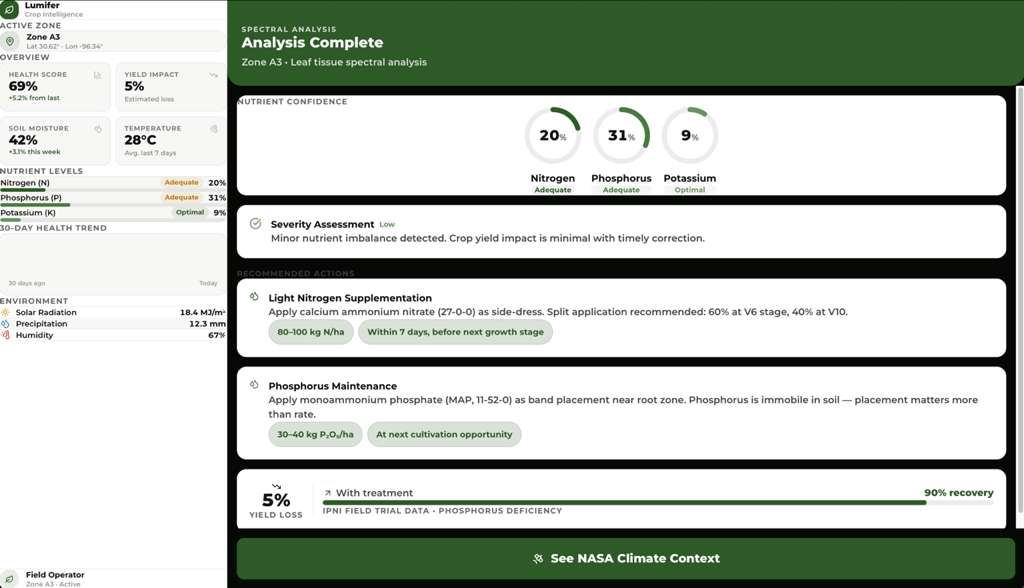
Stage 2 -- Leaf Diagnosis: The farmer photographs a single leaf. On-device AI runs a full analysis pipeline in under 300ms: segmentation, physics-based spectral indices, per-pixel symptom fractions, and deep learning classification. The two signal paths fuse to produce NPK confidence scores, severity, fertilizer recommendations with specific products and rates, and yield impact estimates.
Stage 3 -- Climate Context: The app pulls 90 days of satellite climate data from NASA POWER for the exact GPS coordinates and explains why the deficiency is happening. Not just "nitrogen deficient" but "6 heat events above 34C this season likely denatured nitrate reductase, reducing N assimilation by 30-60%."
100% on-device. No cloud uploads. Works offline. Privacy by design.
How we built it
Tech Stack
| Layer | Choice | Why |
|---|---|---|
| Framework | React 19 + Vite 8 | Concurrent rendering handles heavy TF.js loads without jank |
| Styling | TailwindCSS v4 | @theme CSS variables co-located with component logic |
| Animation | Framer Motion | Spring physics (stiffness:260/damping:20) = iOS-native feel |
| ML Runtime | TensorFlow.js + WebGL | Only mature browser ML framework with SavedModel import |
| Computer Vision | OpenCV.js (CDN, ~8MB) | Async load keeps initial bundle < 500KB |
| Model | MobileNetV2 (float16) | ~5MB, < 300ms inference on mid-range phones |
| Satellite | Sentinel-2 Band 4 + 8 | Free, 10m resolution, global coverage |
| Climate | NASA POWER API | Free, no auth, CORS-enabled, satellite-observed |
| Offline | Workbox + vite-plugin-pwa | Pre-caches model shards + all assets |
Leaf Analysis Pipeline
Capture (1280x720)
 |
 v
SEGMENT --- OpenCV.js
 |  Multi-range HSV mask:
 |    Green  (H:25-95)  -> healthy tissue
 |    Yellow (H:15-35)  -> chlorosis (N)
 |    Brown  (H:5-30)   -> necrosis (K)
 |  + Laplacian focus filter
 |
 +------------------------------+
 v                              v
PHYSICS ENGINE               DEEP LEARNING
 Per-pixel indices:            MobileNetV2
 - ExG, NGRDI, VARI            1,656 training images
 - Symptom fractions:          Rice NPK Deficiency
   purpleFrac -> P             dataset (verified labels)
   brownFrac  -> K             4-class softmax
   yellowFrac -> N             [healthy, N, P, K]
 |                              |
 +-------------+----------------+
               v
         FUSION (50/50)
         Both agree deficient -> boost
         Both agree healthy   -> suppress
         Disagreement         -> weighted avg
               |
               v
         Results + Heatmap
A critical design choice: our segmentation mask captures green, yellow, and brown tissue. A green-only mask would classify all diagnostic tissue -- the exact pixels that indicate deficiency -- as background. The multi-range approach is what makes deficiency detection possible from a phone camera.
The fusion engine combines physics-based spectral indices with MobileNetV2 output at a 50/50 weight. This compensates for the model's moderate standalone accuracy (66.7% on a small dataset) while grounding predictions in interpretable, citable agronomic signals. If the model fails to load, the physics engine runs standalone with no user-facing degradation.
The Insight That Changed Everything
A leaf that is 80% healthy green with 20% brown margin scorch has a perfectly normal mean color.
Mean-color analysis says "healthy." Per-pixel symptom fractions say "20% brownFrac = potassium deficiency." Switching from averages to per-pixel fractions was our single biggest accuracy jump. This is the difference between "your field looks fine" and "Zone A3 has early-stage K deficiency -- apply sulfate of potash within 5 days."
Challenges we ran into
| Challenge | What went wrong | How we fixed it |
|---|---|---|
| Green-only mask | Classified yellow/brown diagnostic tissue as background | Multi-range HSV with 3 overlapping hue windows |
| Mean-color blindness | Localized scorch averaged out to "healthy" | Per-pixel symptom fraction analysis |
| Model too large | ResNet-50: 23MB, 1.8s on mid-range phone | MobileNetV2 + float16 quantization: 5MB, 300ms |
| Ungrounded outputs | Early recs had no scientific backing | Every threshold traces to published literature |
The hardest challenge was not any single technical problem but the discipline of grounding every output. Every threshold, every fertilizer rate, every yield-loss percentage traces back to published literature: Mills & Jones (1996) for tissue sufficiency ranges, USDA NRCS Practice Standard 590 for application rates, IPNI field trial summaries for yield impact, and Texas A&M Extension bulletins for product selection. This took more time than the code. We refused to ship a single recommendation we could not cite.
Accomplishments that we're proud of
$500 phone approximating a $50,000 camera. RGB-to-spectral reconstruction using published correlation coefficients (Datt 1998, Gitelson & Merzlyak 1996) estimates NIR and red-edge bands from a standard phone camera at R-squared 0.71-0.82. Combined with the trained model, this makes diagnostically useful nutrient assessment possible without specialized hardware.
Zero-cloud architecture. Every computation -- segmentation, TF.js inference, heatmap rendering -- stays on-device. No images leave the phone. No internet required after first load. This is not just a privacy feature; it is a deployment requirement for farmers in regions with limited connectivity.
Graceful degradation at every layer. No WebGL? Physics engine runs standalone. Satellite API down? Leaf diagnosis still works. Model cache miss? The index engine encodes the same spectral information the model was trained on.
The "why" nobody else gives. Not just "phosphorus deficient" but: "18 consecutive dry days collapsed the soil water film P diffuses through, reducing uptake 40-70% (Lambers et al., 2006)." Connecting NASA POWER climate records to published nutrient-uptake physiology closes the loop from symptom to cause to action.
What we learned
+-------------------------------------------------------+
|  "ExG < 0.15 + NGRDI < 0 = nitrogen deficiency.       |
|   No hyperspectral sensor required."                   |
|                                                        |
|   RGB cameras are more powerful than people think      |
|   when you compute the right indices.                  |
+-------------------------------------------------------+
Per-pixel > per-leaf. Symptom fractions catch localized damage -- marginal scorch, interveinal chlorosis -- that averages completely hide. This was the single most impactful change in our pipeline.
5MB at 250ms beats 90% accuracy at 3 seconds. A model that runs instantly on a $200 phone is more useful than one that is marginally more accurate but needs a flagship device. Deployment constraints should drive architecture choices, not benchmark leaderboards.
Farmers don't want scores. They want sentences. "P confidence: 0.72" means nothing. "Apply 50-70 kg P2O5/ha of triple superphosphate banded 5cm deep within 5 days. The 18-day precipitation gap is the likely cause." That is actionable.
What's next for Lumifer
NOW                     NEXT                    FUTURE
--------------          --------------          --------------
[x] Rice NPK           [ ] Wheat, corn,        [ ] Micronutrient
[x] On-device ML            soybean                 detection
[x] NASA climate        [ ] Semi-supervised         (Fe, Mn, Zn, B)
[x] Offline PWA              learning from      [ ] Low-cost Android
                              field photos           edge deployment
                        [ ] Soil photo          [ ] 2G-first
                              integration            progressive load
The pipeline is crop-agnostic by design. Expanding to new crops requires new training data and crop-specific tissue sufficiency thresholds from published standards, but the segmentation, index computation, fusion, and climate correlation layers all transfer directly. Semi-supervised learning on real-world field photos (with user consent) is the fastest path to closing the gap between controlled-experiment training data and the messy, variable conditions of actual agriculture.
Built With
- framer-motion
- javascript
- keras
- localstorage-caching
- mobilenetv2-(transfer-learning)
- nasa-power-agroclimatology-api
- opencv.js
- plantvillage
- pwa
- python-(for-model-training)
- react-19
- rice-npk-deficiency-dataset
- sentinel-2-ndvi
- tailwindcss-v4
- tensorflow.js-(on-device)
- typescript
- vite
- vite-plugin-pwa
- workbox


Log in or sign up for Devpost to join the conversation.