-
-
Cleaned
-
Health
-
Answers
-
Question
-
Answer
-
Glance
-
Donations
-
Dashboard
-
Numbers
-
Spike
-
Inventory
-
Top
-
Forecast
-
Landing
-
Mobile
Inspiration
Small shops, NGOs and student clubs all collect data: sales sheets, donation logs, stock counts, expense trackers. Almost none of them turn it into decisions. Power BI and Tableau cost money and take training, and their AI features (like Power BI Copilot) sit behind paid licences. General chatbots can read a CSV, but they hand you a confident number with no way to check it.
We kept picturing one person: a club treasurer or shop owner with a spreadsheet they can't interpret and no analyst to ask. They don't know which questions to ask, and they can't tell a right answer from a plausible wrong one. So we built Lumen around one idea: your data already knows what to do next. It should tell you what matters before you ask, and show its work whenever it answers.
What it does
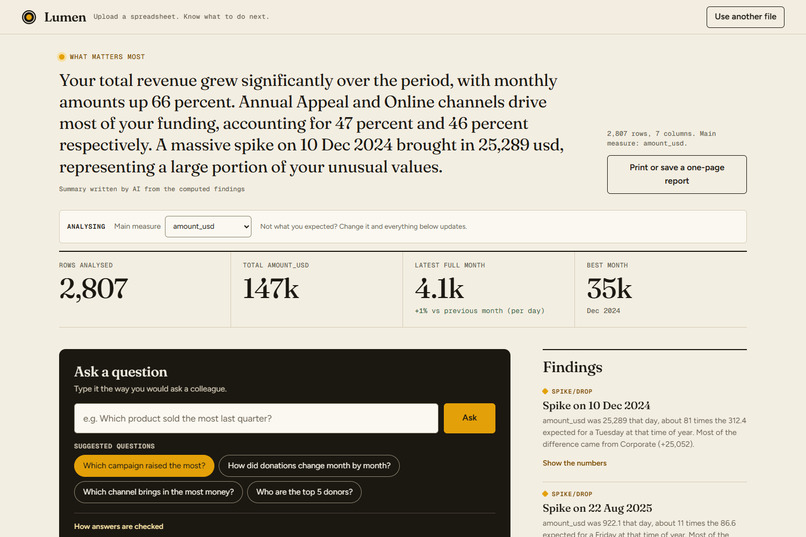
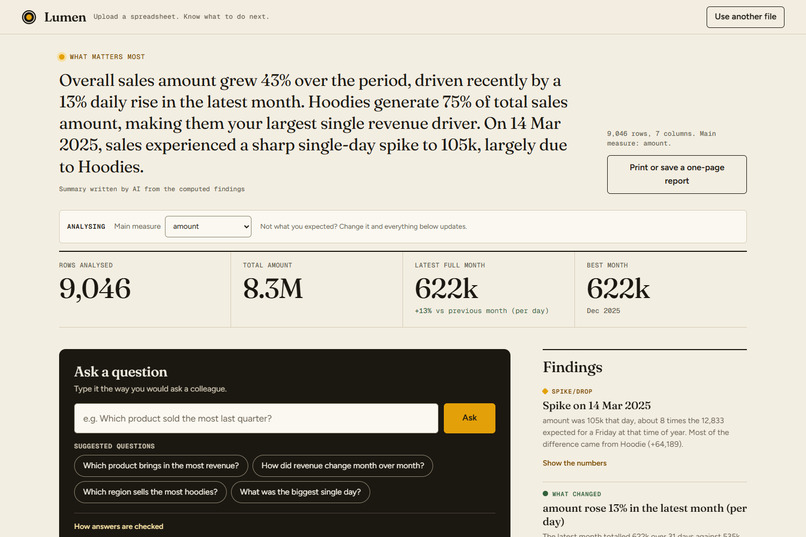
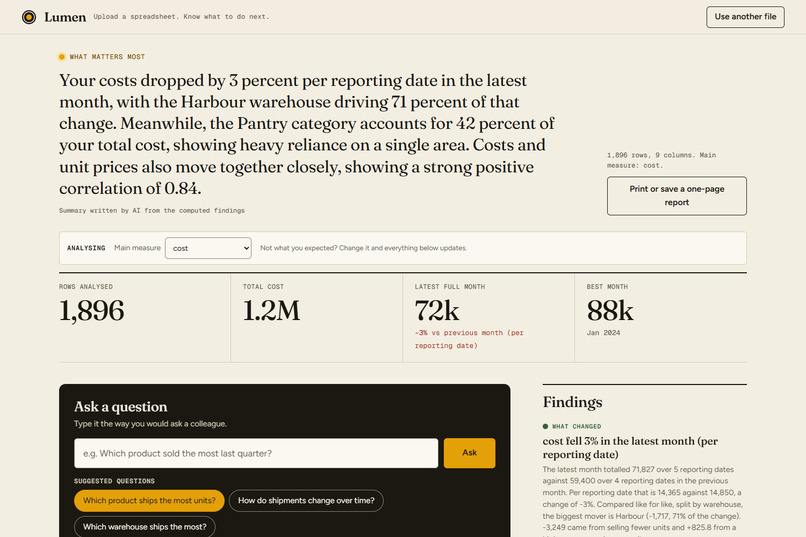
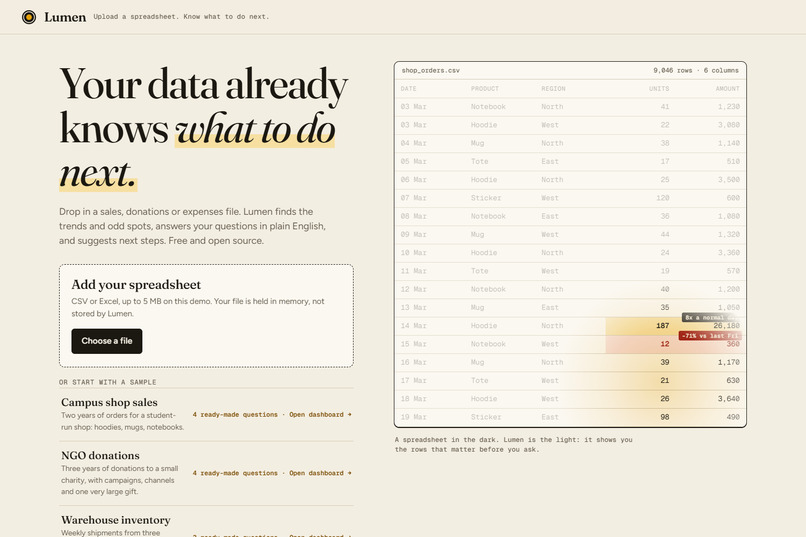
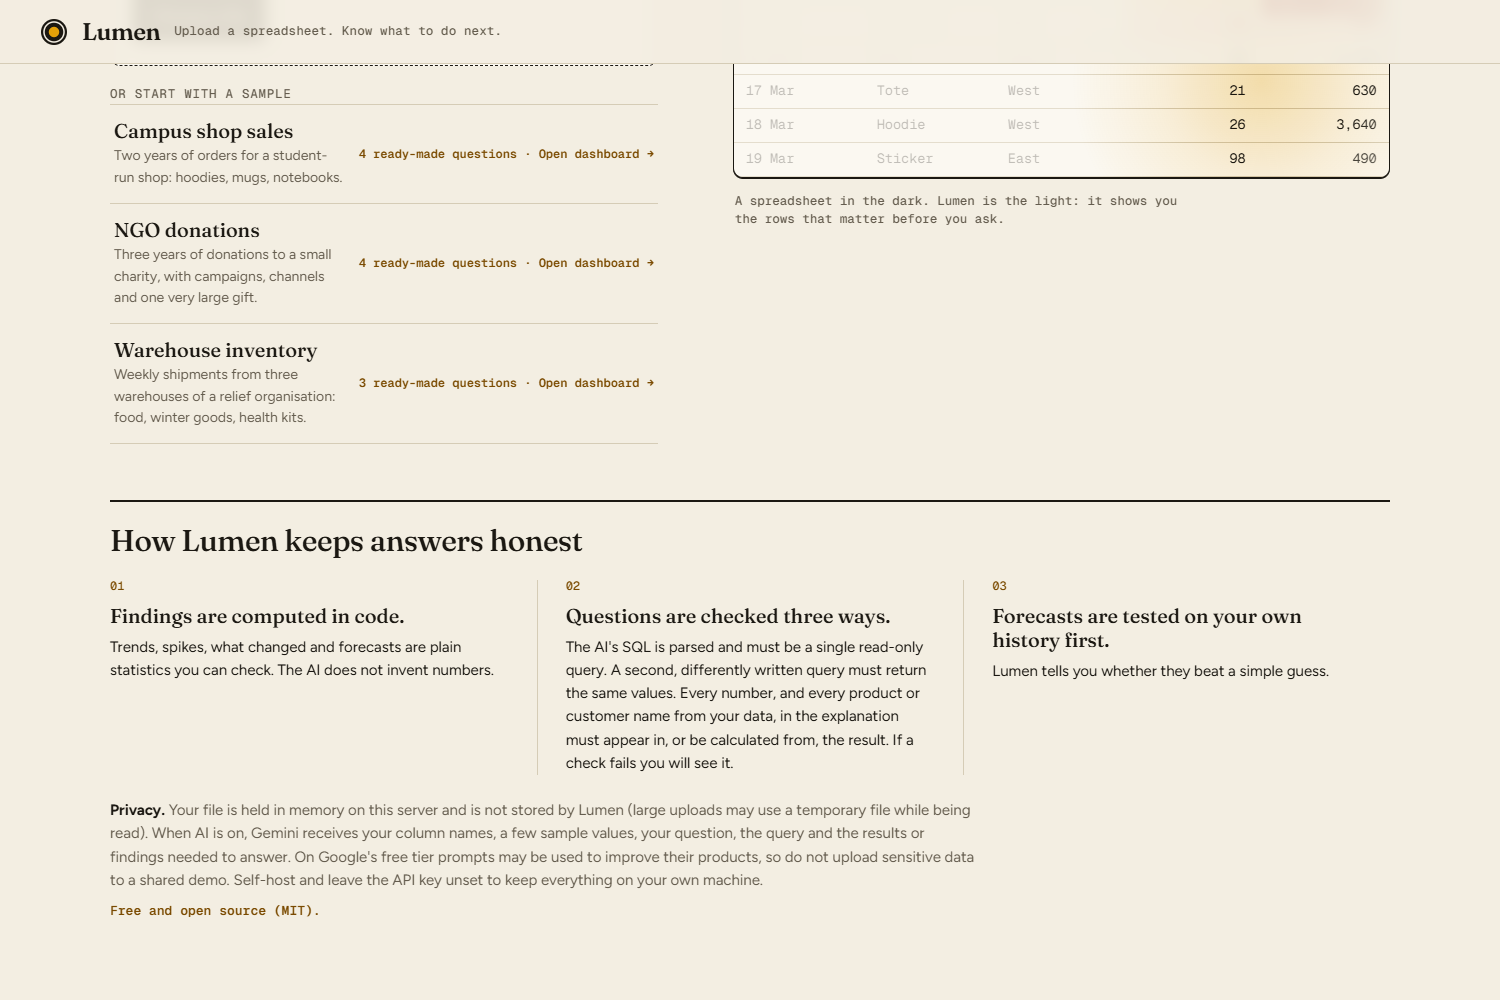
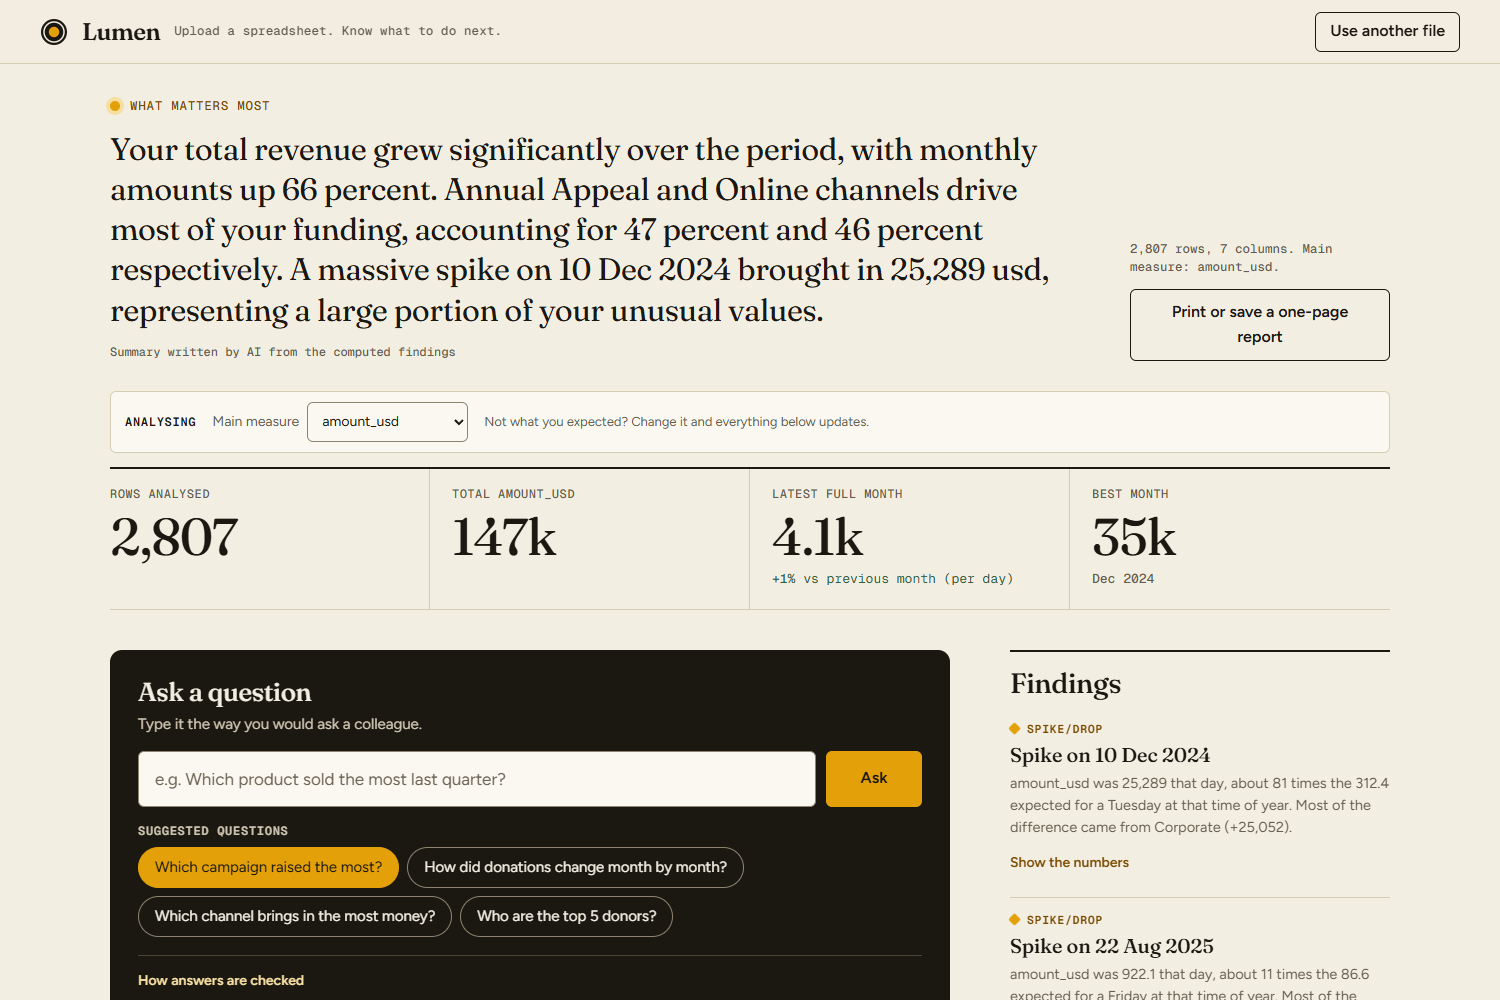
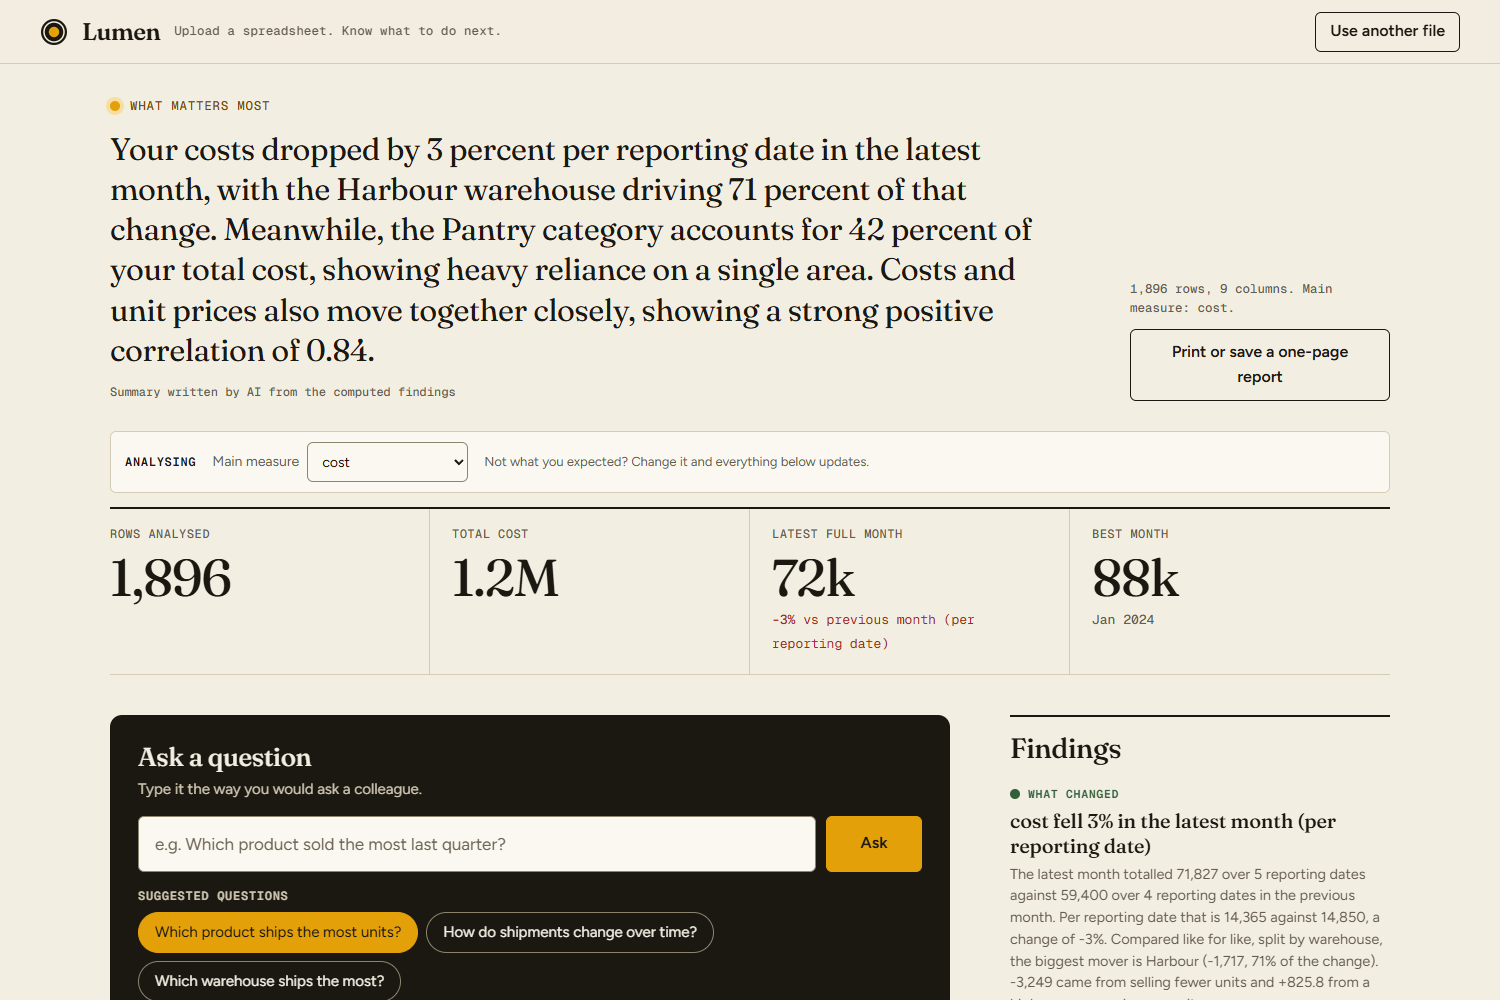
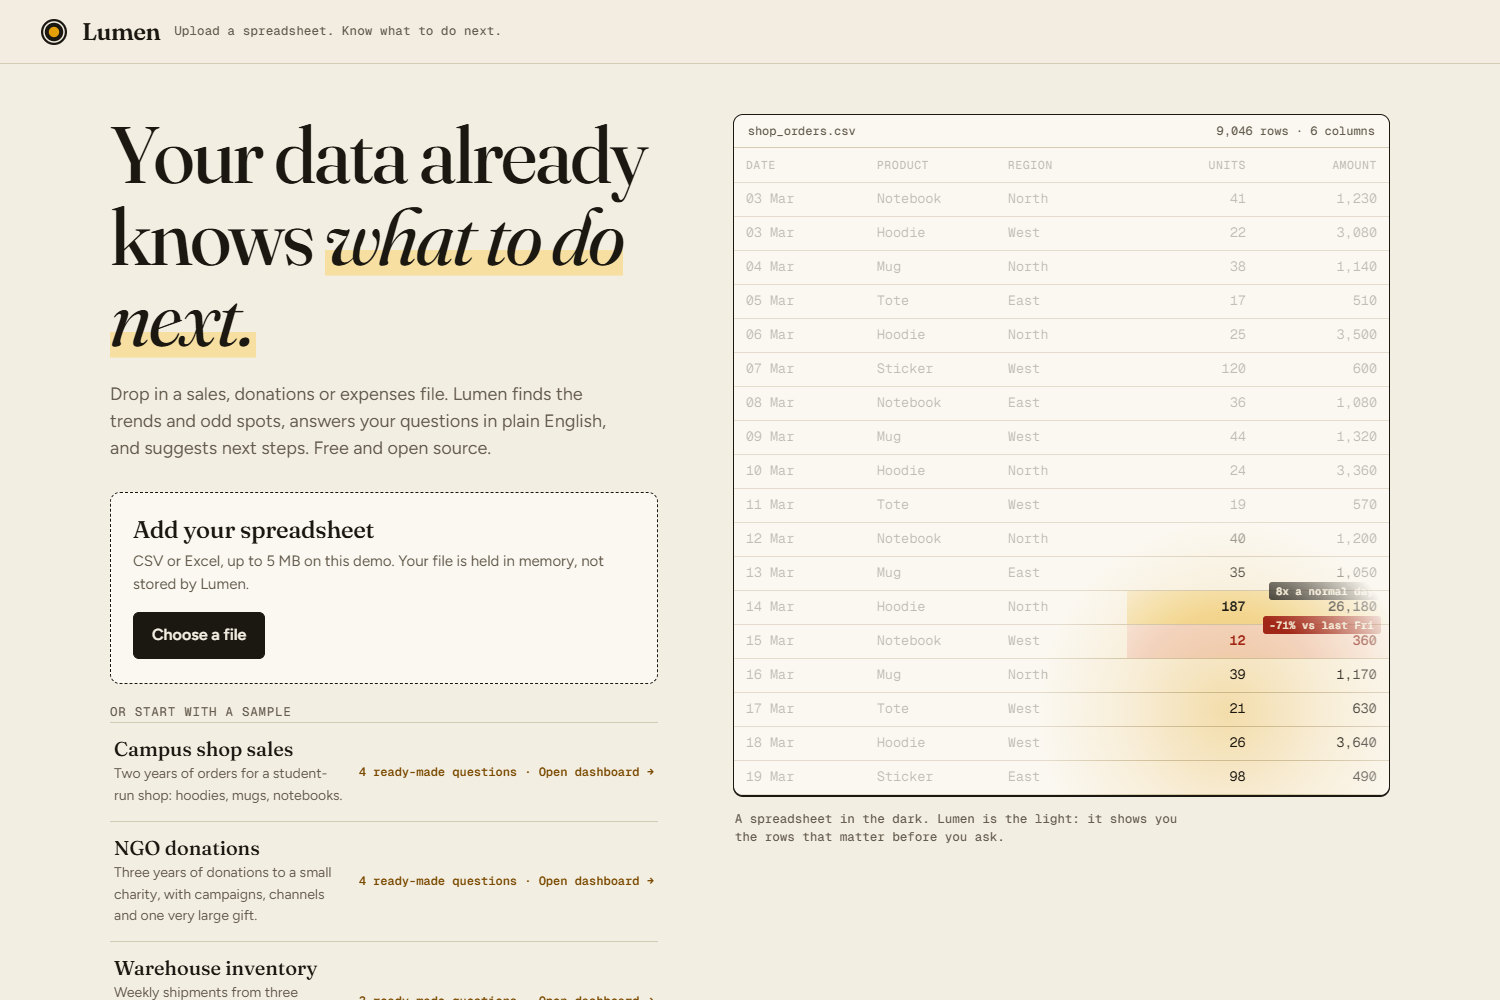
Drop in a CSV or Excel file (or pick one of three samples: a campus shop, an NGO's donations, a relief warehouse's inventory) and Lumen opens a dashboard:
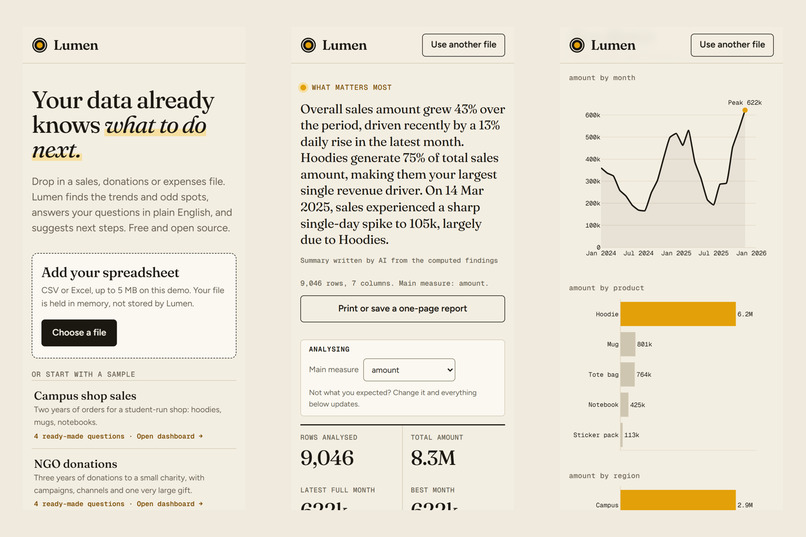
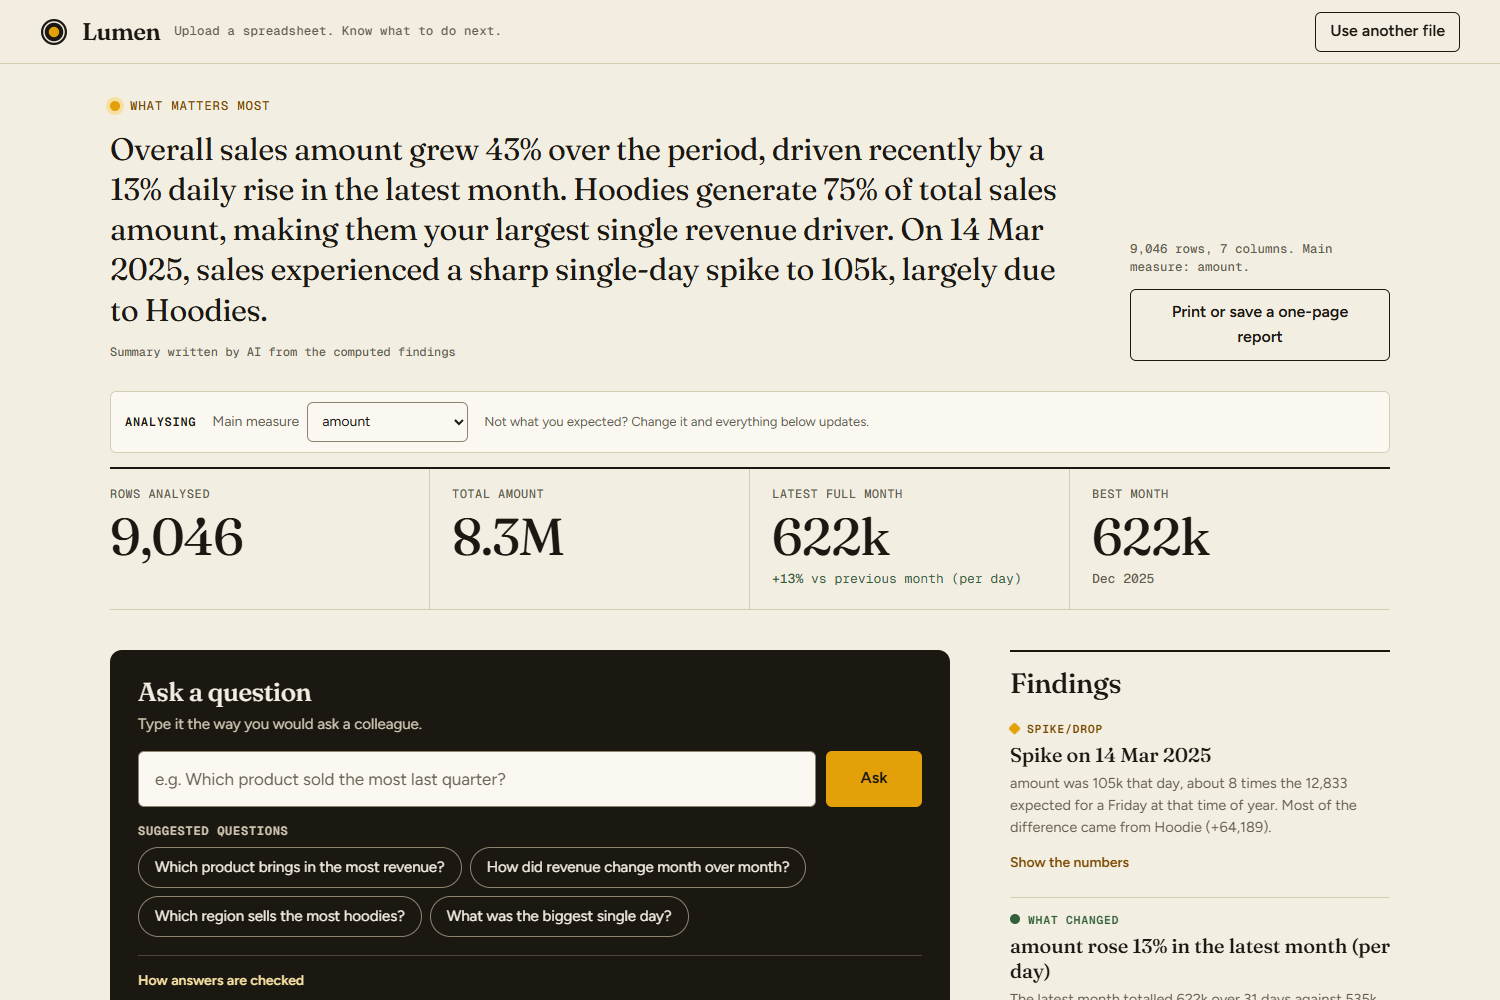
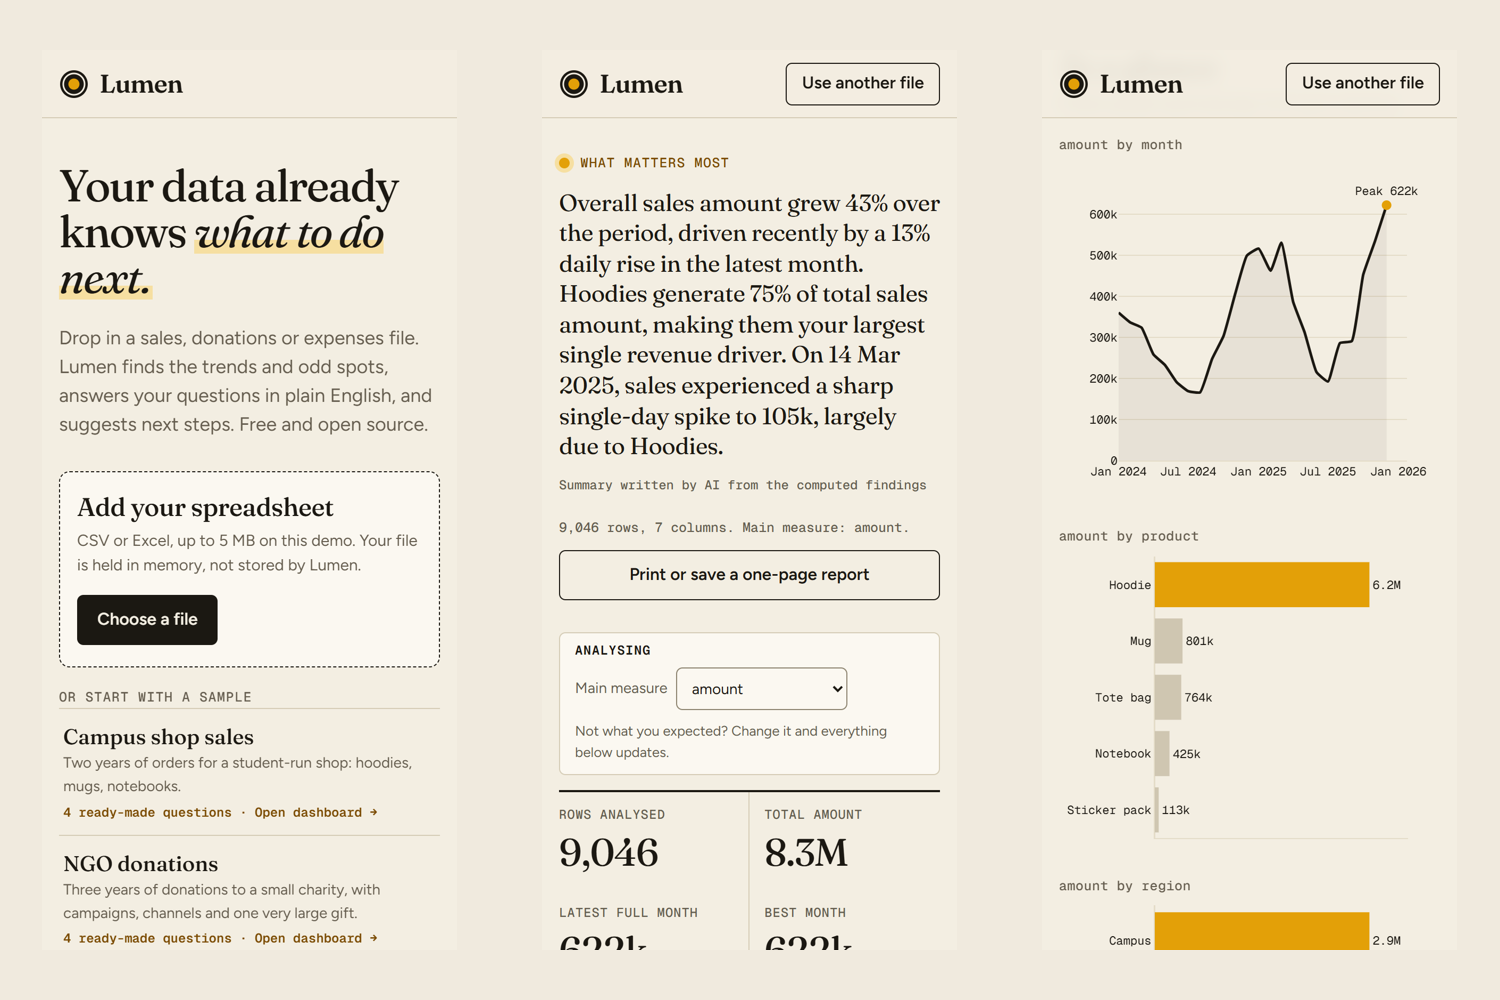
- What matters most: a short plain-language summary at the top. It's written by AI only if every number in it matches the computed findings; otherwise it's built in code.
- Analysing: Lumen picks the main measure and date column itself. If it guessed wrong, change it and the whole dashboard recomputes.
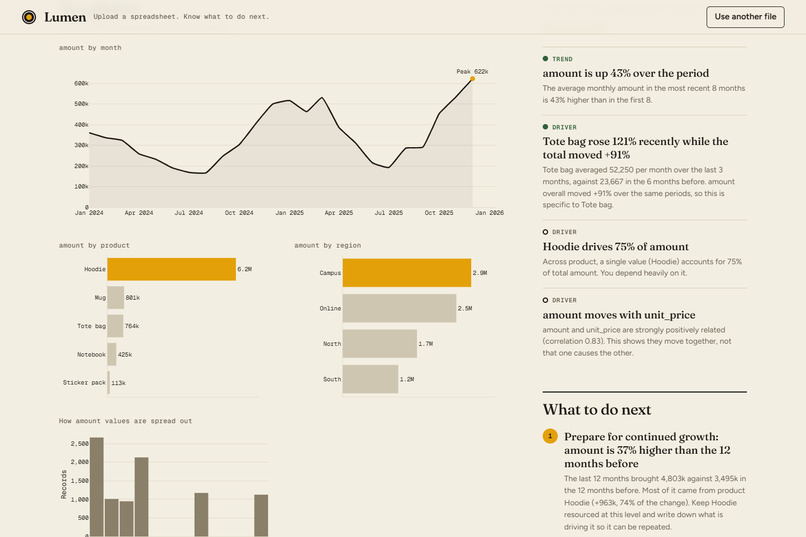
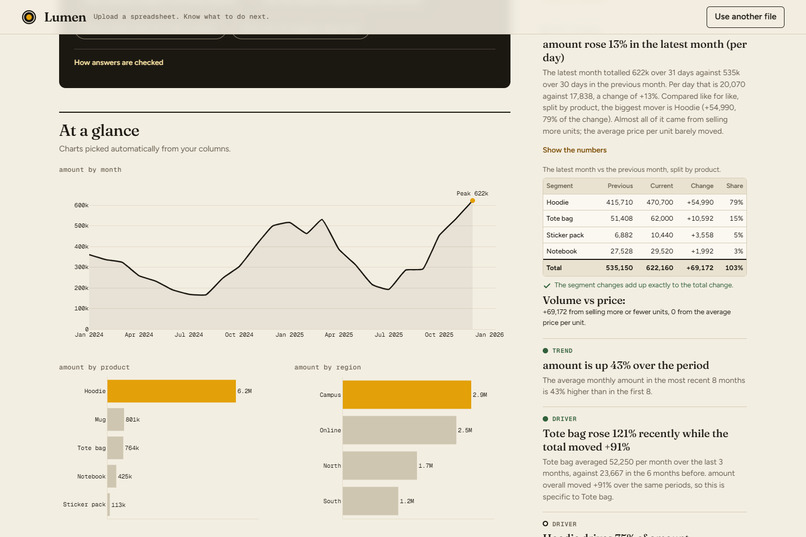
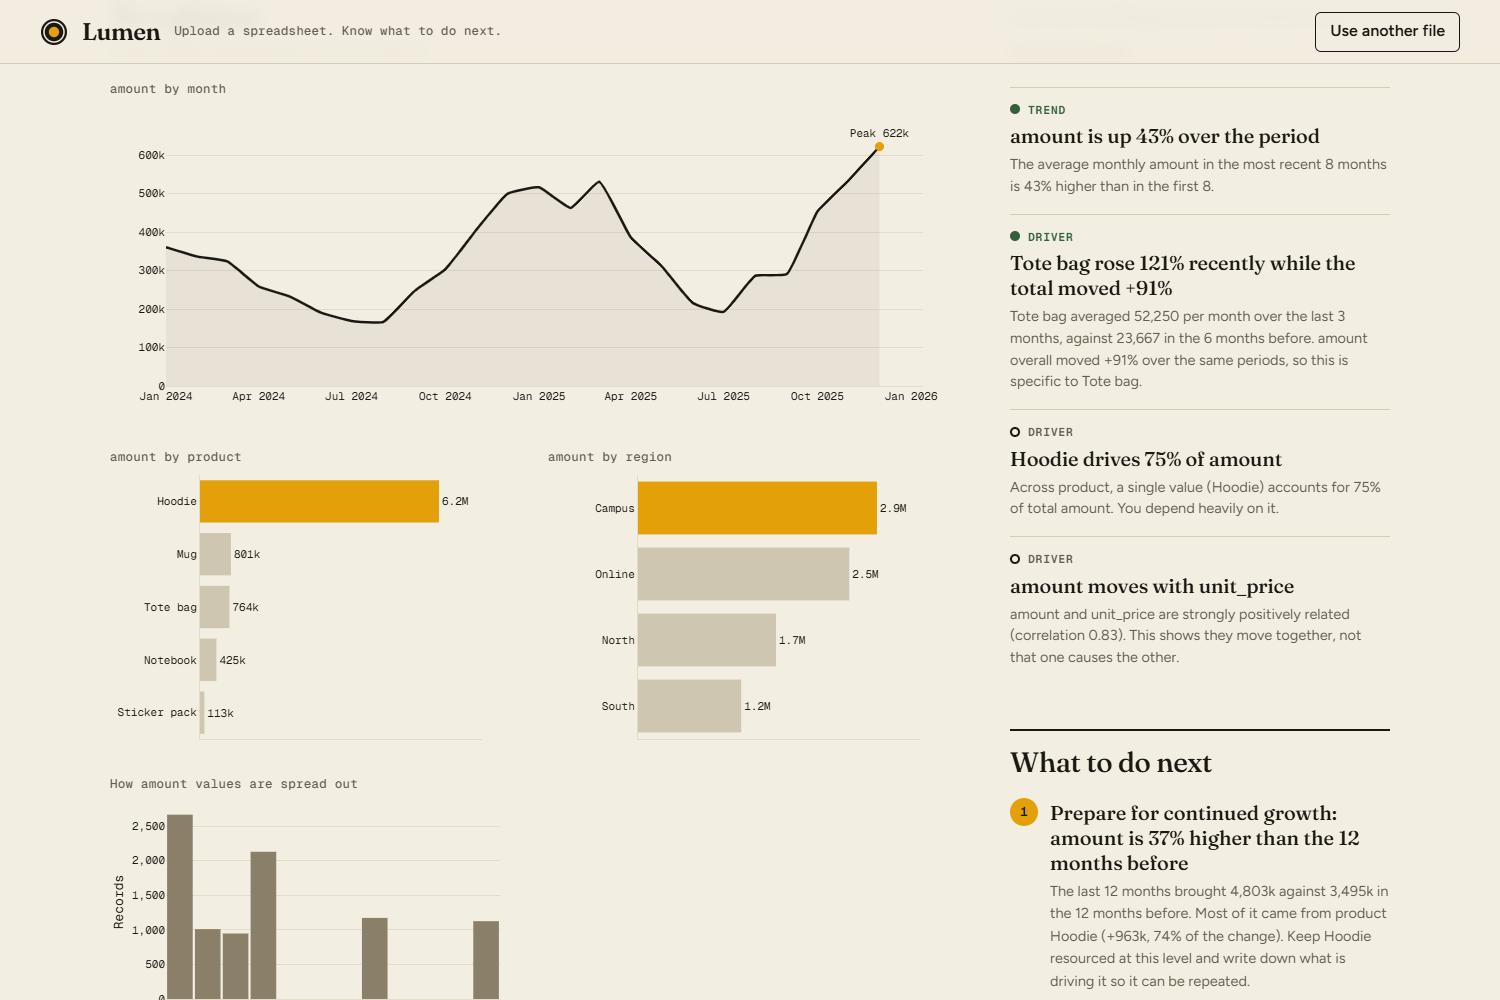
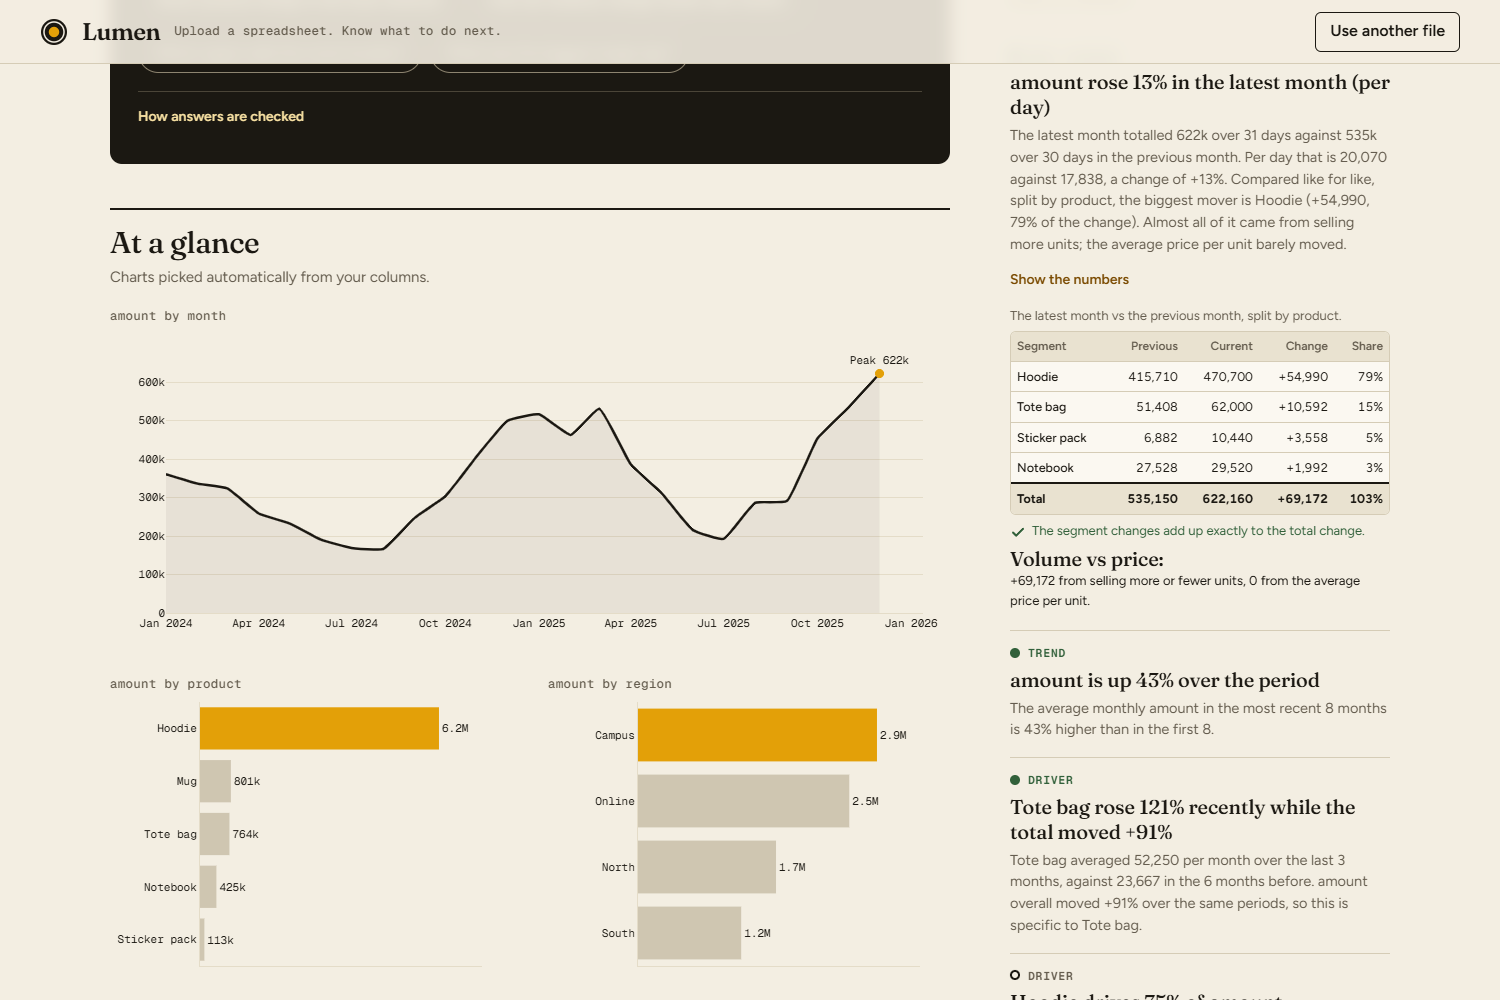
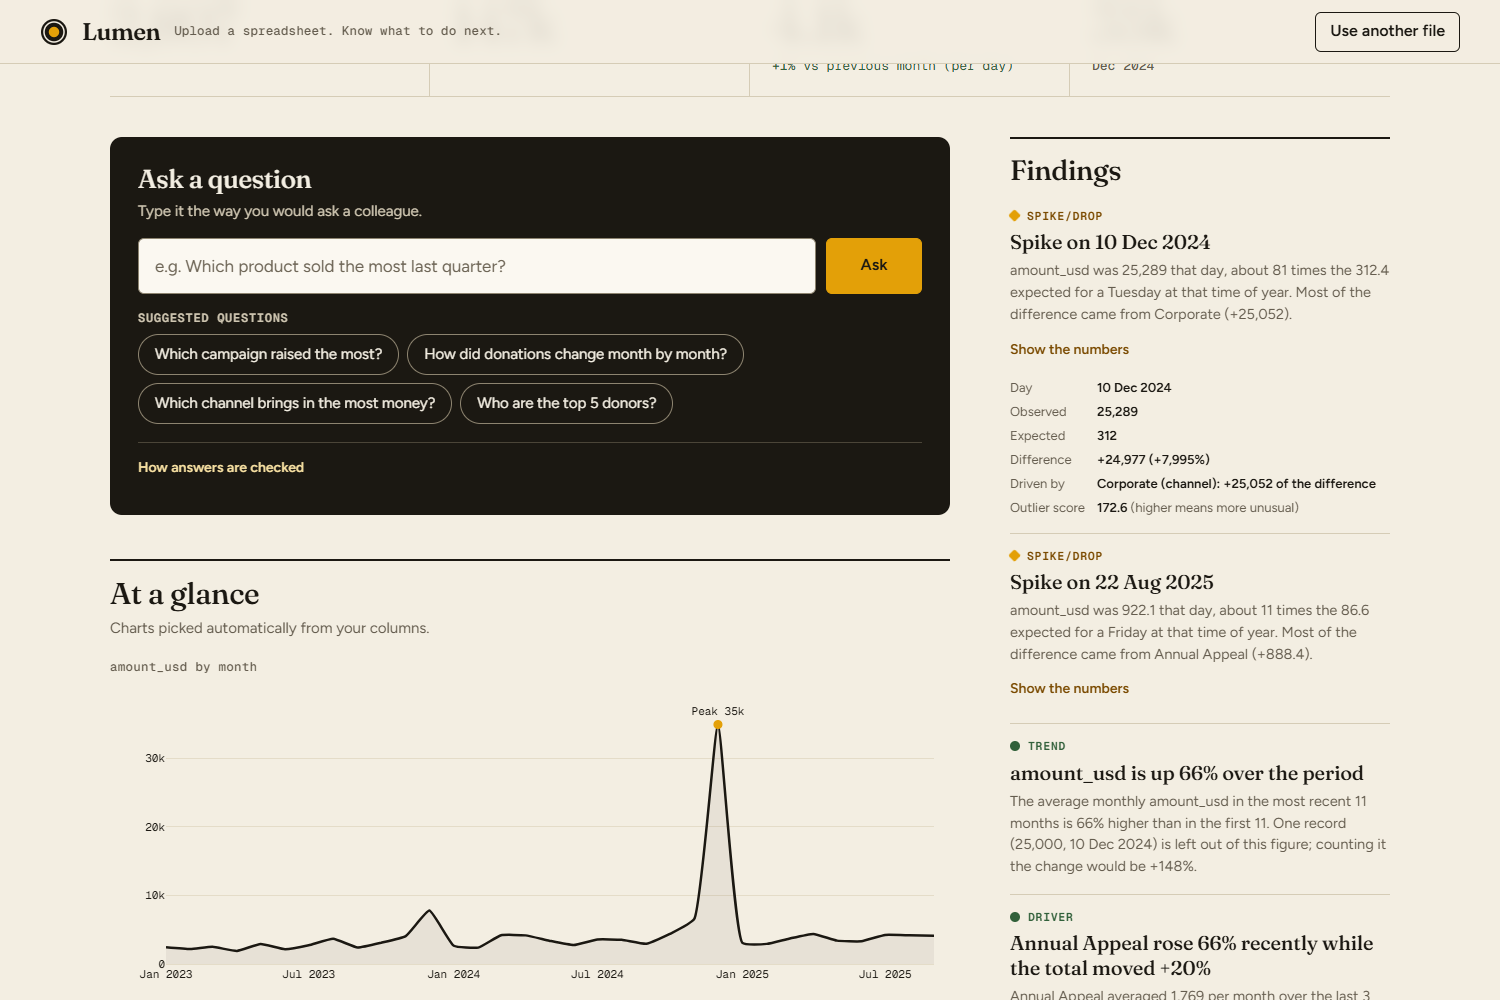
- At a glance: key numbers (total, latest month vs the previous one per day, best month) and charts picked automatically from your columns.
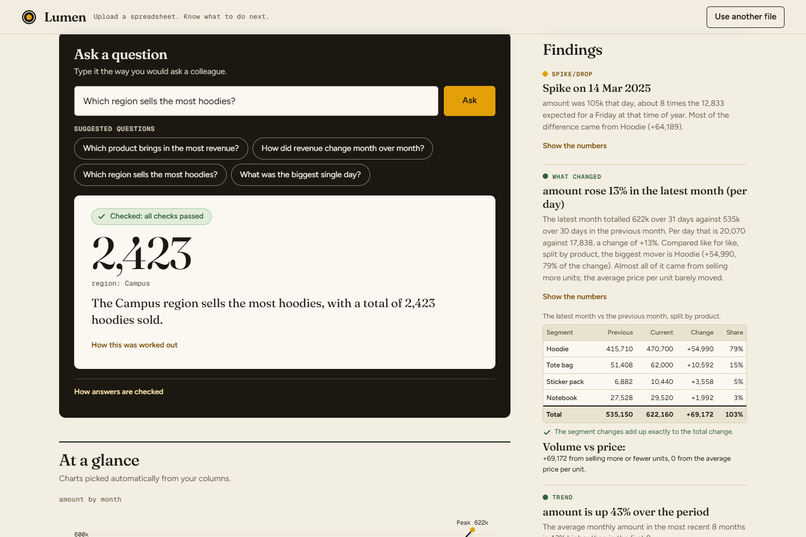
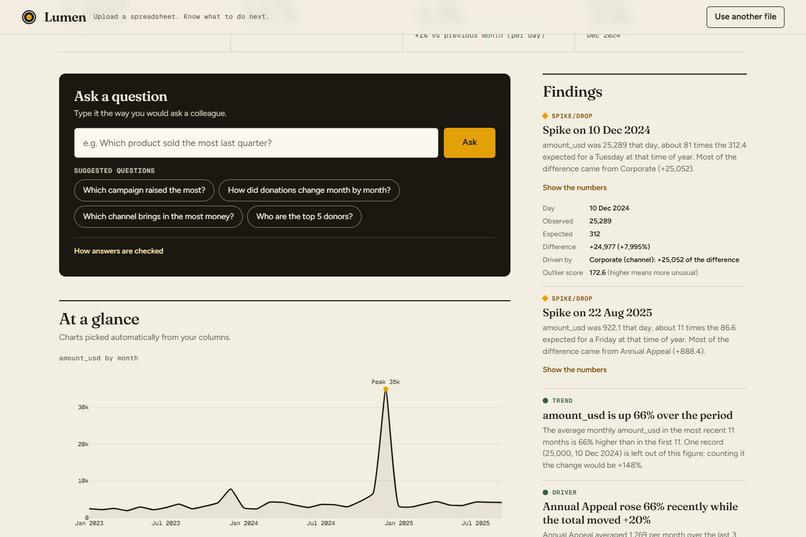
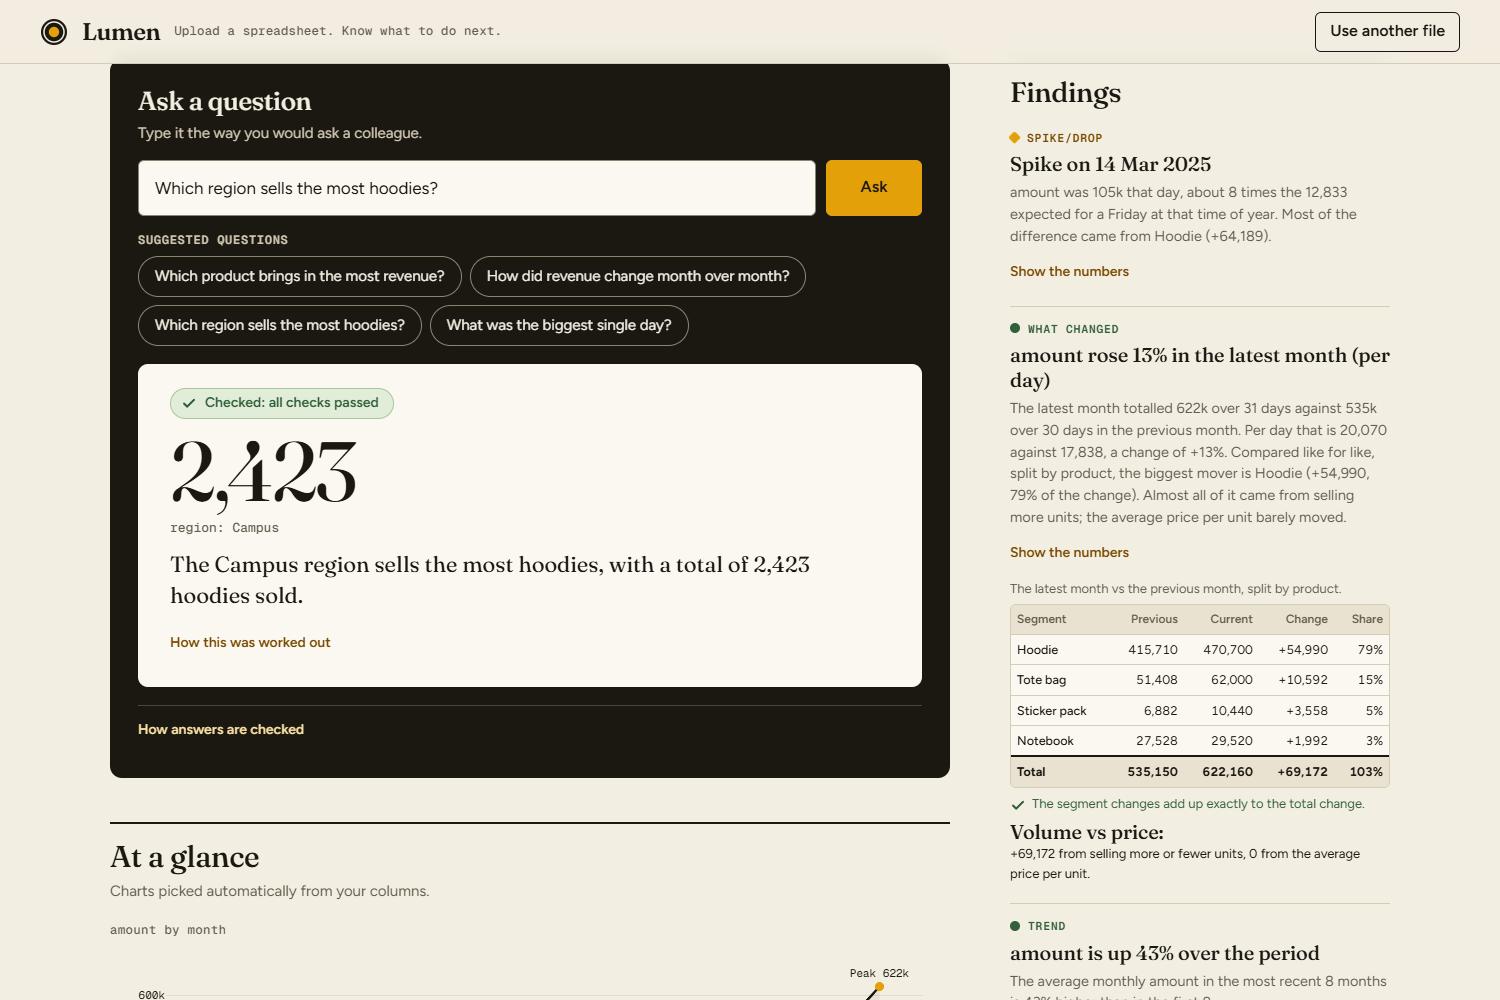
- Findings: spikes and drops with the segment that caused them, what changed between periods, trends, concentration risk ("Hoodie drives 75% of amount"), and groups moving against the total. Each one opens up to show the numbers behind it.
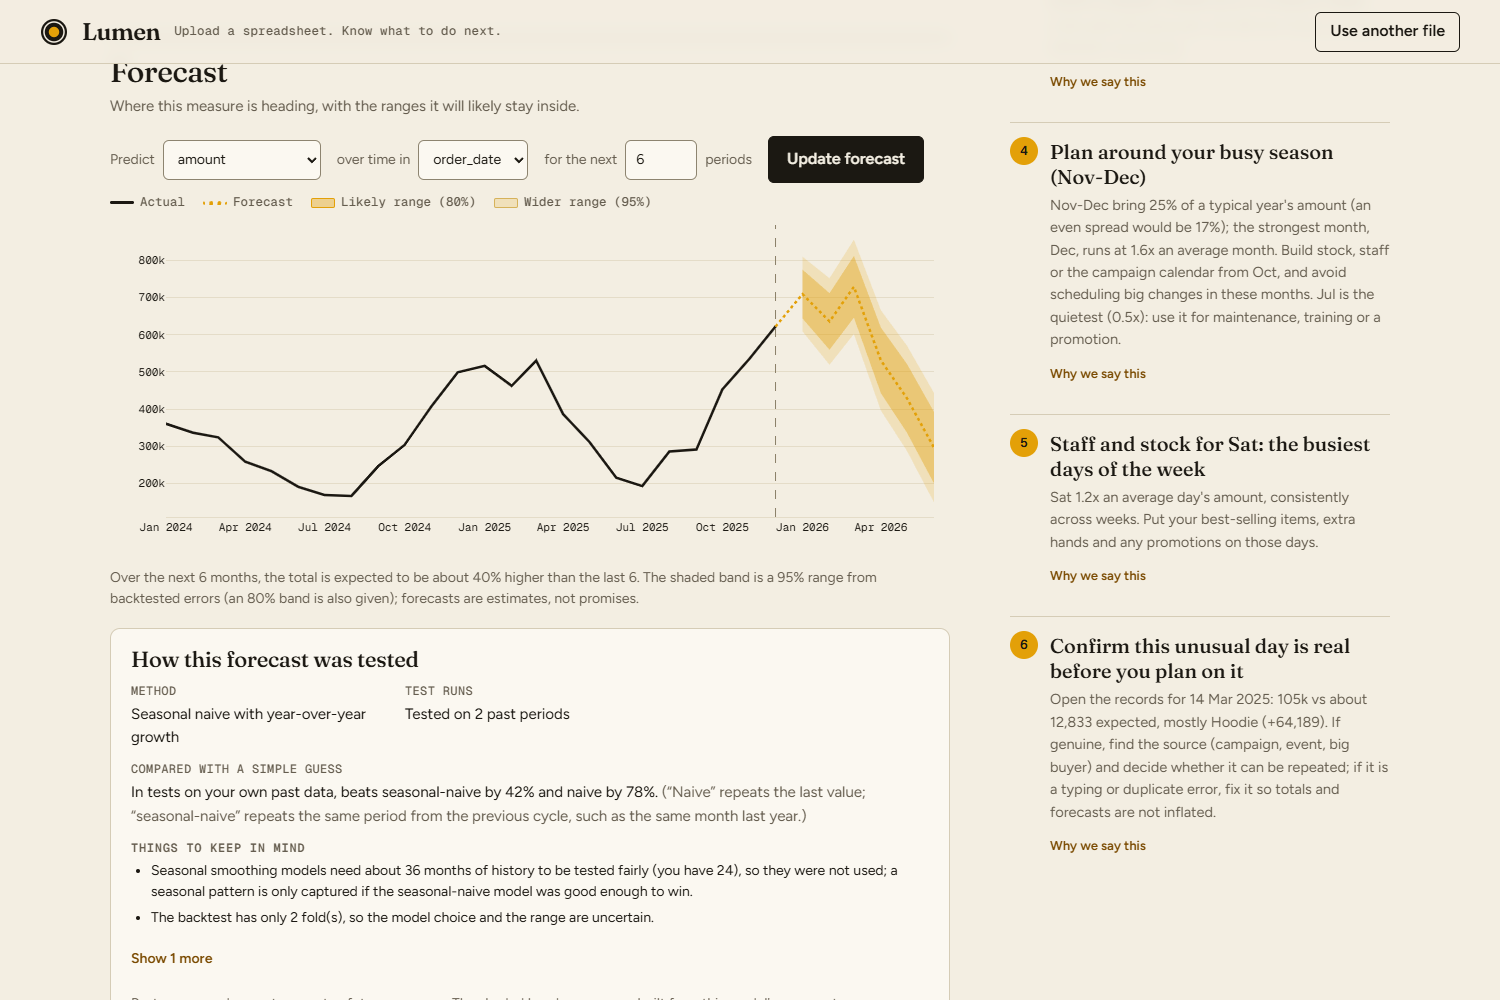
- What to do next: concrete steps, each with a "Why we say this" that quotes the evidence.
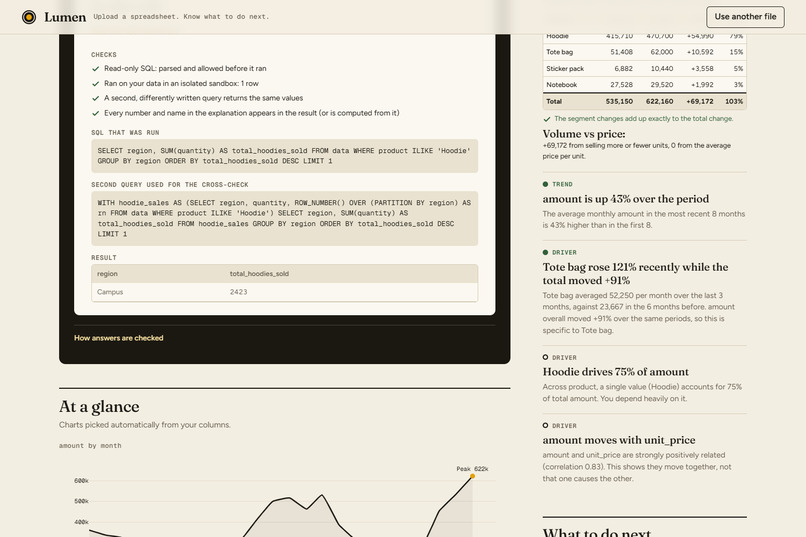
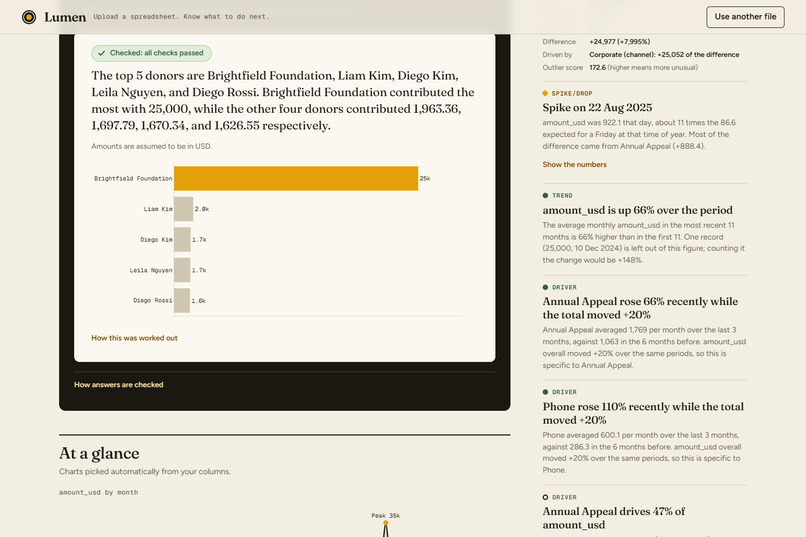
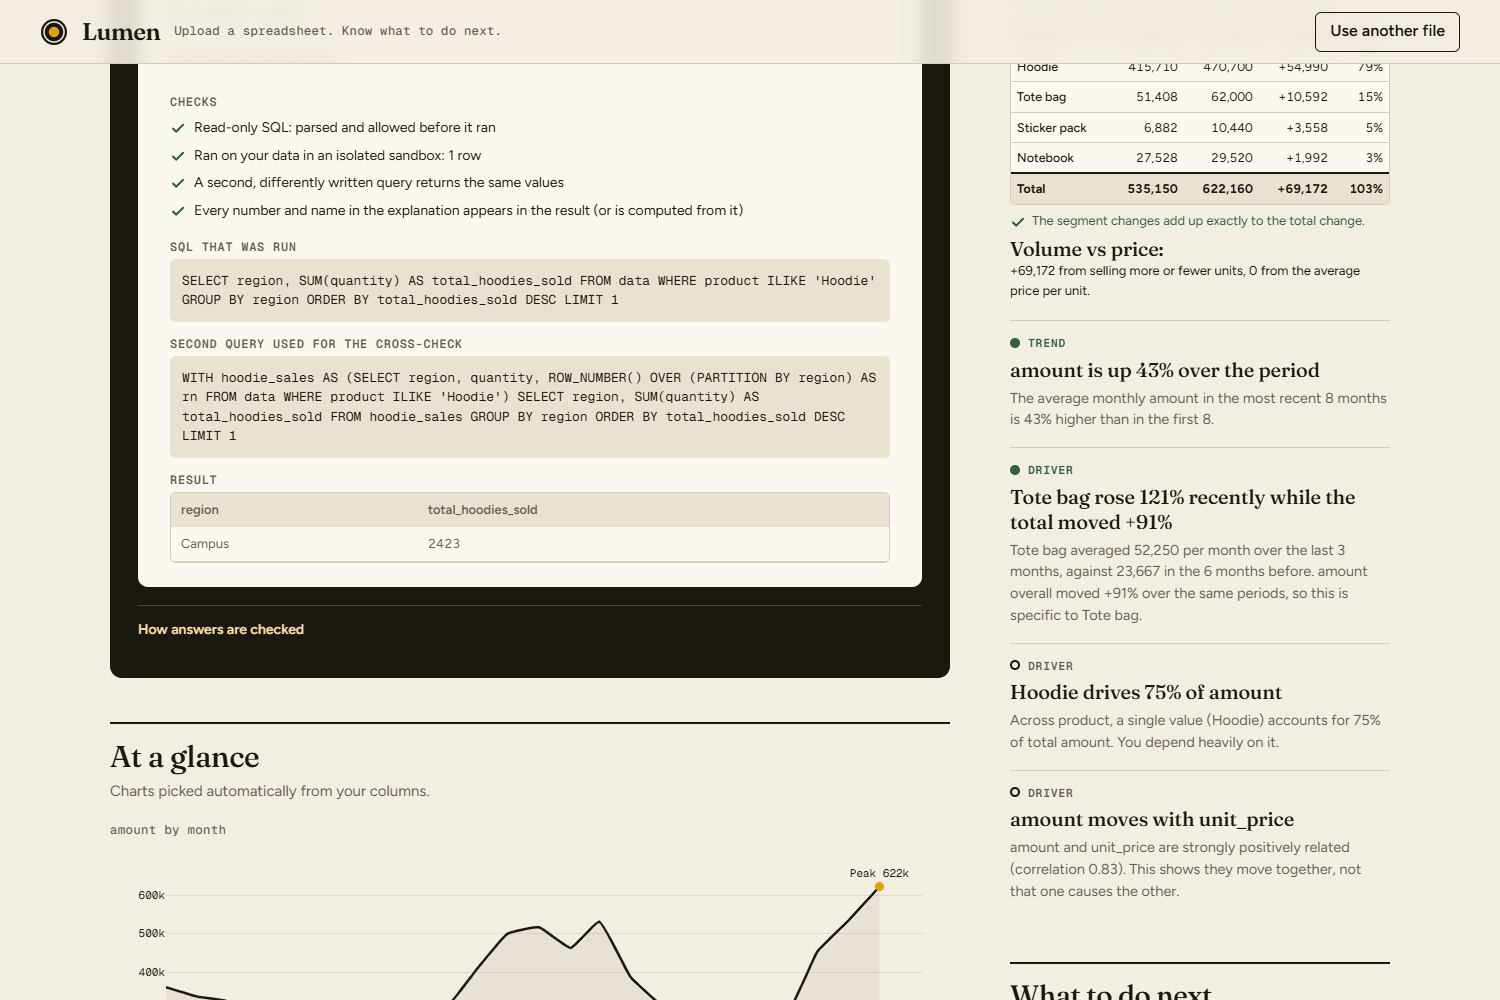
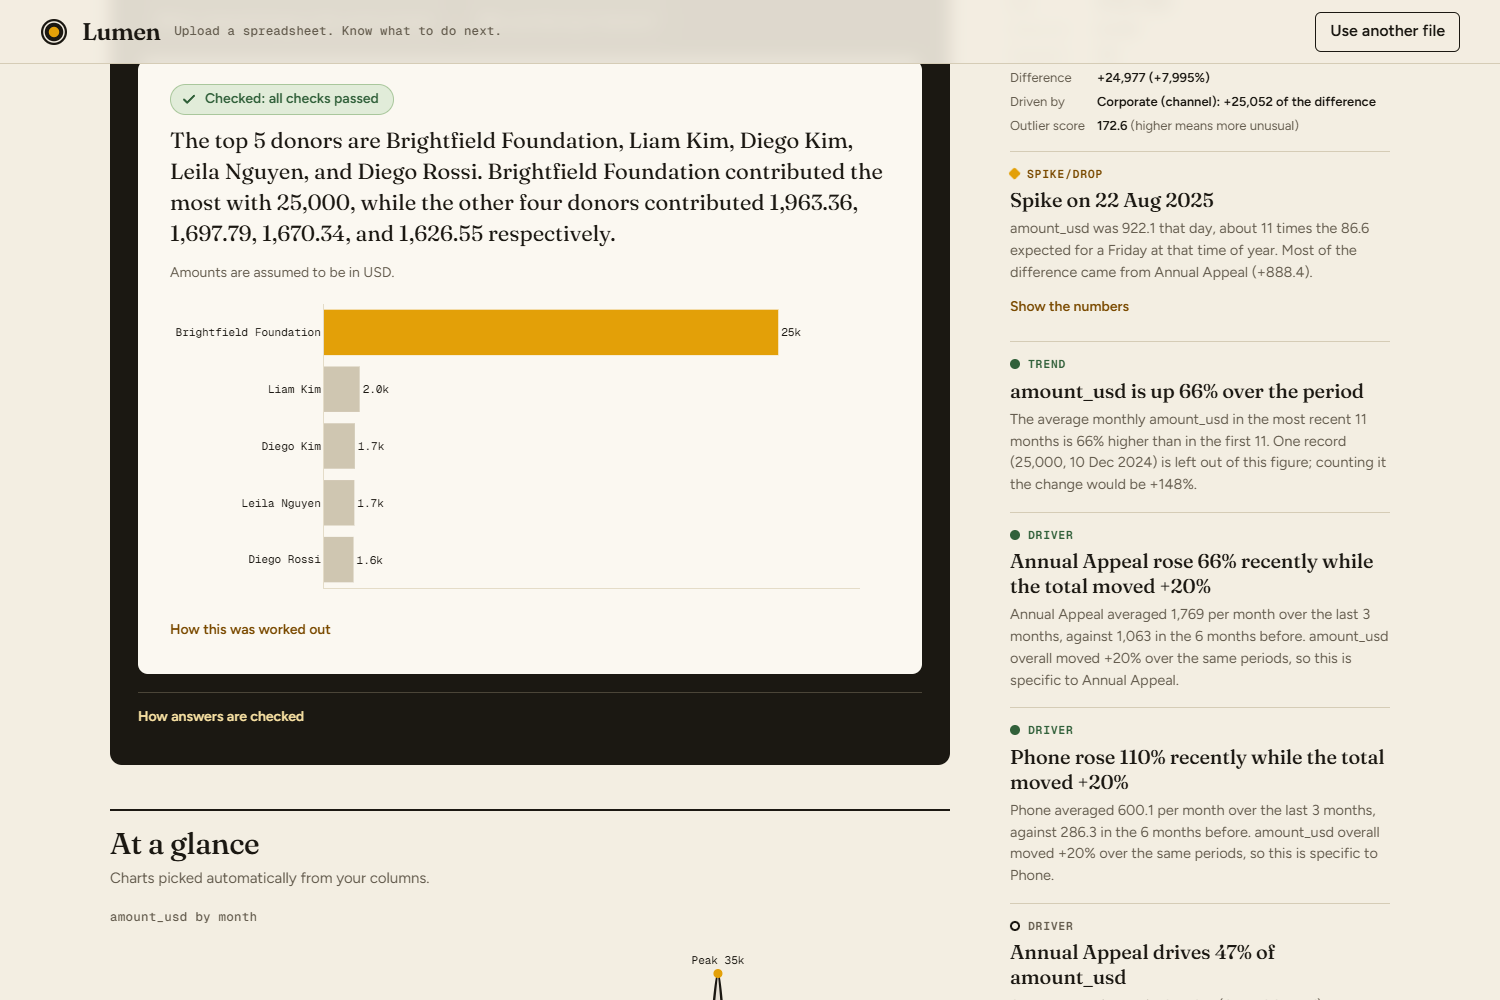
- Ask a question: type it the way you'd ask a colleague. You get an answer, a chart, a badge such as "Checked: all checks passed", the list of checks, the SQL that ran, the second query used to cross-check it, and the result table.
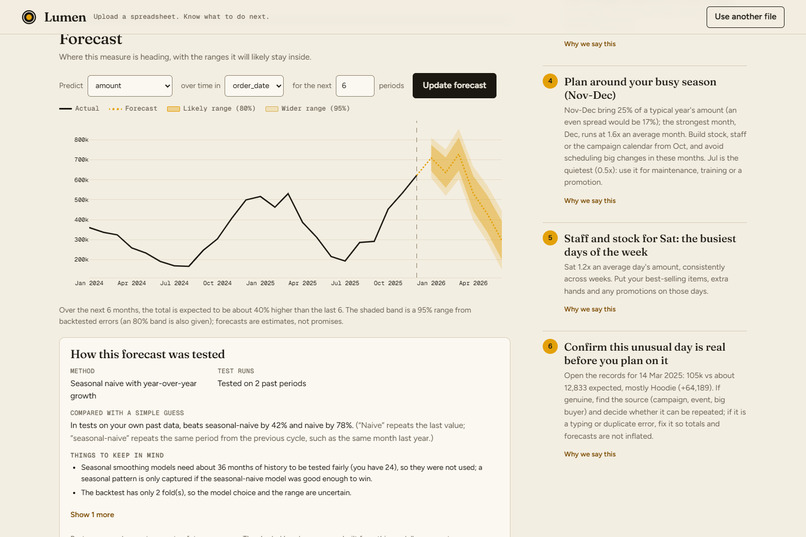
- Forecast: pick a measure and horizon to get a forecast with likely (80%) and wider (95%) ranges, plus how it did against a simple guess on your own history.
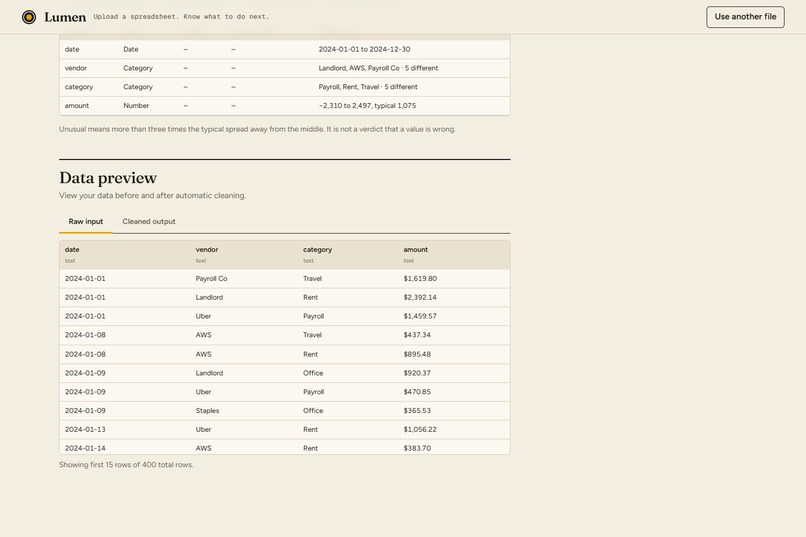
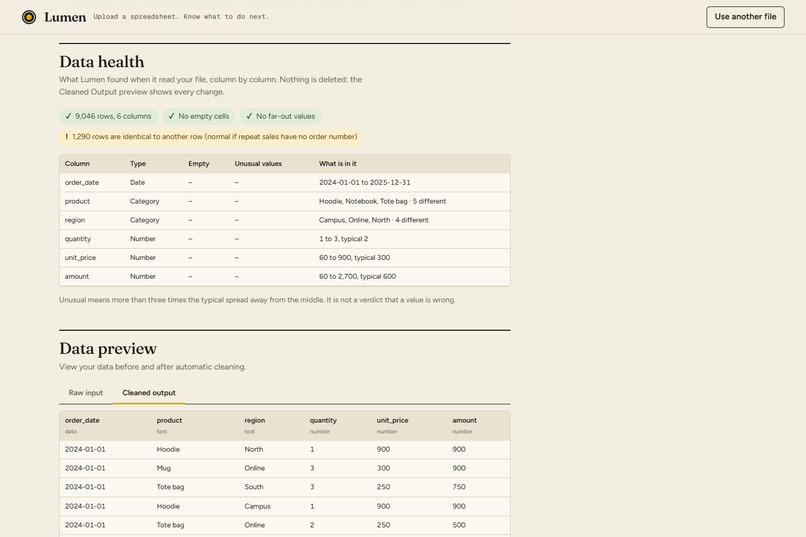
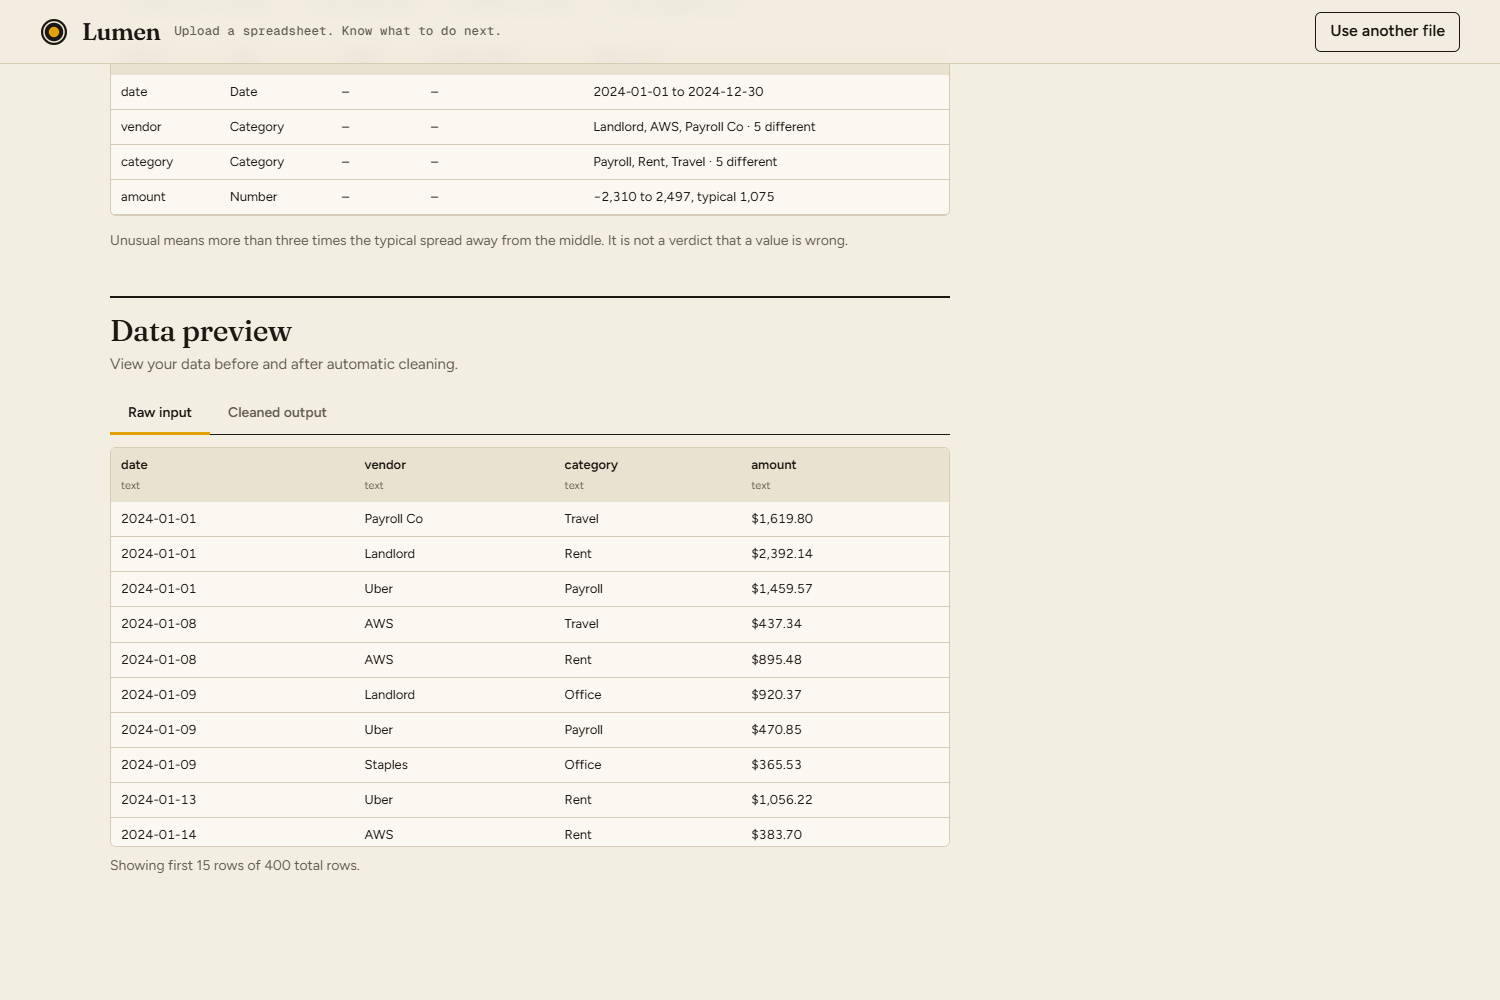
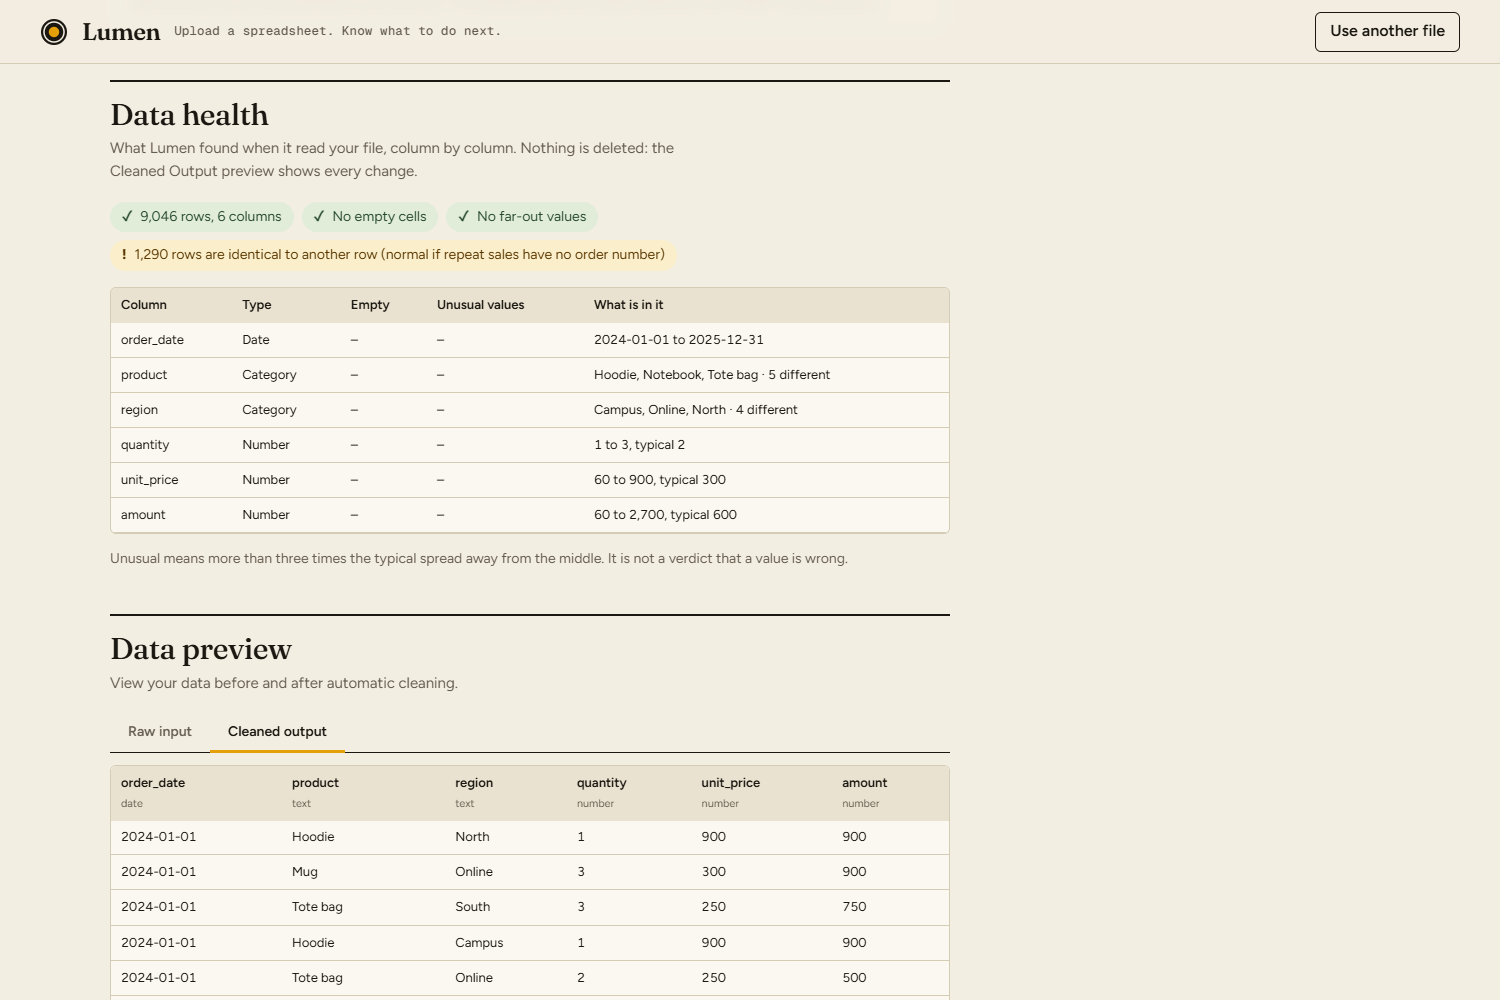
- Data health and Data preview: what Lumen found in each column, and the raw input next to the cleaned output so every change is visible.
- Print or save a one-page report to share with a committee or co-founder.
Everything except free-text questions works with no API key, so Lumen can run entirely on your own machine.
How we built it
Backend: Python, FastAPI, pandas, DuckDB, statsmodels. AI: Google Gemini, with automatic fail-over across several models. Frontend: a single-page app with Plotly and the Fraunces, Figtree and Geist Mono fonts bundled locally. It makes no third-party requests and is served under a strict Content Security Policy. It runs in Docker and works at phone width.
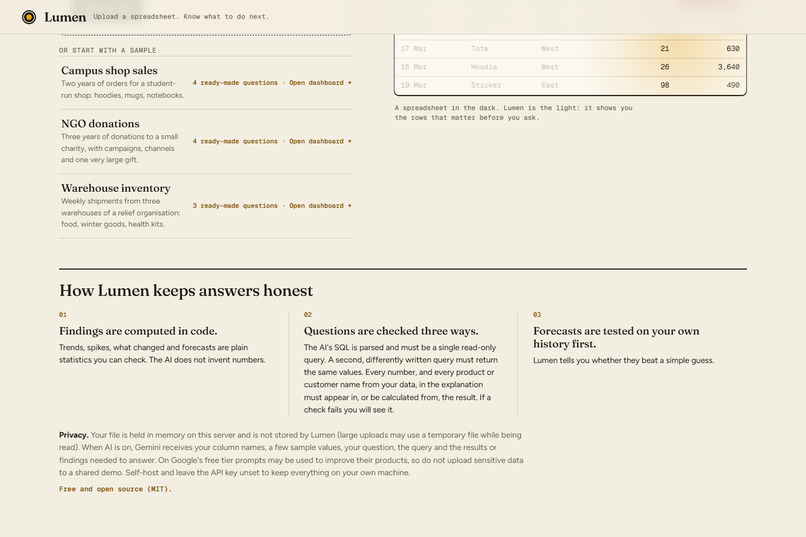
The rule: the model is never trusted with a number. Gemini never answers a question directly. It writes SQL. Then:
- A parser guard, not a keyword blocklist. DuckDB's own parser must see exactly one
SELECTover the tabledata. Table functions, file reads,PRAGMAandCOPYare rejected wherever they appear. - A sandbox. In-memory DuckDB with file and network access off, configuration locked, 2 threads, a 512 MB memory cap, a 10-second timeout and a 1,000-row limit.
- A second, independent query. The model must write the query a second way. If the results differ, the answer is flagged. A query that only repeats the first doesn't count as a cross-check.
- Number and name grounding. Every number in the explanation must trace to the result: a cell, or a sum, share, difference or percentage change computed from cells. For a number shown with \( d \) decimal places we accept a match within
$$ \tau = \tfrac{1}{2}\cdot 10^{-d} $$
so "34.6%" must really round to 34.6. If the explanation names a product, donor or region that isn't in the result, the AI's wording is thrown away and a plain summary built in code is shown instead.
"What changed" that adds up exactly. For a measure \( Y \) split into segments \( s \), the change between two equal periods is broken into per-segment contributions that sum exactly to the total. We check this in code:
$$ \Delta Y = Y^{\text{now}} - Y^{\text{before}} = \sum_{s} \left( Y_s^{\text{now}} - Y_s^{\text{before}} \right) $$
Months of different lengths are compared per day, so a 31-day December isn't mistaken for growth over a 30-day November. Lumen also checks last year's same step and says when a rise is "mostly the usual season".
Forecasts that are tested first. Lumen backtests several candidates on your own history (naive, seasonal naive, exponential smoothing, Theta, and their averages) and keeps the winner. Its ranges come from that model's own past errors. We measure accuracy with MASE, the mean absolute scaled error:
$$ \text{MASE} = \frac{\text{average forecast error}}{\text{average error of a seasonal-naive guess}} $$
where \( m \) is the seasonal period. \( \text{MASE} < 1 \) means the forecast beats a seasonal-naive guess. With too little history, Lumen says so instead of drawing a confident line.
Challenges we ran into
- Our first SQL guard was bypassed. It was a keyword blocklist. DuckDB's
query()function runs a string as SQL, soquery(replace('...duck#db_settings()', '#', ''))builds a blocked word at run time and walks straight past it. We rebuilt the guard on DuckDB's own parser, which sees what a query does, not just its text. - Real spreadsheets are messy. Title rows above the header, "TOTAL" rows that double-count,
03/04/2025(March or April?), lakh-formatted numbers, UTF-16 files, Excel serial dates, survey codes like 99 for "no answer". We built a regression suite of 40+ deliberately messy files. - Honest forecasts. We tried a high/medium/low confidence label. Our benchmark showed it did not predict accuracy, so we removed it.
- Auditing our own checks. A review found the model could pass the cross-check by repeating the same query, so Lumen now compares the parsed queries. We also saw the reverse: a correct answer flagged because 1,125 orders tied for the largest amount and the two queries picked different tied rows. And testing showed that checks can't catch a misread question: "last year" can mean last calendar year or the last year in the data. That's why Lumen always shows the SQL and the result next to the answer.
- Free-tier limits. 512 MB of RAM and a limited AI quota pushed us to add per-client rate limits, memory-bounded sessions, and a keyless demo mode that replays stored questions on live data.
Accomplishments that we're proud of
- Plain-English questions: 20 questions on the sample shop data, each scored against an answer computed independently in pandas: 20/20 correct, median 5.4 s per question.
- Forecaster: on 90 synthetic monthly, weekly and daily series, median MASE was \( 0.820 \) against \( 0.812 \) for plain Holt-Winters. It beat a repeat-the-last-value guess on 73% of series, and its 95% range contained the truth 93.7% of the time.
- Spike detector: false alarms on 4 of 150 pure-noise series (2.7%). A planted spike of \( 5\times \) a normal day was found 60 of 60 times.
- Tests: 266 automated tests, including a 75-case SQL attack suite and 40+ messy real-world-style files.
- Memory: 314 MB peak with three datasets and a 185,000-row upload, which fits a free 512 MB host.
- Insight-first: Lumen produces a full dashboard of findings and next steps before the user types a single question.
What we learned
- Verification beats confidence. An AI answer helps a non-expert only if the system can show why it's right, and admit what it can't check.
- Measure before you claim. Every number we publish comes from a benchmark in the repo, and one feature died because the data said it didn't work.
- Security needs structure, not patterns. Blocklists fail against an attacker who can build strings at run time.
- Messy input is the real product. Most of "upload a CSV" is making sense of the files people actually have.
What's next for Lumen
Date-aware questions ("last year" relative to today, with the period stated in the answer), reading wide pivot-style sheets (one column per month), tie-aware SQL, a download for the cleaned file, and more sample datasets for NGOs and student organisations.


Log in or sign up for Devpost to join the conversation.