
Inspiration
The Gilded Ace's GM wanted to replace the 10 slot machines that earned the least in Jan–Jun 2025. Casino operators know raw house win is a noisy score: it mixes luck, floor location and game math. We wanted to show, with the casino's own data, which of those three is really behind each "bad" machine before anyone spends money on a replacement.
What it does
An interactive dashboard that answers the challenge's six questions with one story: luck, location, or a leak?
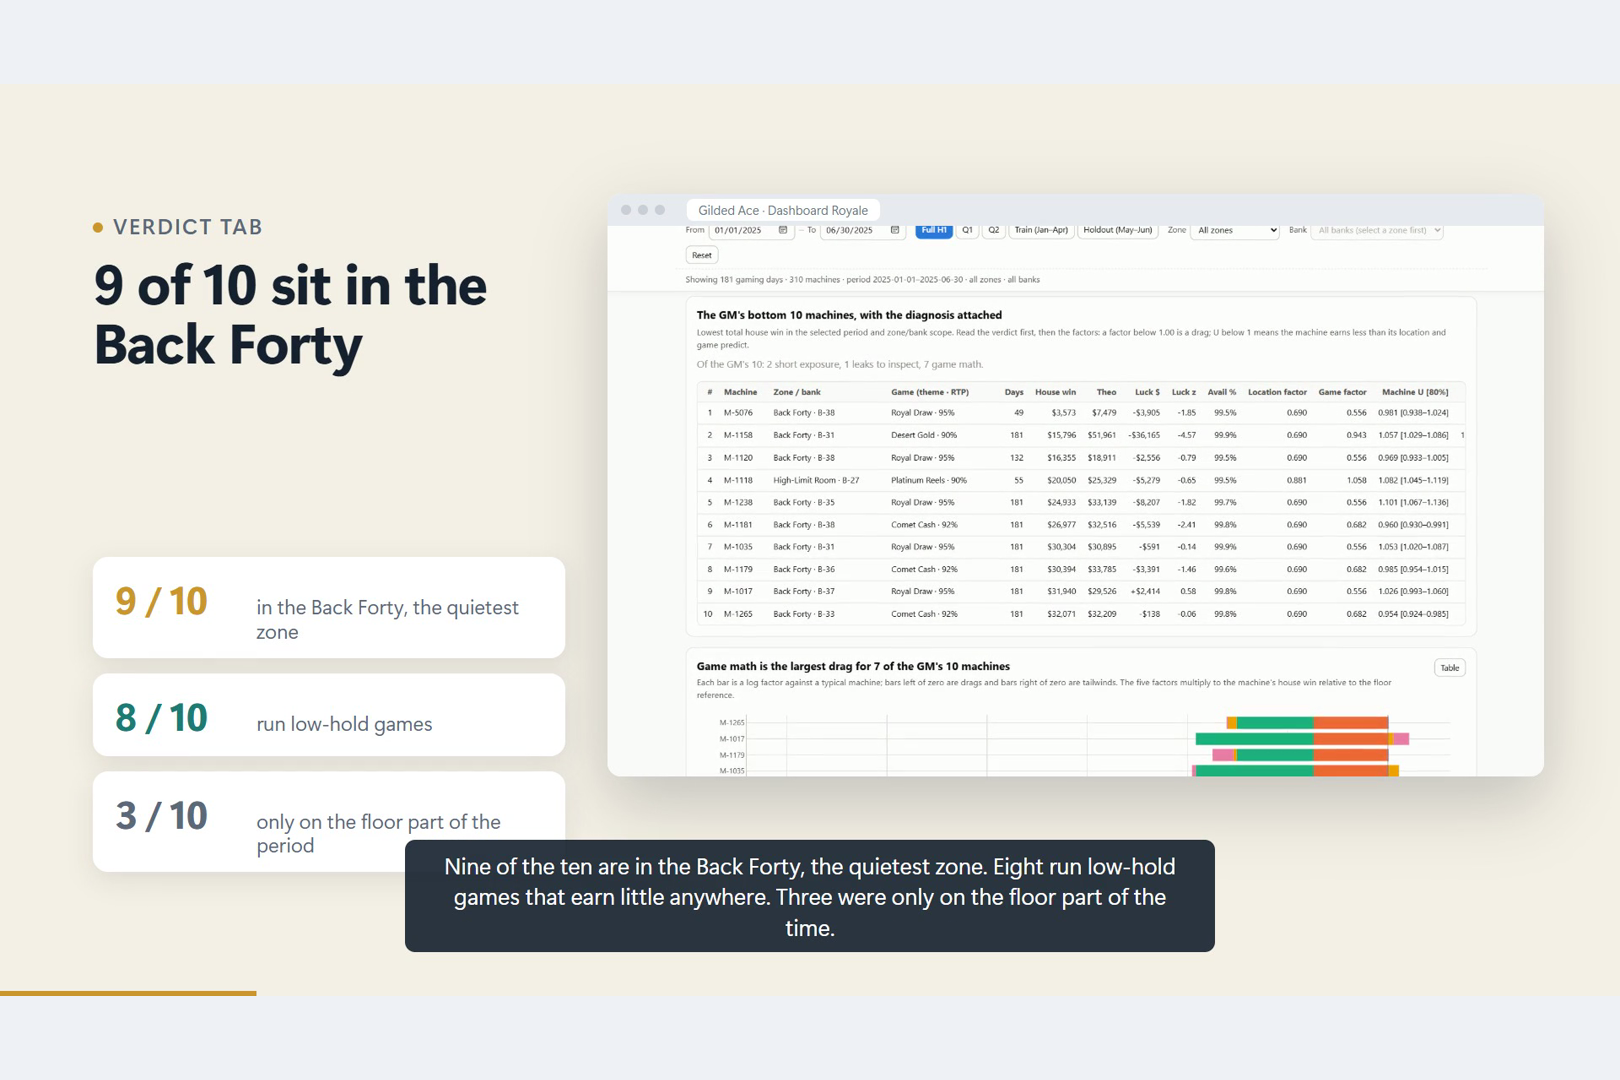
- Verdict: 9 of the GM's bottom 10 sit in the Back Forty, the quietest zone; 8 run low-hold games; 3 were only on the floor part of the period. Adjusted for zone, game and open hours, none of them is truly weak.
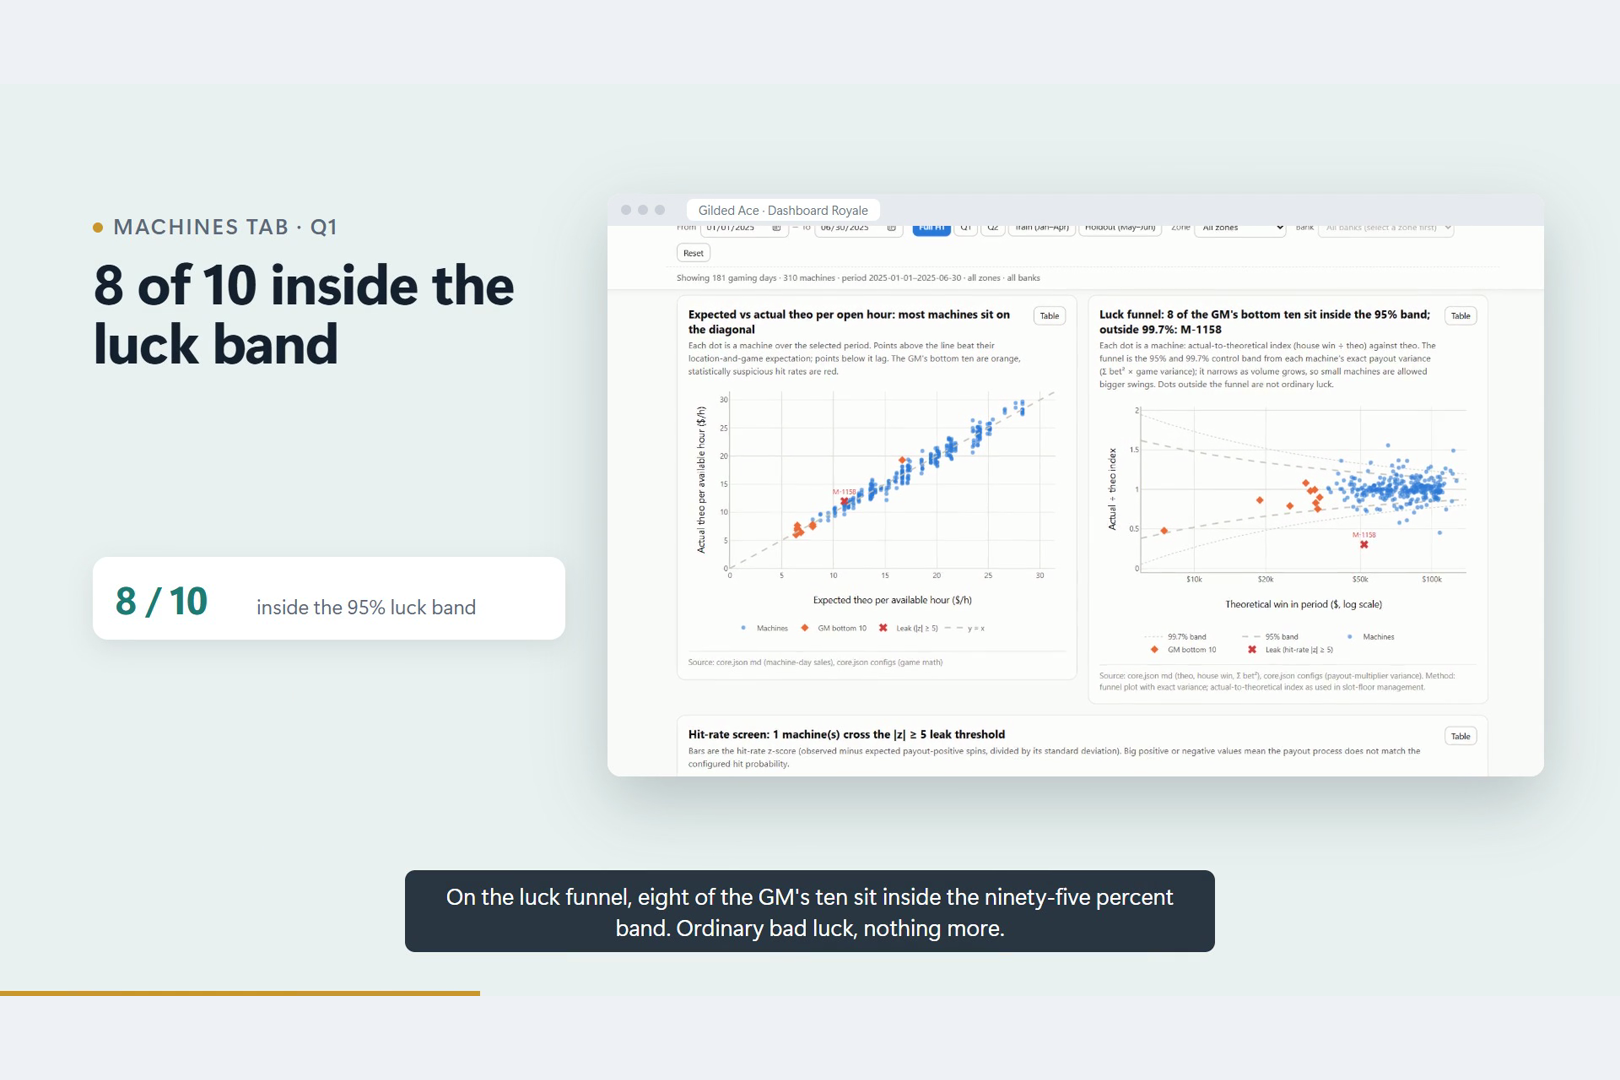
- Luck: a funnel plot of actual-to-theo index with exact luck bands (Σ bet² × payout variance). 8 of the 10 sit inside the 95% band.
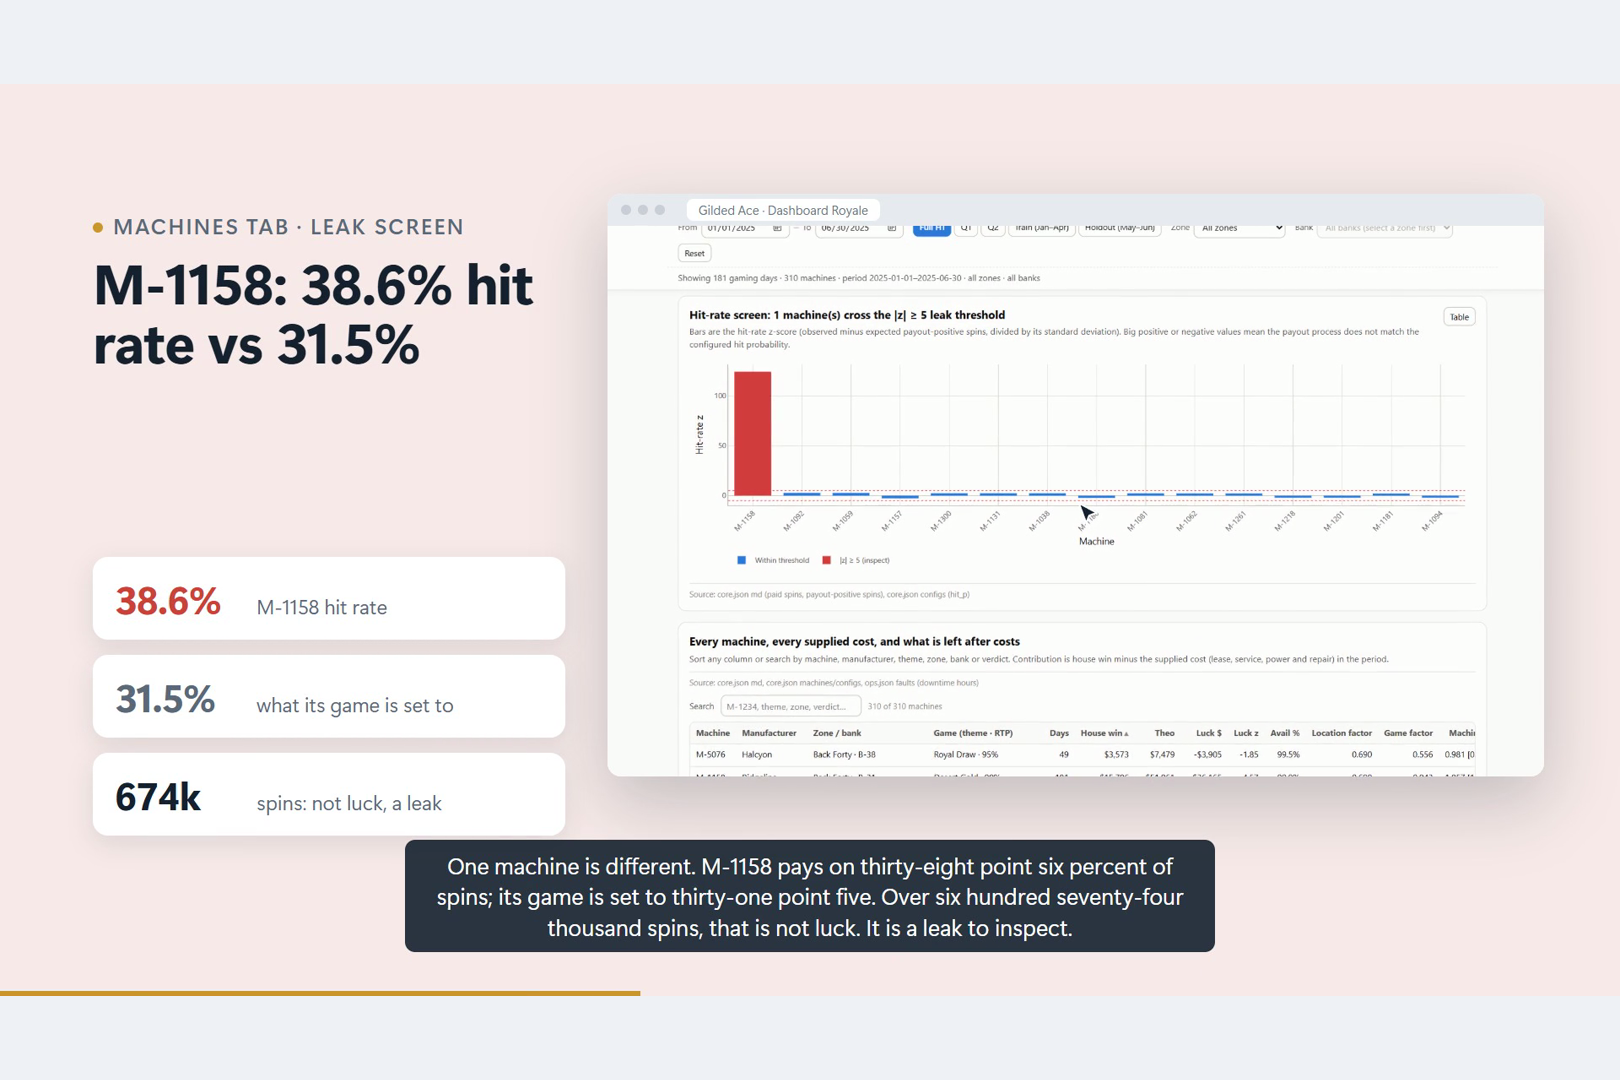
- Leak: M-1158 hits on 38.6% of spins against a 31.5% setting (z = +124 over 674k spins). That is a fault to inspect, not luck.
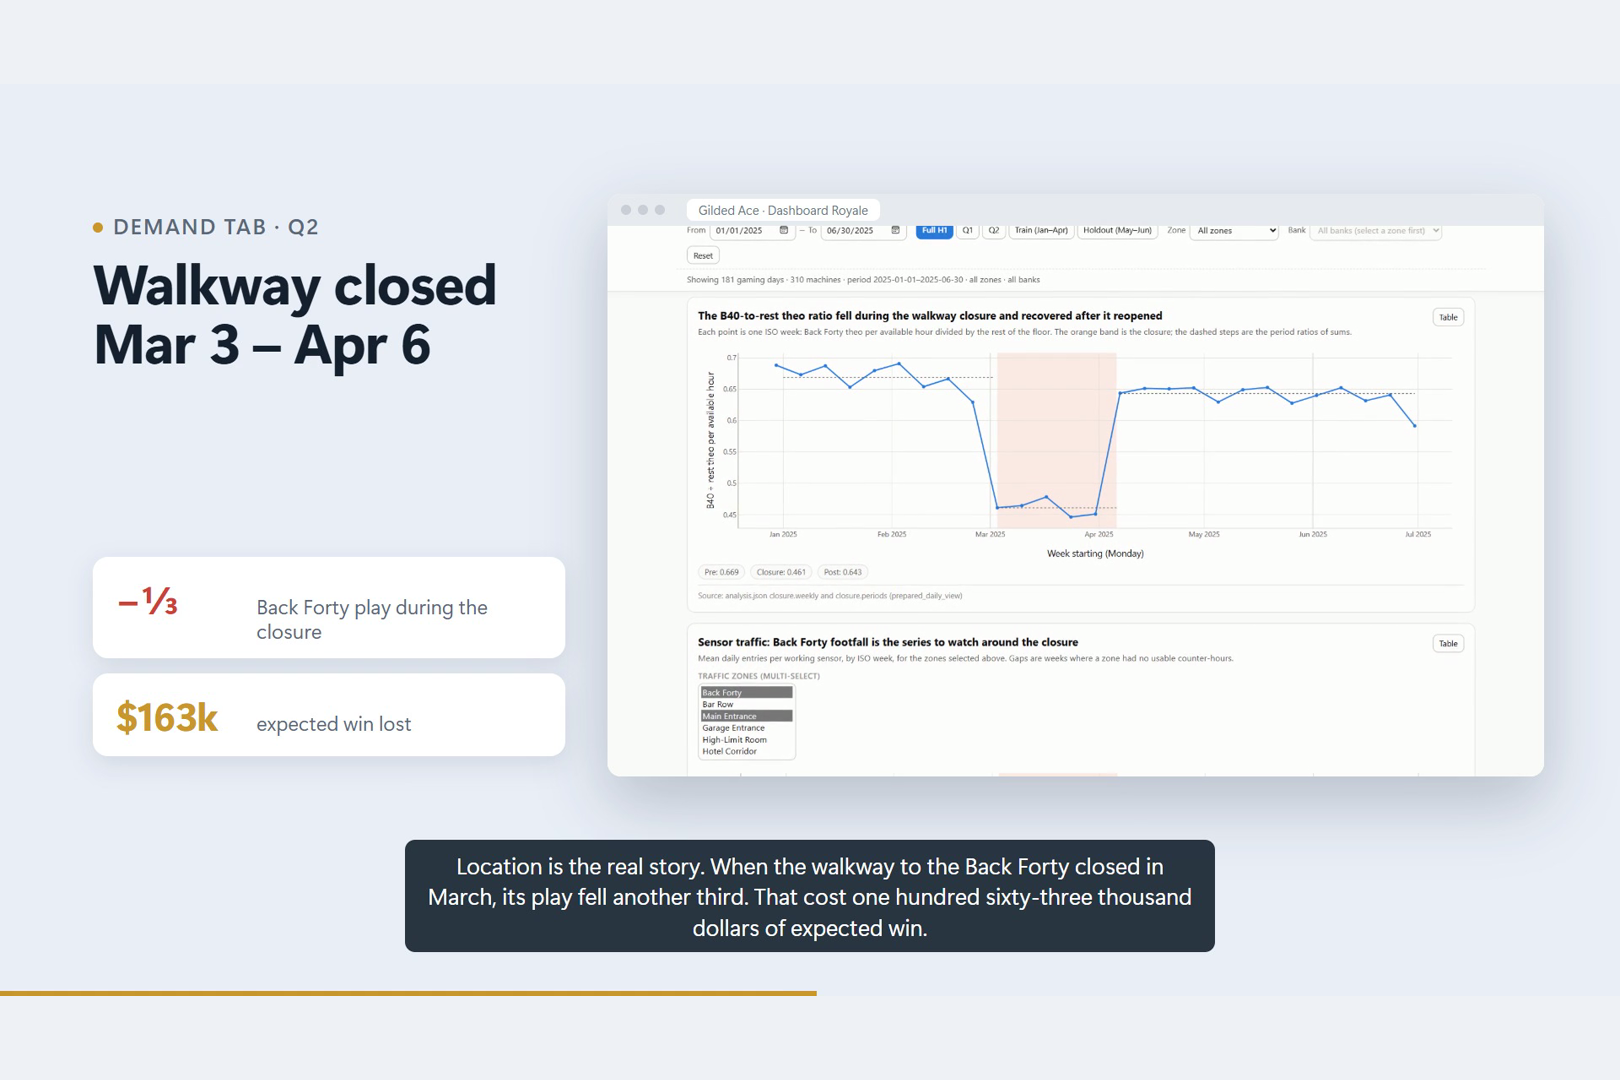
- Demand: the walkway to the Back Forty closed Mar 3–Apr 6. The zone's share of play fell by about a third, costing $163k of expected win, and it only partly recovered.
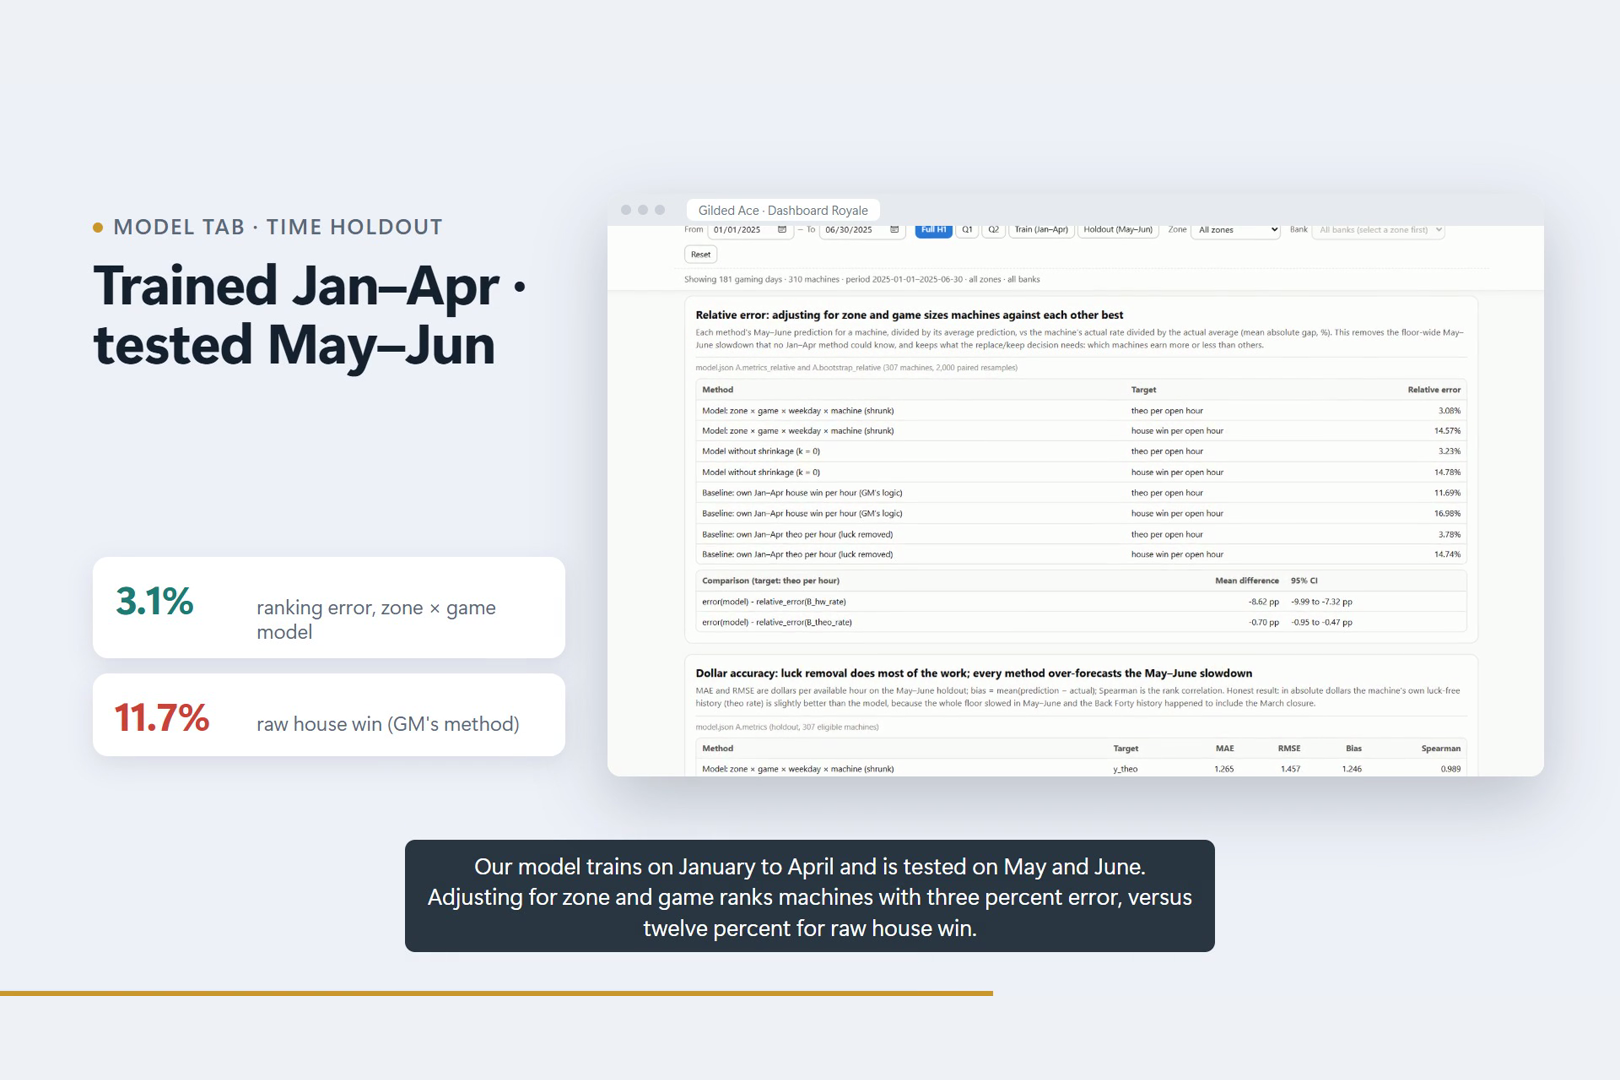
- Model: zone × game × weekday × machine model, trained on Jan–Apr and tested on May–Jun. It ranks machines with 3.1% relative error, against 11.7% for raw house win.
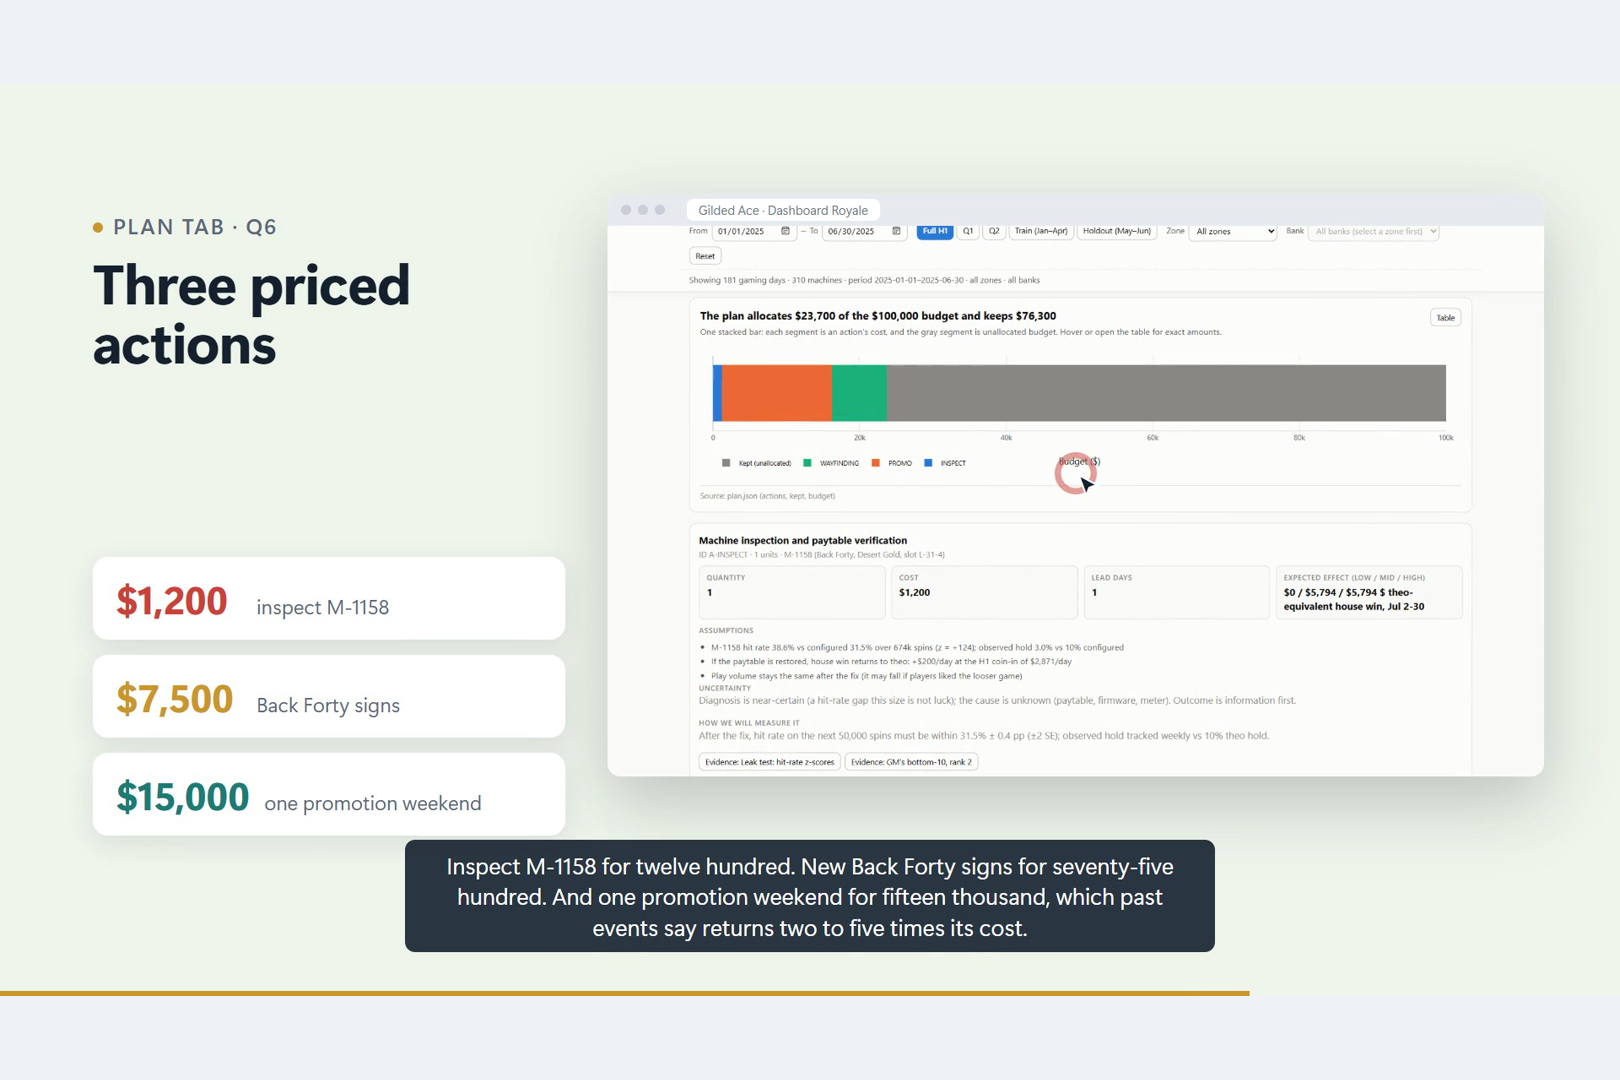
- Plan: spend $23,700 of the $100,000 budget on three priced actions (inspect M-1158 for $1,200, Back Forty signs for $7,500, one promotion weekend for $15,000) and keep $76,300.
- Every number is recomputed for any period, zone or bank, and every claim links to the chart that supports it.
How we built it
- Data: DuckDB over the provided parquet tables, with 06:00–06:00 gaming days and ratios computed as ratios of sums.
- Analysis and model: Python (pandas, numpy, statsmodels). The model is an IPF zone × game × weekday × machine model; machine factors are shrunk with k tuned on an inner time split, and intervals are quasi-Poisson. A second, weekday + event model forecasts floor coin-in and serves as the counterfactual for the promotion.
- Dashboard: a static site in HTML, vanilla JS and Plotly, with a global period / zone / bank filter bar, 9 tabs, and evidence links that scroll to and highlight the supporting chart.
- Checks: a claims-and-evidence appendix and an automated audit of the numbers in our text against the data.
- AI tools: used for coding, review and the video voiceover, as disclosed in the appendix.
Challenges we ran into
- Separating luck from a fault: we needed the exact variance of each machine's result, not a rule-of-thumb percentage band.
- Machines that were installed or retired mid-period make raw totals misleading, so everything is measured per open hour.
- The walkway closure and the May–June slowdown overlap the holdout. All our forecasts over-forecast May–June, and we report that honestly instead of hiding it.
- Pricing actions with no direct experiment: we used past events and a frozen counterfactual forecast to bound the returns.
Accomplishments that we're proud of
- A clear, data-backed answer to the GM: keep the ten, fix the leak, bring the players back.
- A model that beats the GM's ranking method on a true time holdout. The GM's list was average in May–June; ours stayed weak.
- Every claim traceable to its evidence in one click.
What we learned
- Location and game math explain most of a slot's earnings.
- A funnel plot is the clearest way to show luck to a non-statistician.
- Honest error reporting (where the model misses) builds more trust than a single headline accuracy number.
What's next for Luck, Location, or a Leak? — Gilded Ace
- Check the M-1158 inspection result and feed it back into the leak screen.
- Run the promotion weekend as a measured test against the frozen forecast.
- Track the Back Forty signage effect.
- Revisit machine swaps in August, when the swap data supports them.
