Inspiration
College campuses are full of events, activities, and places to explore, but finding out what's happening often means checking multiple platforms, scrolling through social media, or relying on word of mouth. We wanted to make campus life easier to navigate by creating one place where students can discover events, see what's happening around them, and find their next destination.
What it does
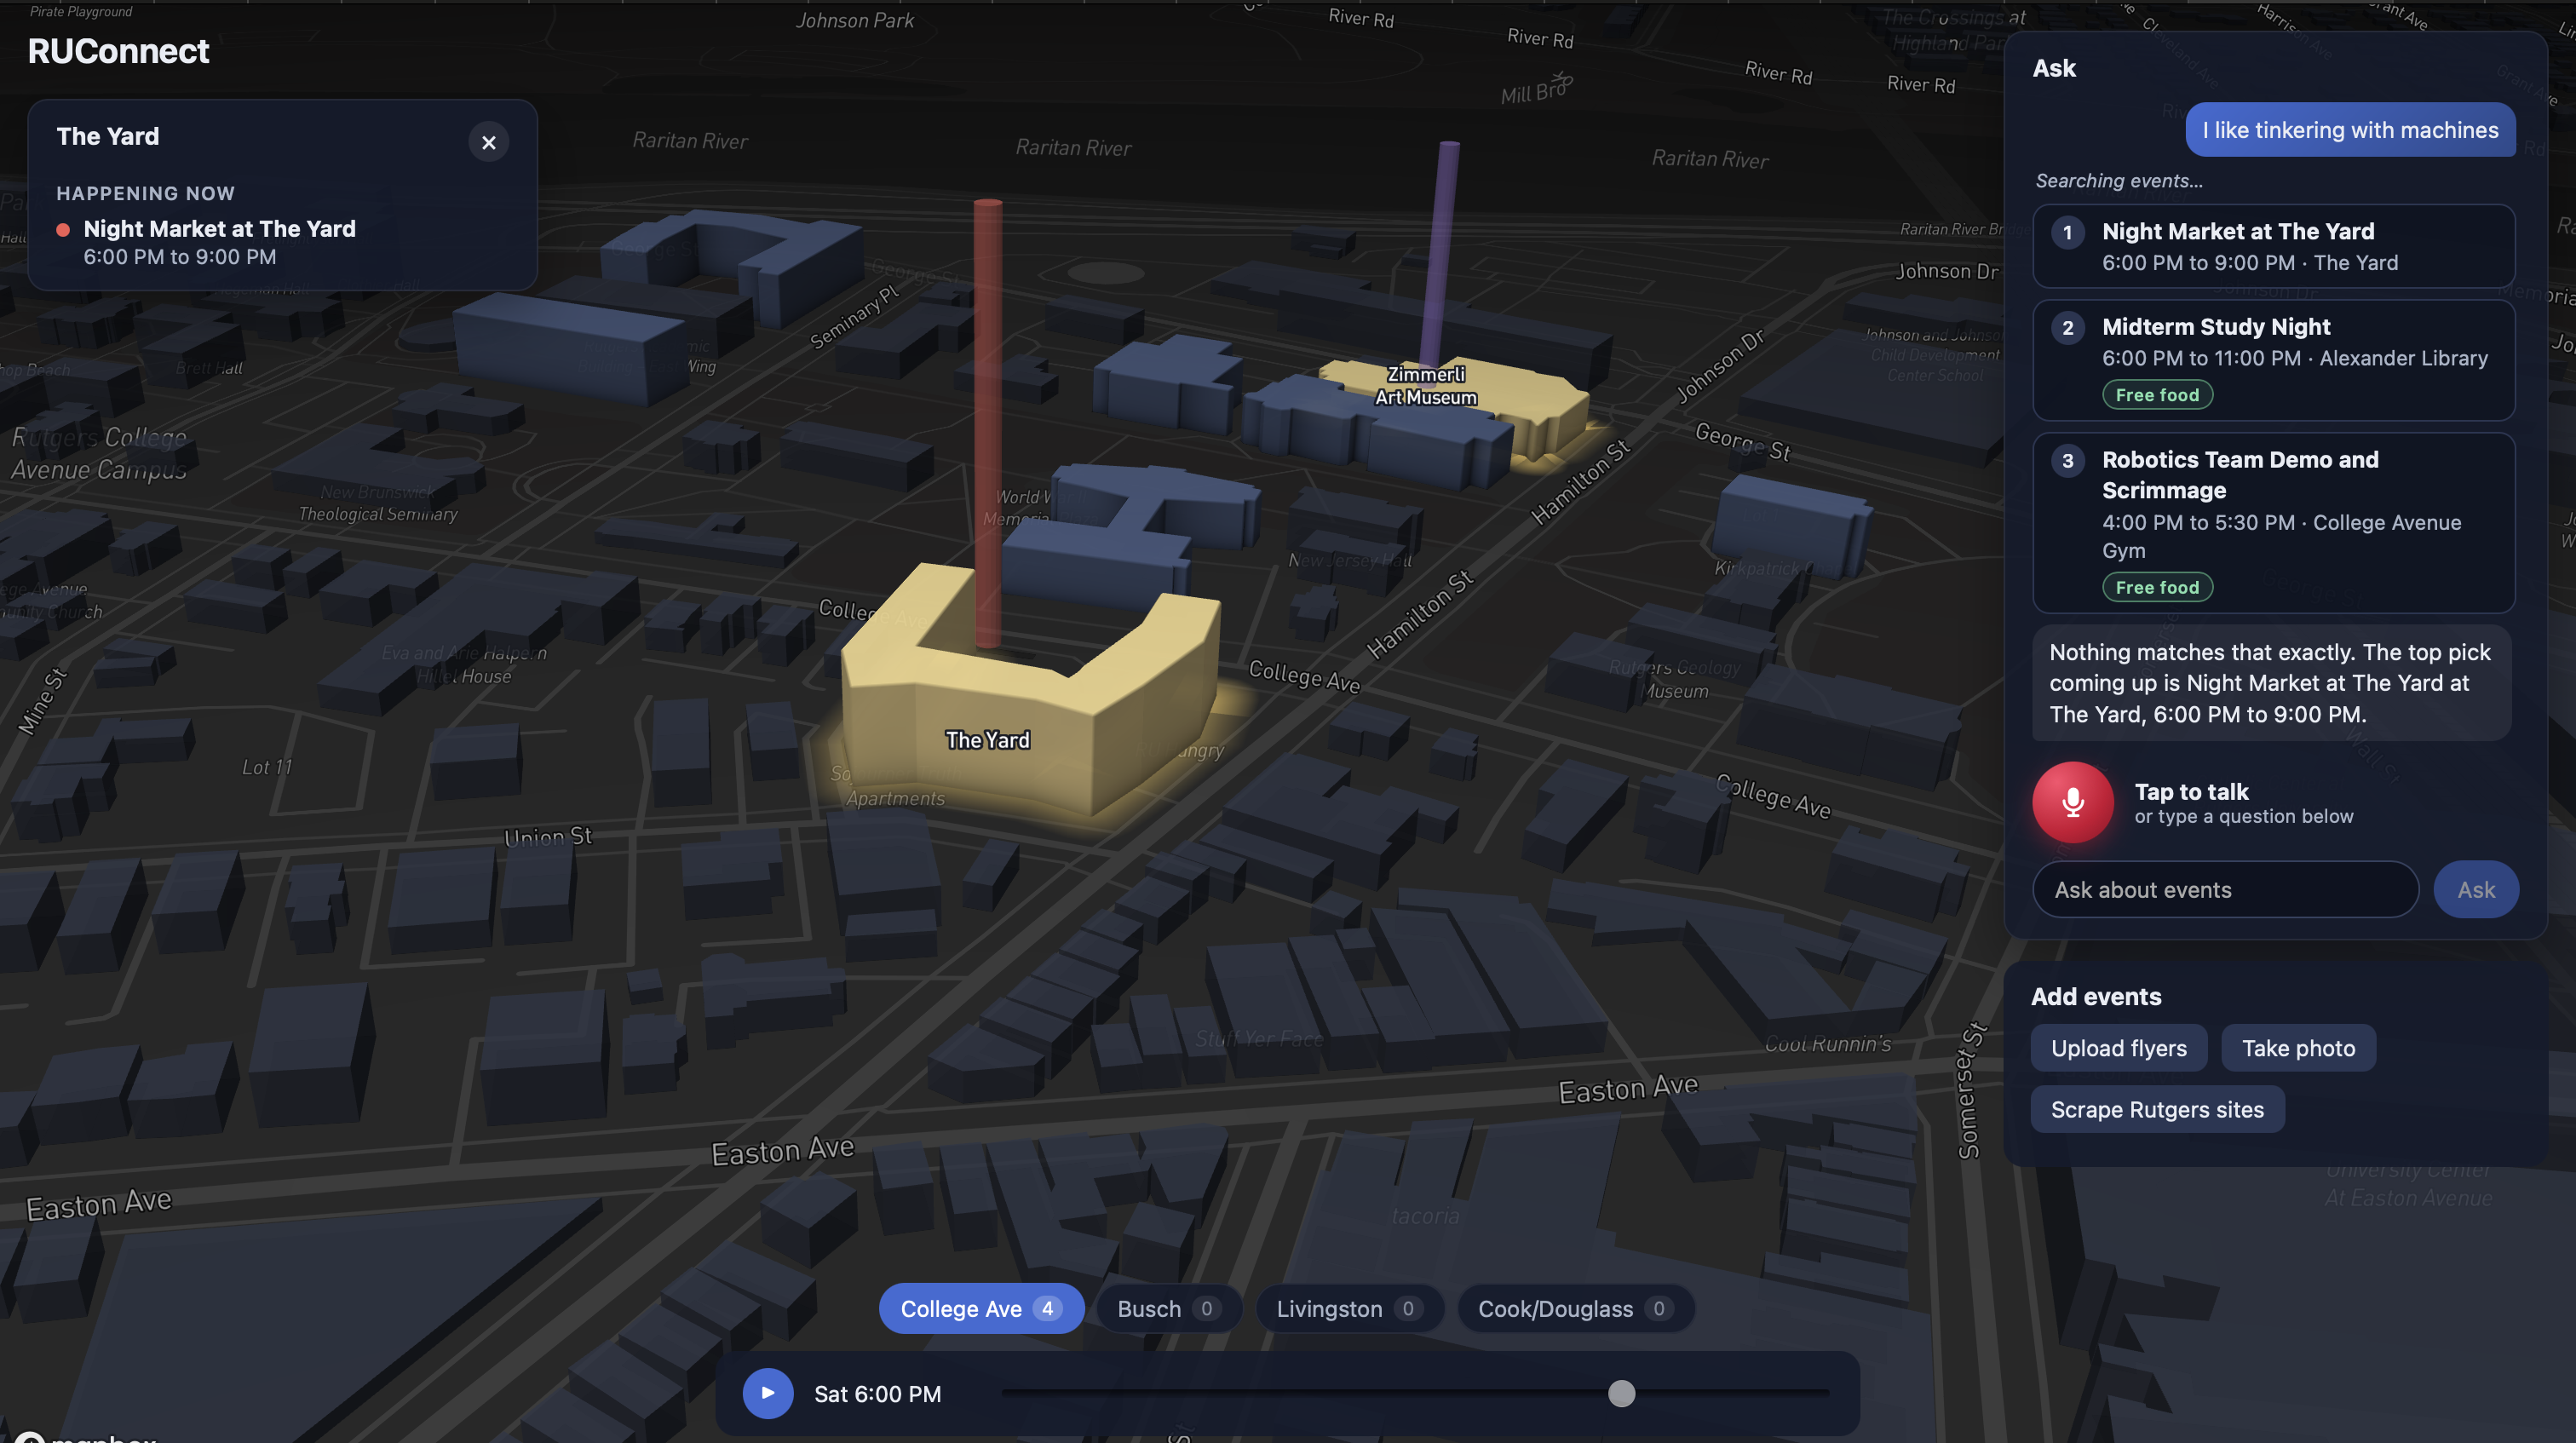
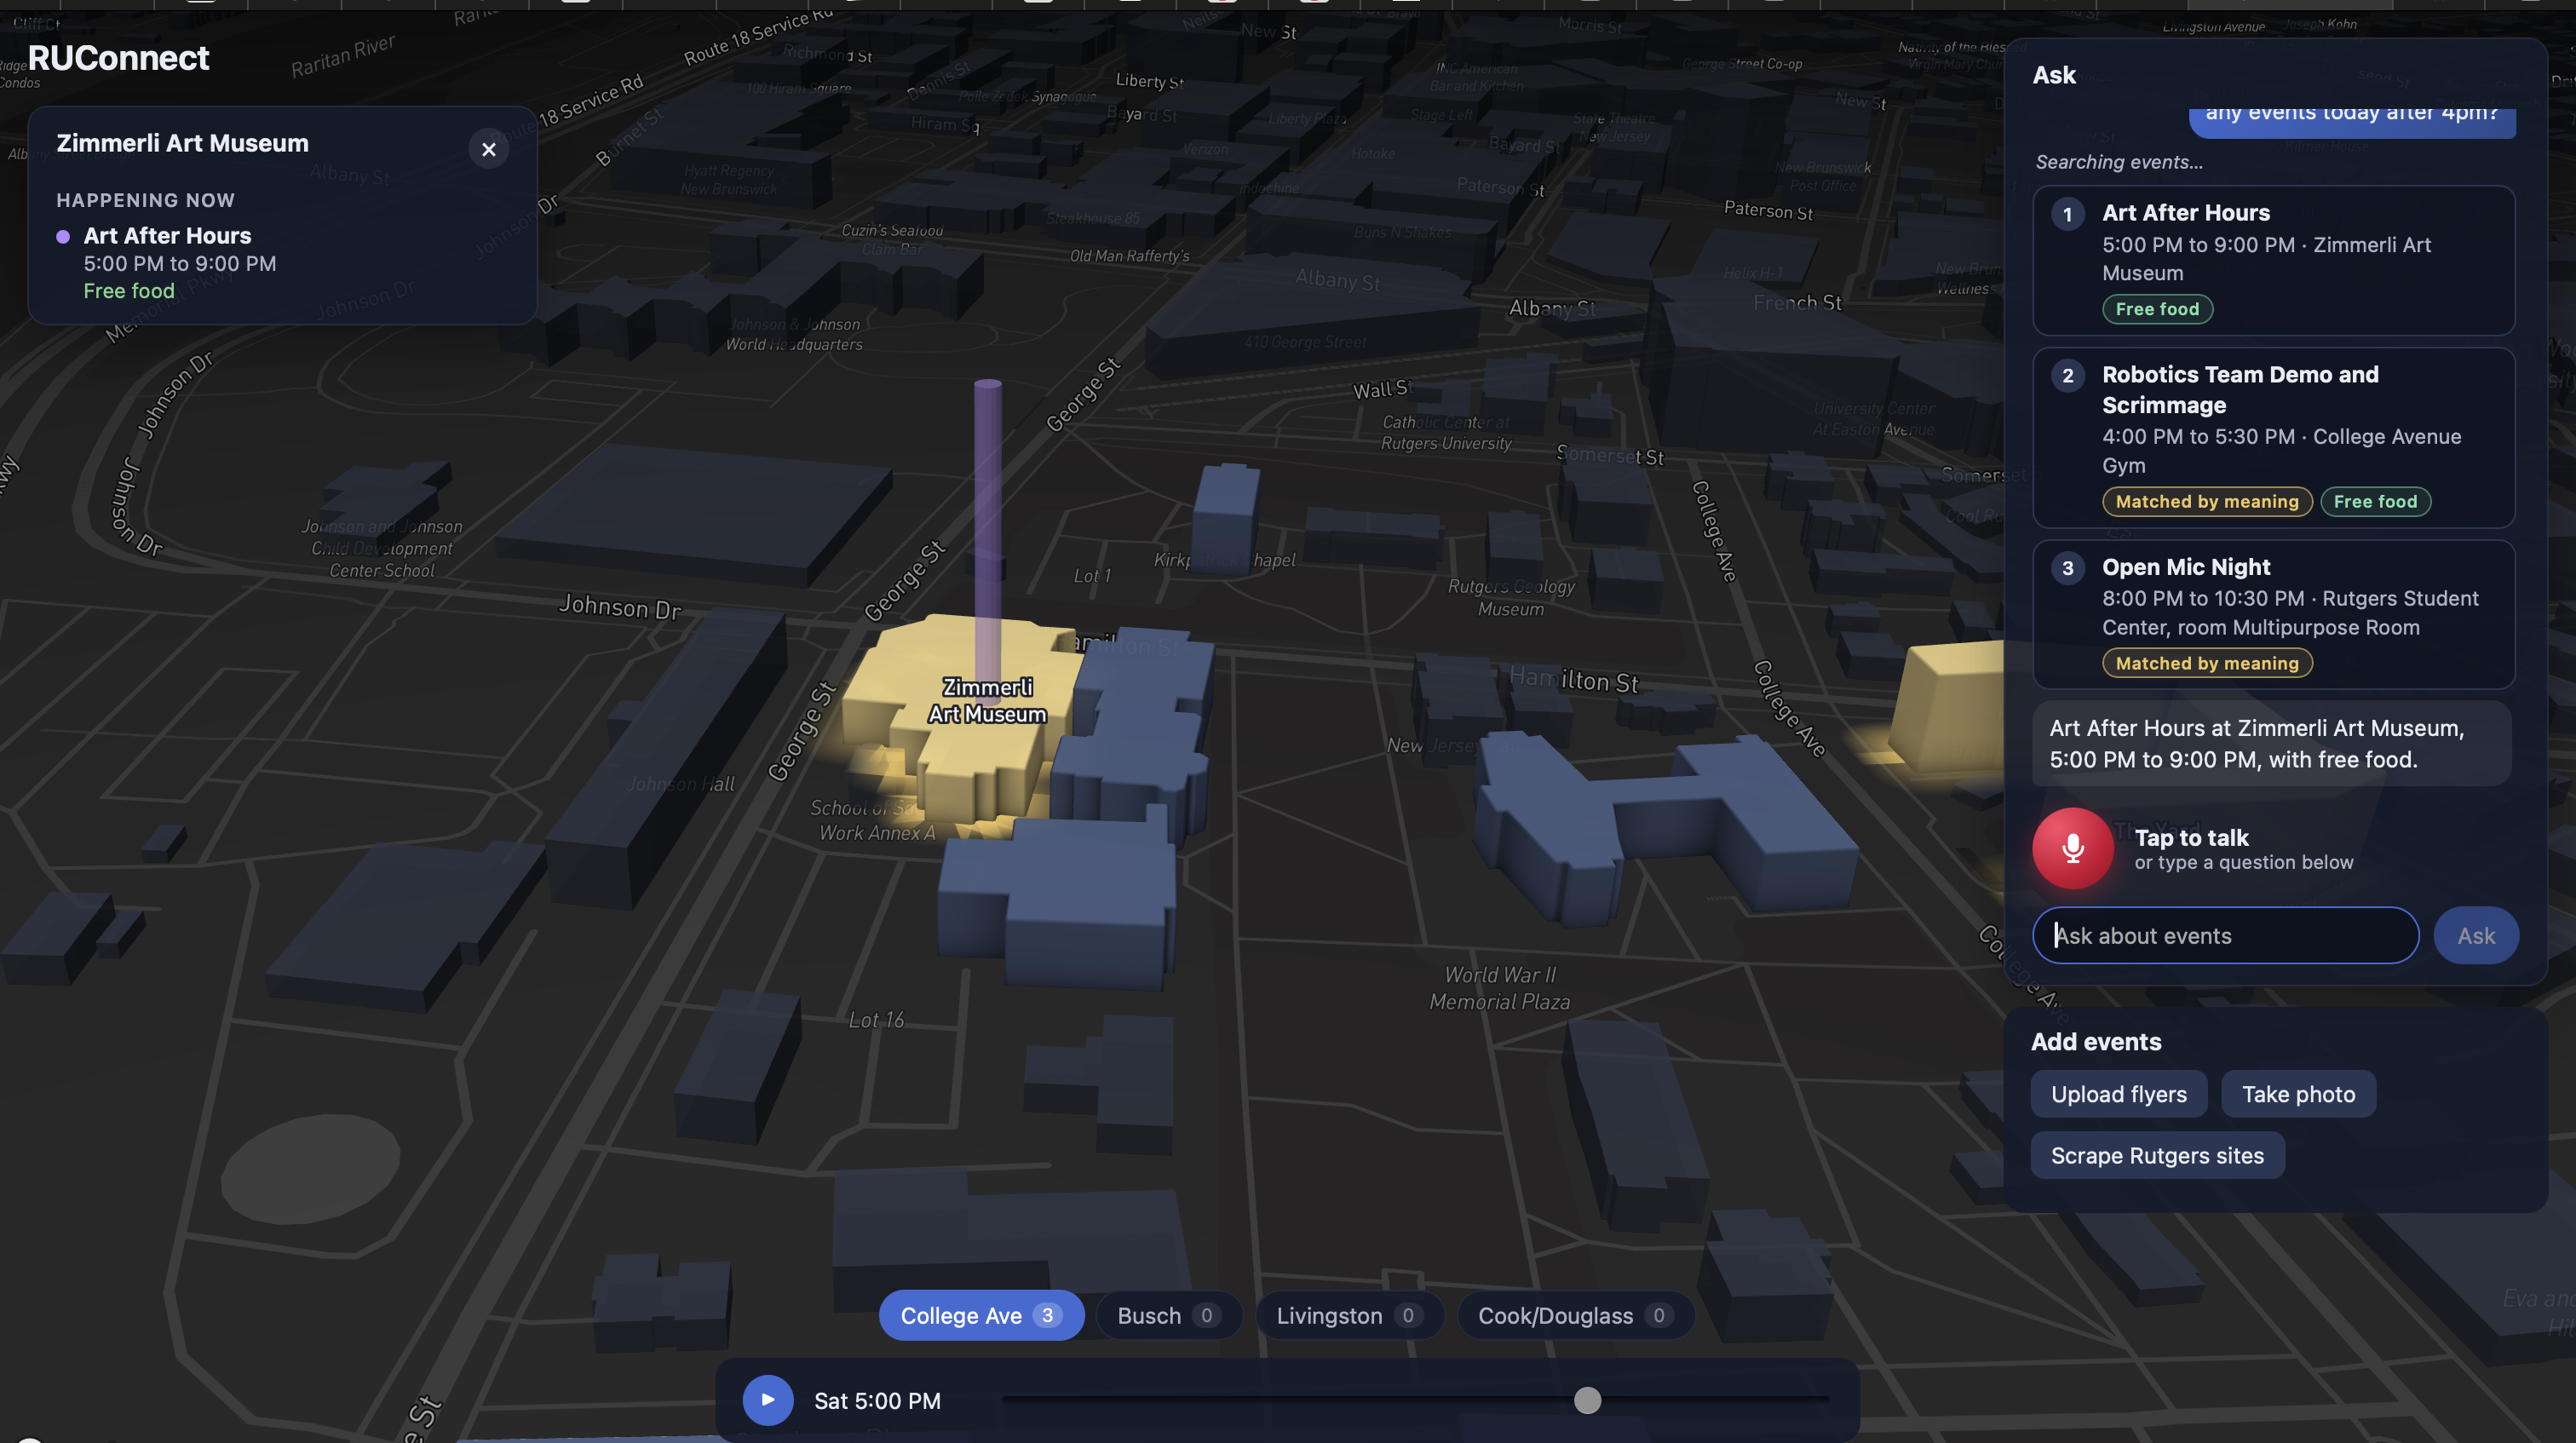
RUConnect brings campus life onto an interactive 3D map of Rutgers–New Brunswick, covering College Ave, Busch, Livingston, and Cook/Douglass. Buildings light up in the color of the event happening inside, pulse, and raise a beacon that grows with the expected crowd. A time slider plays the whole day forward so you can watch activity move across campus.
Events reach the map through a team of AI agents built to read any source. Today it turns photos of paper flyers, even crumpled ones, and public Rutgers event pages into events on the map, and the same pipeline is ready for club Instagram posts, Reddit threads, and newsletters next. The fastest way to use it is to ask: a voice assistant takes a question like "I'm free until 4, I like robotics and free food, what's near the library?", answers out loud, and flies the map to the building it recommends. It also understands questions that share no word with any event: "I like tinkering with machines" finds the robotics club.
How we built it
RUConnect is a TypeScript monorepo with three packages: a React and Vite client, an Express server, and a shared package of zod schemas that every API call, model response, and data file is validated against.
- Map: Mapbox GL JS with real building outlines from OpenStreetMap. Colors, glows, labels, and beacons are all animated through per-building state in a single frame loop, so nothing switches on or off abruptly.
- Ingestion: a swarm of Gemini agents with fixed roles. A Scout decides which event pages to open, a Reader extracts the events, a Critic checks each reading against the source and sends mistakes back for a second read, and a Deduper drops events already on the map. Each step streams live to the UI.
- Voice: an ElevenLabs Conversational AI agent with two client tools, one that searches events and highlights the matches, and one that flies the camera to the chosen building. The server issues a short-lived session credential so the API key never reaches the browser.
- Search: events live in Postgres on Tiger Data. The server embeds each question with Gemini, pgvector compares it with every event, and that similarity is blended with keyword, time, distance, and free-food ranking.
Three of us worked in the same repo at once, each with an AI coding agent. We split the app into three slices (map, ingestion, voice), froze the shared contracts on day one, and had the slices talk only through shared types and the HTTP API.
Challenges we ran into
- Making the map animate smoothly. Our first approach to pulsing buildings made Mapbox reload the building tiles every frame, and the colors vanished. We rebuilt all animation on per-building state. Separately, building labels delayed the whole map by several seconds on a cold load until we gave them their own data source.
- Reading messy flyers reliably. A single model call misreads dates and rooms on tilted, dim, or creased flyers. Adding a Critic that checks the reading against the image, and a confidence threshold that sends doubtful events to review instead of publishing them, made the results trustworthy.
- Voice and a demo clock. The voice model writes dates from the real day, while our demo runs at a fixed time. We had to translate its dates onto the demo day without breaking questions like "tonight until midnight".
- Three people, three agents, one repo. Without strict ownership rules the agents would have overwritten each other's work. Even with them, we had one commit sweep up another session's unfinished changes and had to untangle it.
- Infrastructure surprises. Free-tier model limits ran out after about twenty flyer reads, some Rutgers event sites sit behind bot checks we chose not to bypass, and one Wi-Fi network blocked our database port entirely.
Accomplishments that we're proud of
- You can ask a question out loud and watch the map fly to the answer, end to end, with real data.
- Search by meaning works: a question with no matching keywords still finds the right events.
- A photo of a creased, badly lit flyer becomes a correctly placed event on the map in a few seconds.
- All four New Brunswick campuses are on the map, with 41 real building outlines.
- The project has more than 250 automated tests and a mock mode that runs the whole demo with no API keys, built in a weekend.
What we learned
- Agreeing on the contracts first is what lets a team move in parallel. Freezing the shared types on day one meant three slices could be built separately and still fit together.
- AI agents are far more reliable with a narrow role and a second agent checking their work than as one model asked to do everything.
- Blending vector search with plain keyword, time, and distance ranking beats either alone, and the keyword path is a necessary fallback when an embedding call fails.
- Every live dependency needs a fallback for demo day: cached flyer readings, typed questions when voice fails, bundled data when the database is unreachable.
What's next for RUConnect
- Ingest events for every campus. The map covers all four today, but the flyer pipeline and the voice agent's prompt still focus on College Ave.
- Live crowd "energy" per building from ambient sound levels.
- More sources: club Instagram accounts and the remaining university event boards.
- Accessibility routes and audio descriptions.
- Personalized recommendations, accounts, and notifications for events that match your interests.
Built With
- elevenlabs
- gemini
- mapbox
- tigerdata
- typescript
- vite


Log in or sign up for Devpost to join the conversation.