-
-
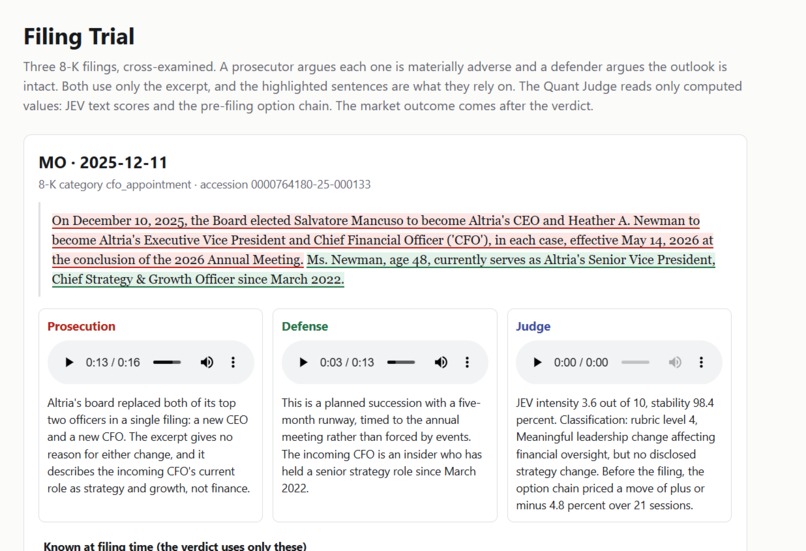
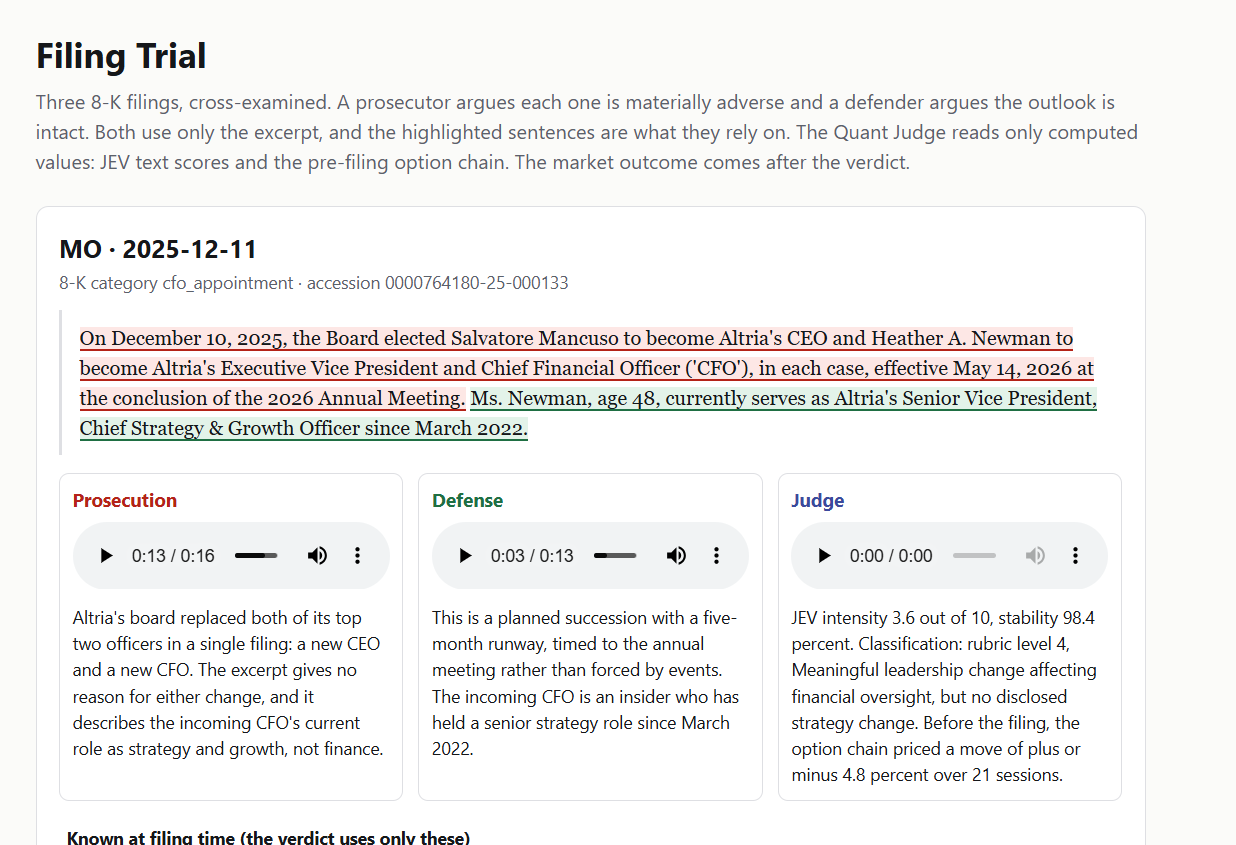
Filling trial from https://luisgandora.github.io/GatorQuantHacks_2026/trial/
Inspiration
This was our entire team’s first time working with quantitative finance, so the weekend came with a steep learning curve. We had to learn unfamiliar terminology, understand options strategies, and figure out how to analyze market data and SEC filings without accidentally using future information.
Rather than starting with a strategy we already knew would work, we focused on forming hypotheses, testing them systematically, and being willing to reject them when the evidence disagreed.
What it does
Low Taper Fade is a research notebook that brings together our hackathon experiments using Massive’s historical market and options data and disclosures from SEC 8-K filings.
Our primary experiment tested whether fresh leadership-change disclosures create an opportunity to sell cash-secured puts. The intuition was that investors surprised by a leadership change might overpay for downside protection, making those puts attractive to sell.
Our results did not support that opportunity. Put selling after fresh leadership filings underperformed our ordinary-day benchmark in both the in-sample and out-of-sample windows. The modeled portfolio also lost money after assumed trading costs.
The out-of-sample benchmark differences were not statistically significant, so we present this as evidence against the proposed opportunity, rather than proof of a universal market rule or a profitable opposite trade.
How we built it
We built an experiment-driven pipeline around SEC disclosures and Massive’s historical options data.
In earlier experiments, we used JEV to classify filing excerpts as abrupt or routine, helping distinguish unexpected events from planned transitions. Our final leadership experiment used SEC filing metadata to classify disclosures as fresh or stale. That classification measures how quickly a filing followed the reported event; it does not establish when the news first became public.
We connected those events to historical options chains and used filing acceptance timestamps to determine the entry session. Filings accepted after market close moved to the following trading session, and missing prices remained missing rather than being filled with future data.
We also documented remaining limitations. In particular, our historical universe used a September 2026 company list, which introduces survivorship and universe-selection bias.
Throughout the hackathon, we used AI tools to help develop hypotheses, design experiments, inspect results, and organize the research.
Challenges we ran into
One of our biggest challenges was that many hypotheses did not survive testing.
Some experiments became inconclusive because the qualifying sample shrank once we applied stricter event definitions and data requirements. Others showed no meaningful edge. Each experiment still required collecting data, defining the signal, aligning timestamps, pricing options, and interpreting the results.
Another challenge was separating what the data showed from what we hoped it meant. A strategy underperforming a benchmark does not automatically prove that options were mispriced, and a negative result for selling puts does not establish that buying puts would work.
Failed experiments consumed a substantial part of our weekend, but they also taught us how valuable a carefully qualified negative result can be.
Accomplishments that we're proud of
We’re proud that we entered an unfamiliar domain and built a research project within a weekend.
We had to learn the financial concepts while implementing the pipeline and checking whether our experiments actually answered the questions we were asking.
We’re also proud that we did not force the results to support our original intuition. Our final project is not a profitable strategy with an impressive backtest. It is a documented investigation that found insufficient support for a plausible trading idea.
Reporting that result honestly, including its limitations, became an important part of the project.
What we learned
We learned that quantitative research depends on precise definitions, reliable data, and disciplined testing as much as it depends on an interesting idea.
We learned how easily bias can enter a backtest, why filing freshness is different from first public disclosure, and why sample size and statistical uncertainty matter when interpreting results.
On the technical side, we gained experience with historical options data, SEC filing timestamps, semantic classification with JEV, benchmark comparisons, and out-of-sample evaluation.
Most importantly, we learned that finding evidence against a strategy can be useful—even when the evidence does not justify a definitive conclusion.
What's next for Low Taper Fade
We would build on our broader 8-K category experiments, which screened 18 disclosure categories without finding one that passed the multiple-testing threshold.
With more time, we would use a point-in-time company universe, expand the historical sample, improve event classification, and better distinguish filing dates from the first public announcement. We would also refine trading-cost assumptions and test new hypotheses across different market regimes.
Our larger goal is to turn the notebook into a reusable research framework where a hypothesis can move from an SEC disclosure to a structured event definition and a controlled market test, with clear records of what was tested, what failed, and what remains uncertain.

Log in or sign up for Devpost to join the conversation.