-
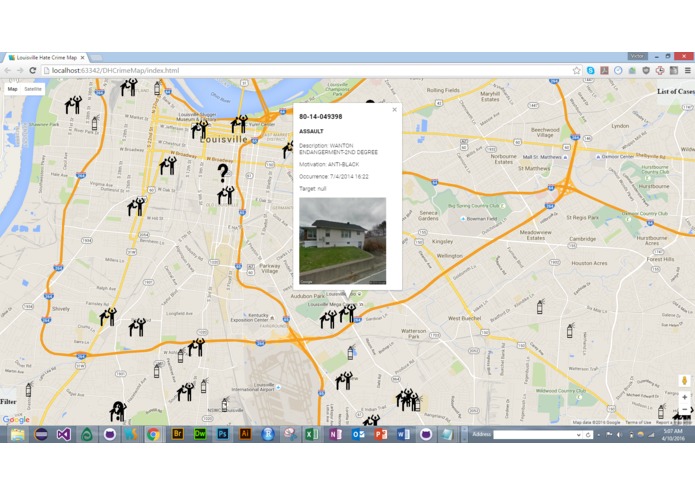
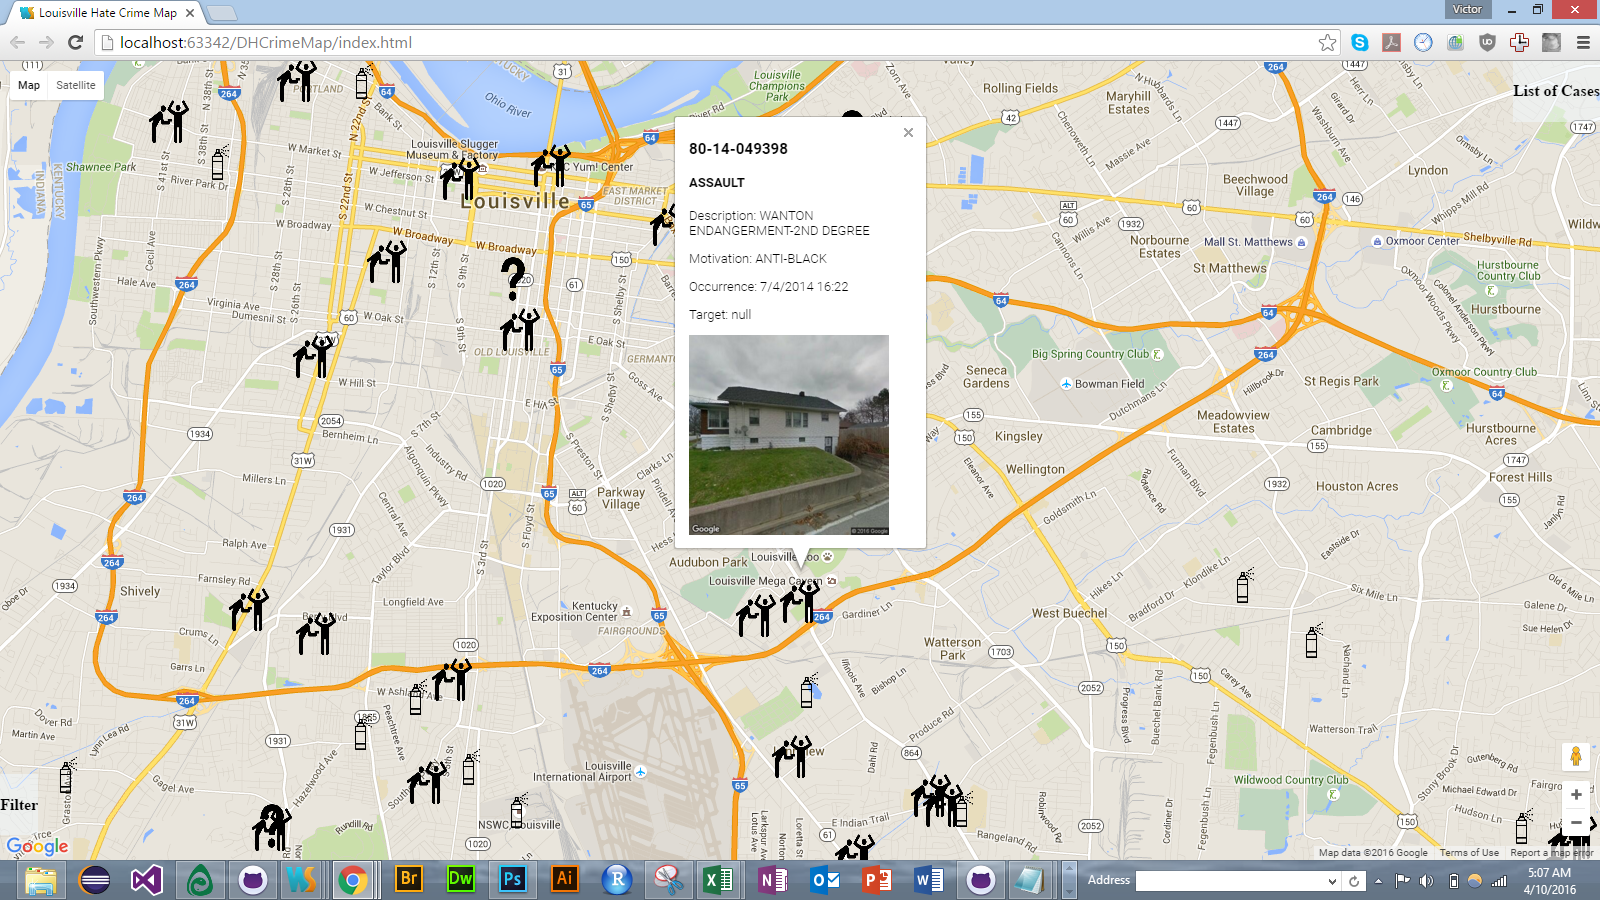
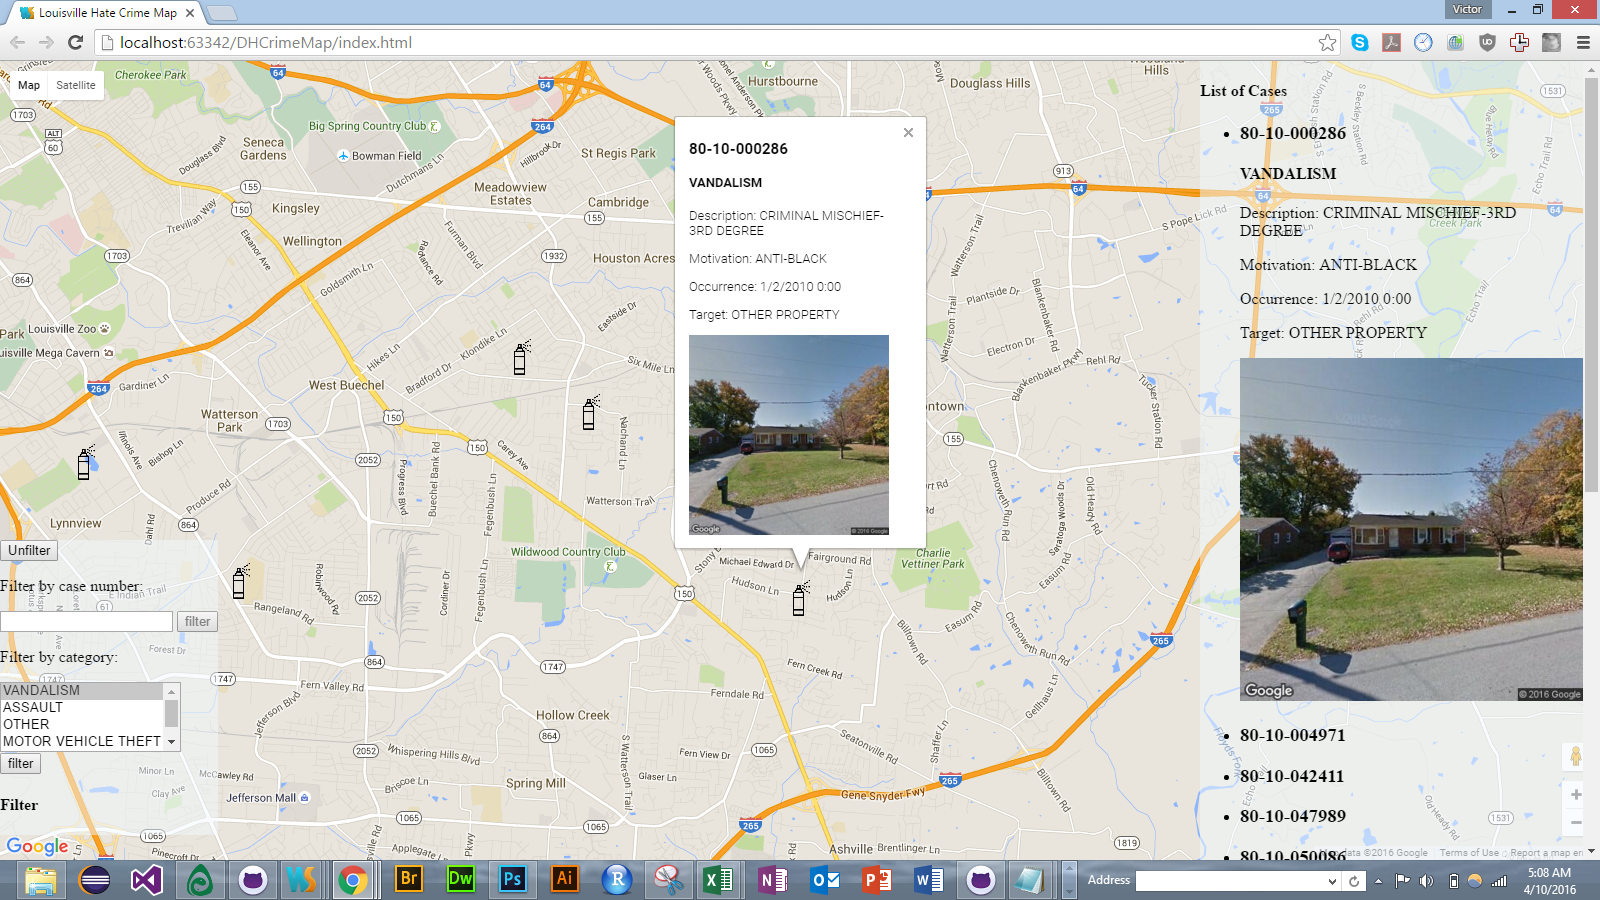
Desktop
-
Functional
-
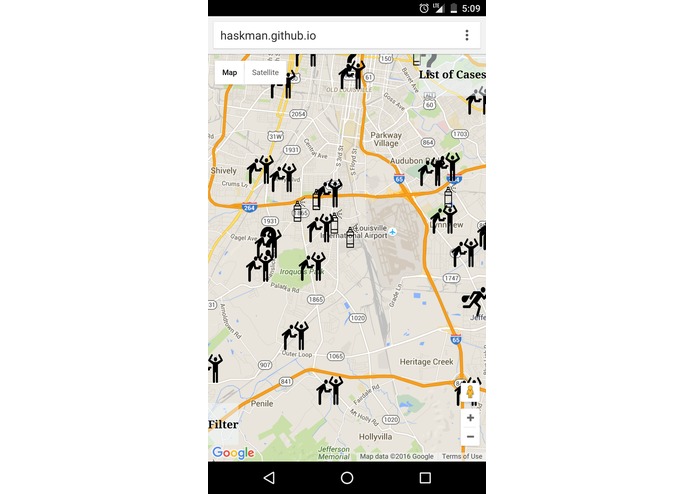
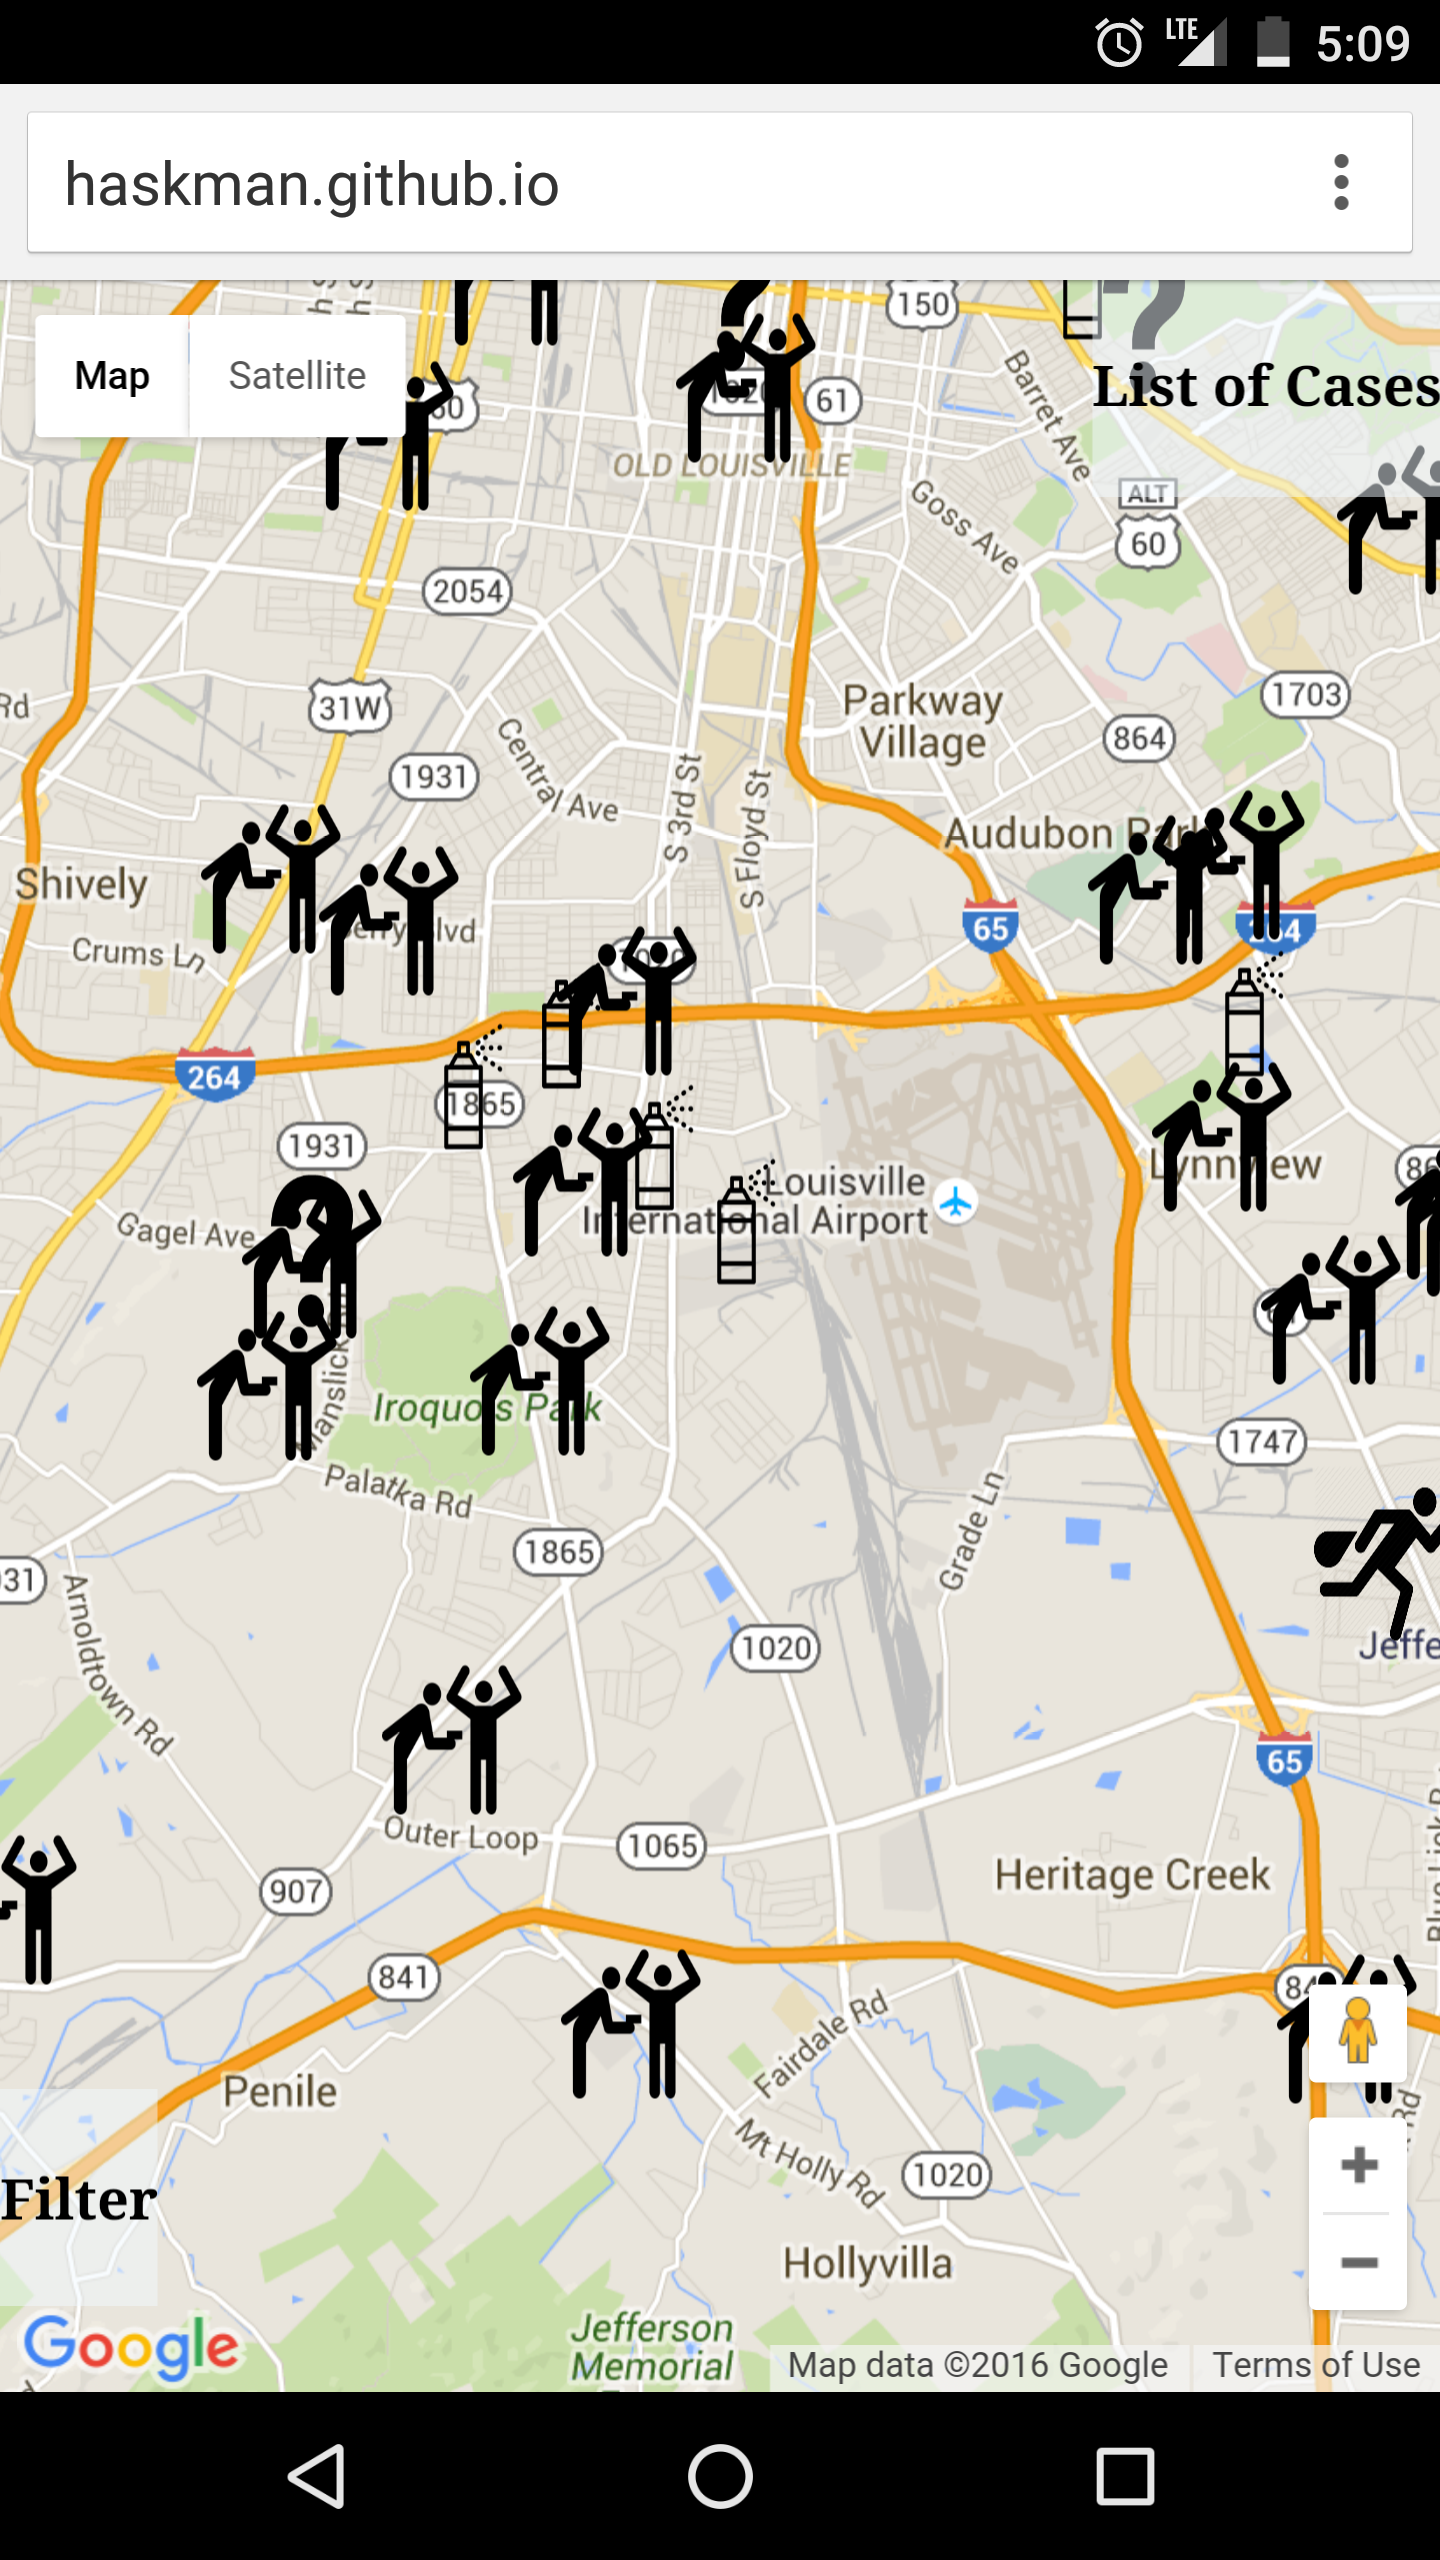
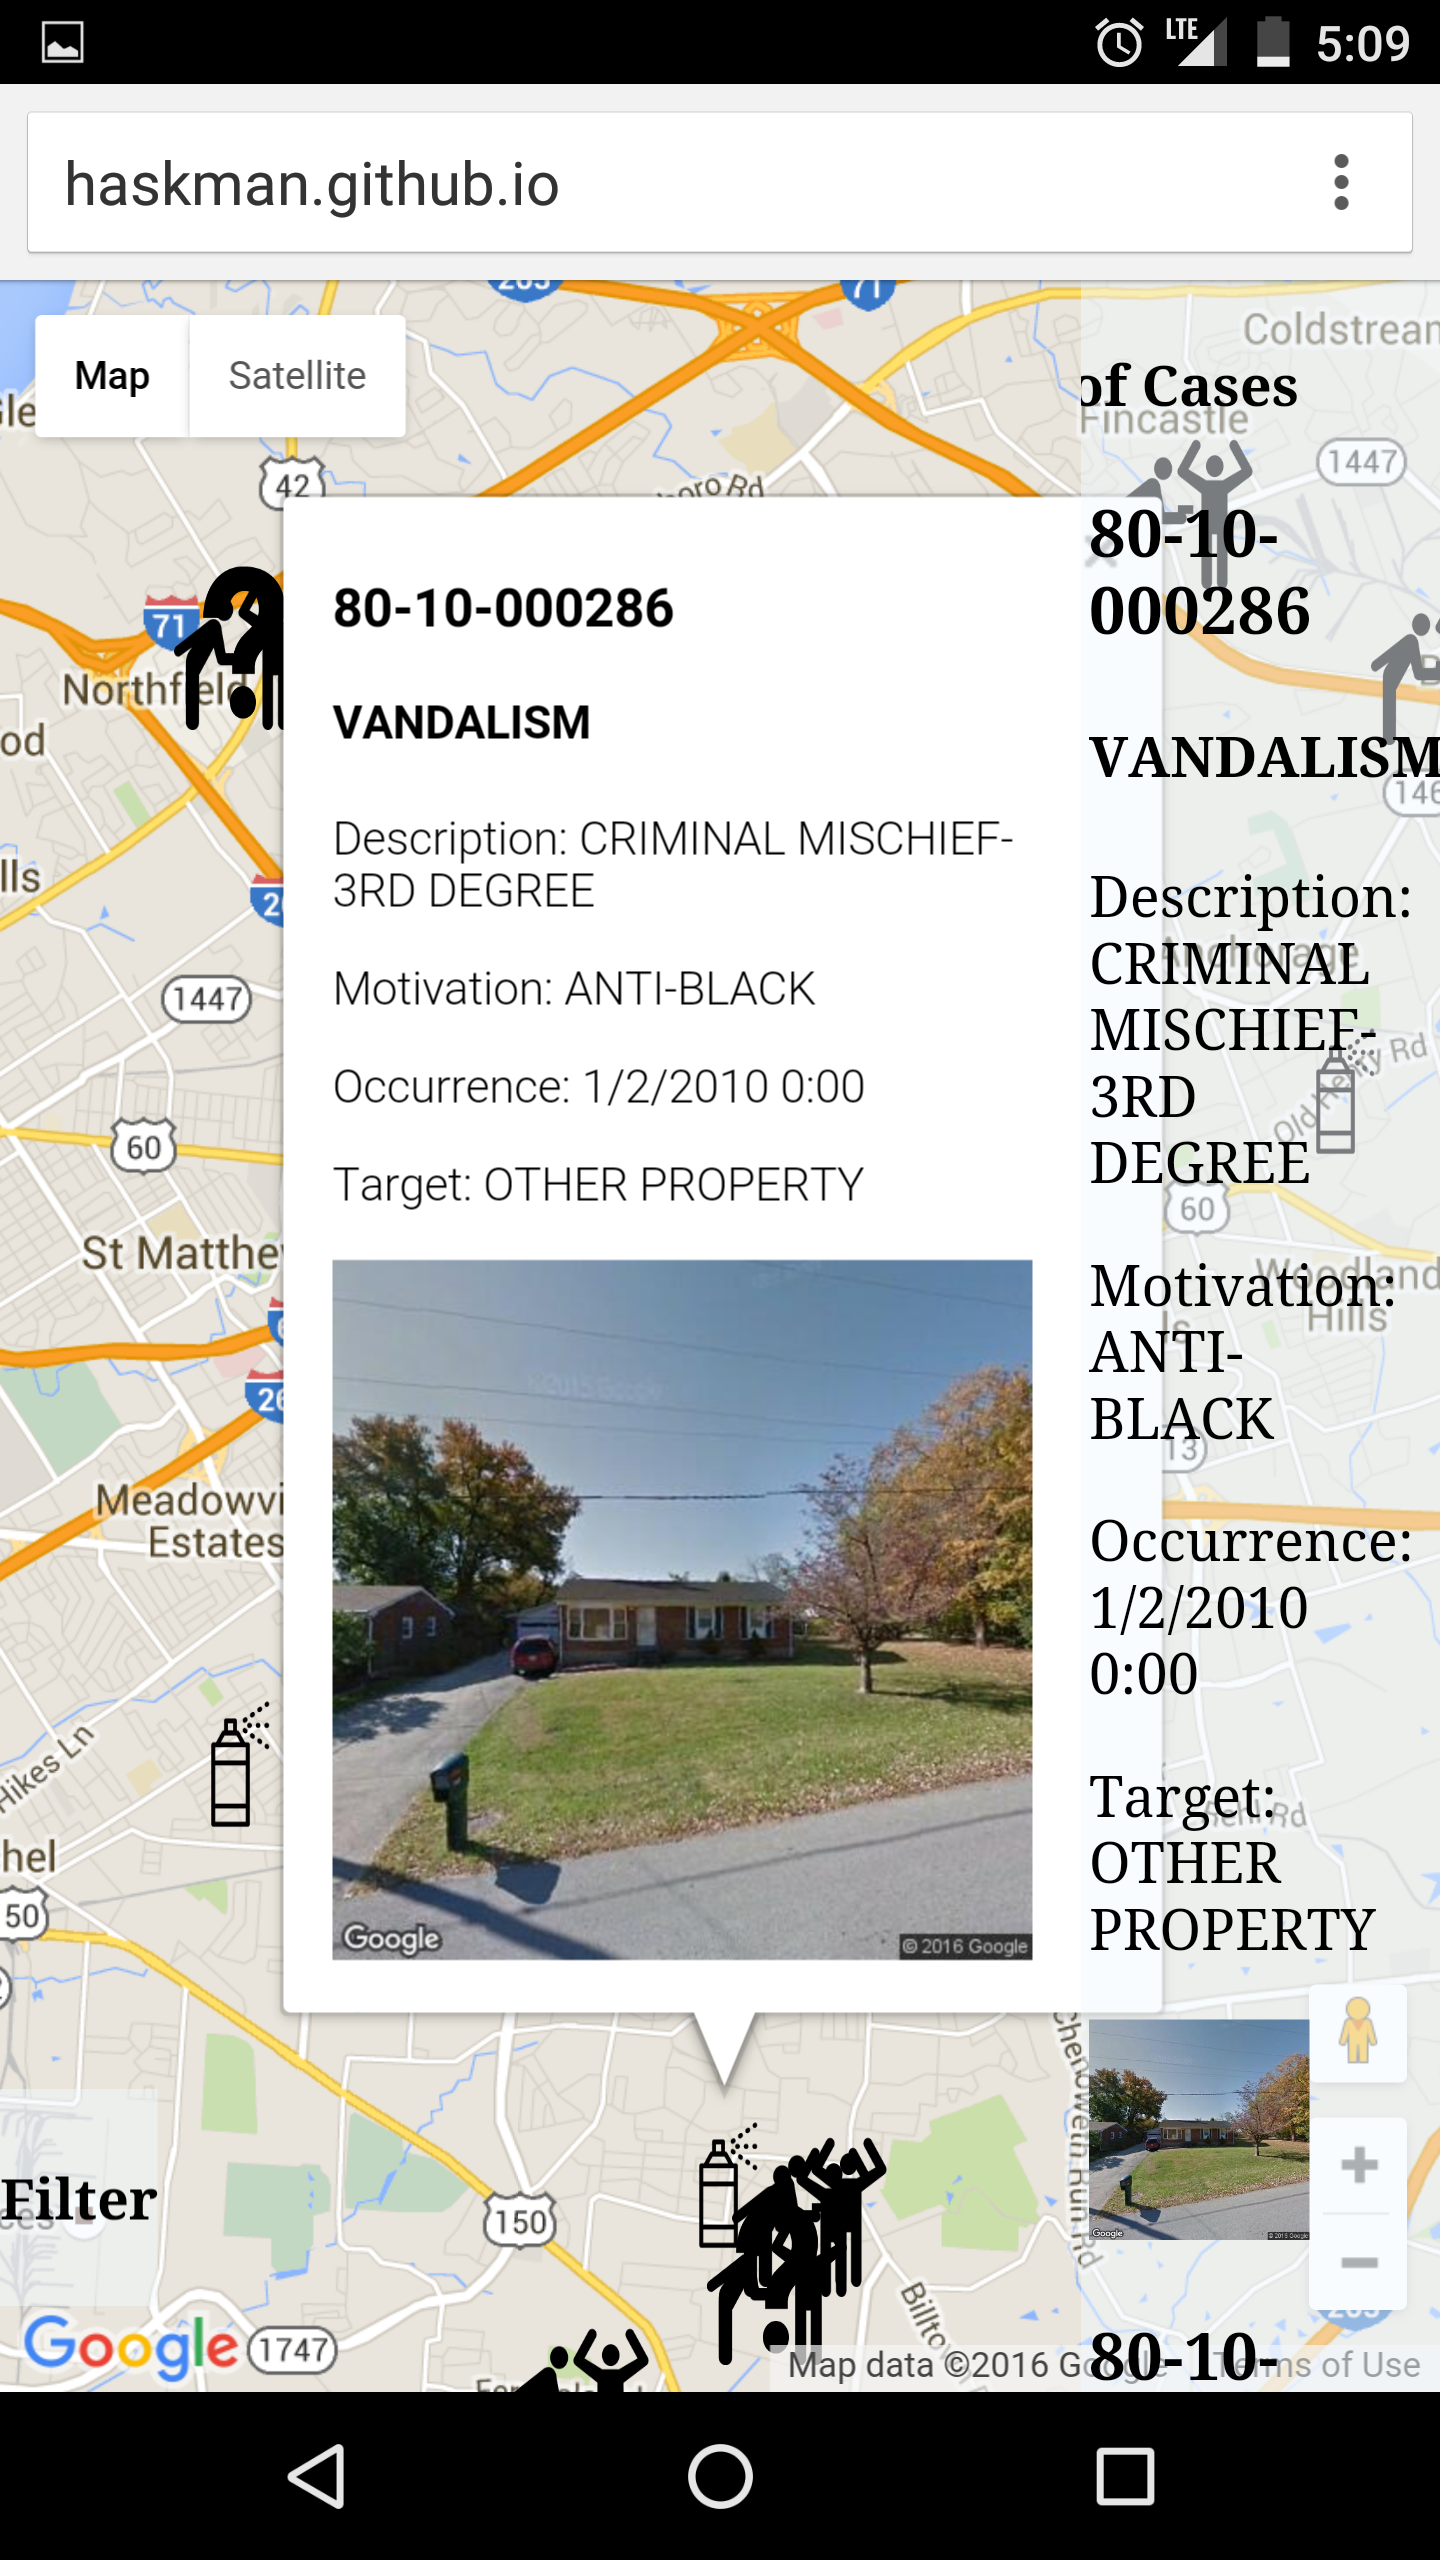
Also on mobile
-
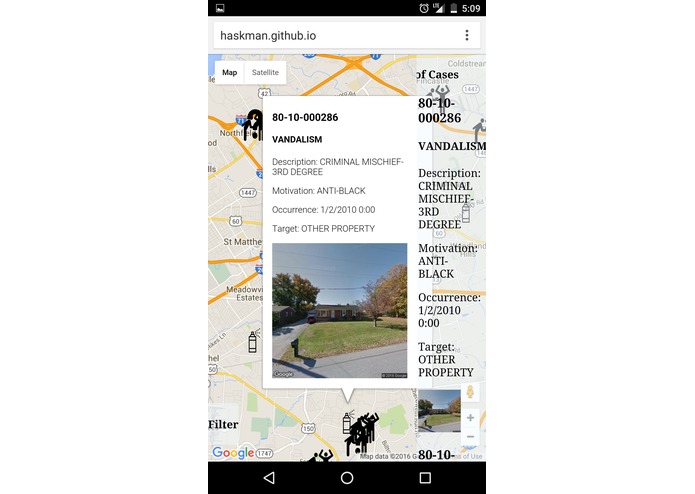
Also functional
Inspiration
I built this project to utilize the public data provided by Louisville in an interactive and potentially useful way
What it does
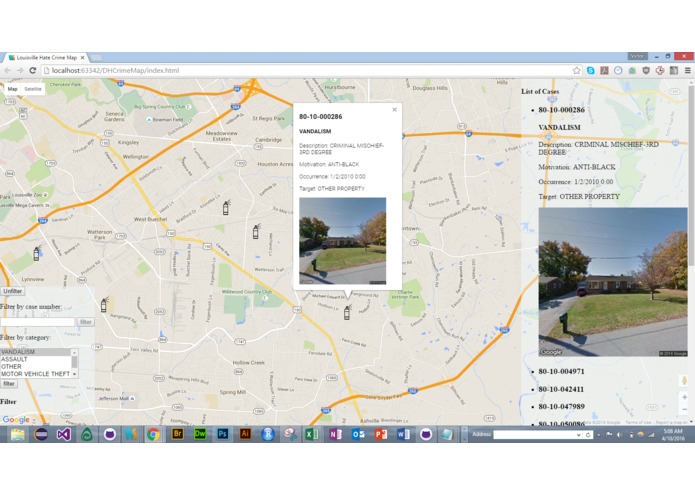
It visualizes the data on hate crime reports within the last few years on an interactive map. The functionality includes a case number search, category filtering and an interactive list of cases besides the functionality provided by the map.
How I built it
I processed the data using Python to convert it to JSON. I then built the website using knockout.js for real-time interactivity, and Google Maps API to show the locations each event on the data set occurred.
Challenges I ran into
Fully automating the data processing portion of the project turned out to be a real challenge. Problems with geocoding, compatibility issues, and the relatively unpredictable nature of JavaScript caused the project to take longer than I expected. At the end, I had to do workarounds and as result, I could not accomplish my goal of fully automating data processing.
Accomplishments that I'm proud of
I ended up finishing a good-looking, functioning and user-friendly project that does exactly what I wanted.
What I learned
I learned about integrating multiple frameworks to work coherently for a single product. I also learned a lot about cup stacking!
What's next for Louisville Hate Crime Map
More automation, less AJAX bypassing. Also smoother icons
 Sahin")
Log in or sign up for Devpost to join the conversation.